HAL Id: hal-00329019
https://hal.archives-ouvertes.fr/hal-00329019
Submitted on 15 Sep 2005
HAL is a multi-disciplinary open access
archive for the deposit and dissemination of
sci-entific research documents, whether they are
pub-lished or not. The documents may come from
teaching and research institutions in France or
abroad, or from public or private research centers.
L’archive ouverte pluridisciplinaire HAL, est
destinée au dépôt et à la diffusion de documents
scientifiques de niveau recherche, publiés ou non,
émanant des établissements d’enseignement et de
recherche français ou étrangers, des laboratoires
publics ou privés.
phase as observed with a radial configuration of ISTP
and Cluster spacecraft
V. A. Sergeev, M. V. Kubyshkina, W. Baumjohann, R. Nakamura, O. Amm,
T. Pulkkinen, V. Angelopoulos, S. B. Mende, B. Klecker, T. Nagai, et al.
To cite this version:
V. A. Sergeev, M. V. Kubyshkina, W. Baumjohann, R. Nakamura, O. Amm, et al.. Transition from
substorm growth to substorm expansion phase as observed with a radial configuration of ISTP and
Cluster spacecraft. Annales Geophysicae, European Geosciences Union, 2005, 23 (6), pp.2183-2198.
�hal-00329019�
© European Geosciences Union 2005
Geophysicae
Transition from substorm growth to substorm expansion phase as
observed with a radial configuration of ISTP and Cluster spacecraft
V. A. Sergeev1, M. V. Kubyshkina1, W. Baumjohann2, R. Nakamura2, O. Amm3, T. Pulkkinen3, V. Angelopoulos4, S. B. Mende4, B. Klecker5, T. Nagai6, J.-A. Sauvaud7, J. A. Slavin8, and M. F. Thomsen9
1St. Petersburg State University, Petrodvoretz, 198504 St. Petersburg, Russia
2Austrian Academy Science, Space Research Inst., Schmiedlstrasse 6, Graz, 8042, Austria 3Finnish Meteorological Inst., Helsinki, FIN 00101, Finland
4Univ California, Space Sciences Lab., 7 Gauss Way, Berkeley, CA 94720, USA 5Max Planck Institut fur Extraterrestrische Physik, D-85741 Garching, Germany
6Tokyo Inst Technology., Dept Earth & Planetary Sciences., Ookayama 2-12-1 Meguro., Tokyo, 152-8551, Japan 7CESR, 9 Ave Colonel Roche, Toulouse Cedex 4, 31028, France
8NASA Goddard Space Flight Center, Greenbelt, MD 20771, USA 9Los Alamos Natl Lab., MS D466, Los Alamos, NM 87545, USA
Received: 29 September 2004 – Revised: 29 March 2005 – Accepted: 23 May 2005 – Published: 15 September 2005
Abstract. Transition from the growth phase to the substorm
expansion during a well-isolated substorm with a strong growth phase is investigated using a unique radial (THEMIS-like) spacecraft constellation near midnight, including the probing of the tail current at ∼16 RE with Cluster, of the
transition region at ∼9 RE with Geotail and Polar, and of
the inner region at 6.6 RE with two LANL spacecraft. The
activity development on both a global scale and near the spacecraft footpoints was monitored with global auroral im-ages (from the IMAGE spacecraft) and the ground network. Magnetospheric models, tuned using situ observations, in-dicated a strong tail stretching and plasma sheet thinning, which included the growth of the near-Earth current (ap-proaching 30 nA/m2) and possible formation of a local B minimum in the neutral sheet (∼5 nT) at ∼10–12 RE near
the substorm onset. However, there were no indications that the substorm onset was initiated just in this region. We em-phasize the rather weak magnetic and plasma flow pertur-bations observed outside the thinned plasma sheet at Clus-ter, which could be interpreted as the effects of localized earthward-contracting newly-reconnected plasma tubes pro-duced by the impulsive reconnection in the midtail plasma sheet. In that case the time delays around the distinct sub-storm onset are consistent with the activity propagation from the midtail to the inner magnetosphere. A peculiar feature of this substorm was that 12 min prior to this distinct onset, a clear soft plasma injection to the GEO orbit was recorded which has little associated effects both in the ionosphere and in the transition region at ∼9 RE. This pseudo-breakup was
probably due to either a localized ballooning-type activity or
Correspondence to: V. A. Sergeev
due to the braking of a very narrow BBF whose signatures were also recorded by Cluster. This event manifested the (previously unknown) phenomenon, a strong tail overload-ing (excessive storage of magnetic energy) contrasted to the modest energy dissipation and plasma acceleration, which are both discussed and interpreted as the consequences of cold/dense and thick pre-substorm plasma sheet which often occurs after the long quiet period. The lessons of using the radial spacecraft configurations in substorm onset studies are also discussed.
Keywords. Magnetospheric physics (Auroral phenomena,
plasma sheet, storms and substorms)
1 Introduction
There are few areas of general agreement concerning the development of the substorm and mechanisms involved into this transition from the growth phase to the expansion phase. There seems to be a consensus that the growth of the tail current in the midtail and inner tail regions provides the main free energy source and forms the conditions for the instability to grow explosively. Since the first two International Substorm Conferences many observational facts were presented to show that the breakup and substorm expansion (may) start deep inside of the closed plasma sheet tubes and that the transition region (7–12 RE) between
the thin current sheet and the dipole-like magnetosphere is an important player in the substorm process (e.g. Kennell (1992)). Later, the large statistical surveys obtained with the Geotail spacecraft provided strong evidence that at substorm onset the magnetic reconnection starts typically at 20–25 RE
20 20.5 21 21.5 22 22.5 -60 -40 -20 0 20 -300 -200 -100 0 100 10 20 0 30 60 90 120 0 10 30 40 50 -10 -5 0 5 10 0 1 2
IMF BZ (ACE,Wind)
PC-index (Vostok)
BX-Cluster
BZ-Cluster
∆
BX
EXT(Polar-Geotail)
BZ Polar,Geotail
∆
X,
∆
Z
SOD
ASY - H
-
D
SYM
Geotail
Polar
Z
X
September 8, 2002
ACE (+45min)
Wind (+14min)
(a)
(b)
(c)
(d)
(e)
(f)
<SO>
< Q >
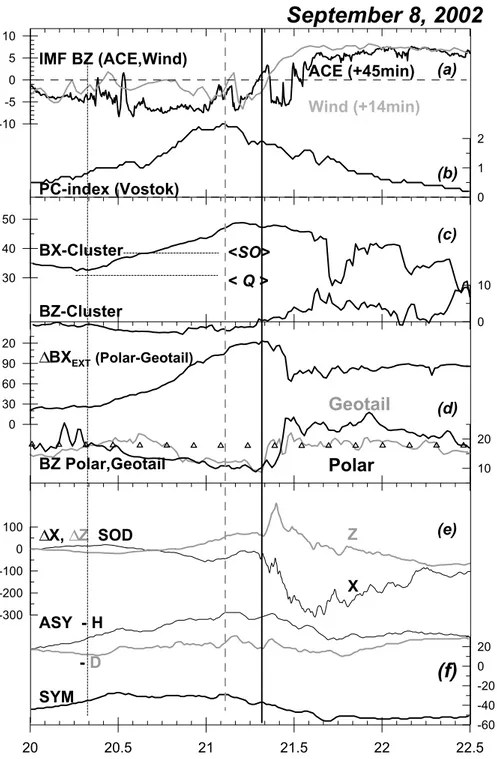
Fig. 1. Overview of activity at the end of 8 September 2002: From top to the bottom : (a) IMF BZ-variations at ACE and WIND spacecraft time-shifted to the subsolar magnetopause position, with their GSM coordianates and time shift applied; (b) polar cap PC-magnetic index from the Vostok station ; (c) BXand BZcomponent variations at Cluster; (d) difference of the BXcomponents of the external field at Polar and Geotail spacecraft and corresponding BZ field components (with T96 model values shown by triangles); (e) magnetic varitions from
Sodankyla (63.8◦CGLat); (f) midlatitude ASY/SYM indexes. The growth phase onset and substorm onset (21:18 UT) are marked by the vertical lines; the average values of the lobe field expected at the Cluster location for quiet conditions (<Q>) and at the unloading (substorm expansion) onset (<SO>) (after Shukhtina et al., 2004) are shown by the horizontal lines in the panel (c).
distance in the midtail (Nagai et al., 1998). Basic points of disagreement concern which process, magnetic recon-nection, MR, at 20–25 RE, or the current disruption, CD,
(generic name for yet unspecified instability in the transition region), starts first and how these regions communicate
to each other. Some attempts have also been reported to incorporate/combine both mechanisms/regions to explain the (sometimes contradictory) observational data (see, e.g. Erickson et al., 2000, and references therein).
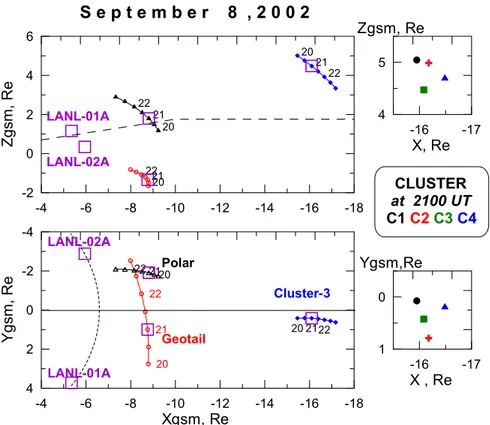
-4 -6 -8 -10 -12 -14 -16 -18 Xgsm, Re 4 2 0 -2 -4 Yg sm , Re 20 21 22 20 21 22 20 2122 -4 -6 -8 -10 -12 -14 -16 -18 -2 0 2 4 6 Zgs m , Re 20 21 22 20 21 22 20 21 22 -16 -17 X , Re 1 0 Ygsm,Re 4 5 Zgsm, Re -16 -17 X, Re Polar Cluster-3 Geotail LANL-02A LANL-01A
S e p t e m b e r 8 , 2 0 0 2
LANL-01A LANL-02A CLUSTER at 2100 UT C1 C2C3C4Fig. 2. Configuration of basic spacecraft on 8 September 2002 in GSM-coordinates. The neutral sheet position is indicated on the XZ cross section, spacecraft positions at 21:00 UT are marked by the rectangles.
This fundamental problem – to identify the basic substorm instability (by its location, propagation and manifestations) – is one of the main goals of the forthcoming THEMIS project. Its key elements are: (1) a “radial” spacecraft configuration (which combines the direct probing of the near-Earth CD re-gion with a cluster of 3 spacecraft positioned at ∼10 RE, the
probing of midtail reconnection and its communication with the inner region with two spacecraft at 18 and 30 RE) while
(2) supporting them by an extensive ground station network to monitor the timing and location of activations. Similar radial configuration can partly (and rarely) be realized with the existing fleet of ISTP spacecraft (e.g. Slavin et al., 2002; Baker et al., 2002).
Here we study a unique event, in which a well-isolated substorm was observed with Themis-like configuration in the region being conjugate to the initial auroral activation at sub-storm onset. The possibility to construct a sequence of mag-netospheric models by adjusting them to the actual observa-tions made by multiple spacecraft (rare experience) provide us with realistic current sheet parameters of the magnetotail, a reliable mapping and the knowledge of temporal evolution. In addition to addressing the timing and onset location is-sues, this event gives the valuable experience of working in such configurations, particularly when the key spacecraft are located outside the plasma sheet. Last but not least, the stud-ied event displayed an interesting (previously not reported) feature, a strong overloading of the tail, which we have the advantage to study and discuss.
2 Observations
2.1 Survey of observations
The event on 8 September 2002 can well be one of the best textbook examples of a substorm due to its distinct character and unprecendent/excellent coverage by observations in all basic regions; see a summary in Fig. 1. First of all, it was an isolated substorm preceded by >13 h of magnetic calm during a long period of northward-oriented IMF. As usual, the event was initiated by a IMF southward turning, arriv-ing at the magnetopause around 20:00 UT, Fig. 1a and, sub-sequently, the irregular northward turning observed around 21:20 UT could play a role in triggering the substorm expan-sion, which also frequently occurs (e.g. Lyons et al., 2003). The IMF variations shown by two solar wind monitors, ACE and Wind, are not quite similar, suggesting inhomogeneous solar wind structure; unreliable timing precludes any seri-ous observation-based discussion of the triggering process in our case. The growth phase (starting after 20:15 UT, accord-ing to PC index and other ground and tail data) displayed a steady growth of the tail current and stretching of the tail configuration until 21:10–21:20 UT (Figs. 1c, d, discussed in more detail in the Sect. 3). During that time period, the enhanced convection is manifested as the growth of PC in-dex (an indicator of polar cap convection, Fig. 1b), of the westward electrojet (see SOD records in Fig. 1e) and of the AE index (not shown here). The enhanced convection was
Geotail Polar 2114 2116 2118 2120 U T
Fig. 3. Time variation of auroral brightness integrated in 2-h wide MLT strips from WIC and S12 cameras of IMAGE spacecraft (a) and the examples of WIC images around the onset (b). The footpoints of Geotail and Polar mapped into the ionosphere are also shown. Vertical lines here and on the following figures indicate the times of the pseudo-breakup (green) and of the substorm onset (major breakup, red line).
also directly measured at two geostationary LANL space-craft (see Sect. 2.3 below). The oval expansion with the grad-ual increase of precipitation was probed by the FUV auroral monitor at Image spacecraft (Sect. 2.2). The substorm (ex-pansion phase) onset was consistently determined by auro-ral and ground magnetic observations (Sect. 2.2) to occur at
∼21:18 UT in the local time sector 22:00–24:00 MLT. The mid-latitude activity according to magnetic ASY and SYM indices can be characterized as enhanced convection (ASY indices) in the growth phase without a clear depression of the SYM (proxy of Dst) index, probably masked by the
en-hanced solar wind dynamic pressure (peaked at ∼21:00 UT, not shown here). The SYM-index dropped from ∼–30 to –50 nT during the substorm expansion phase. The maxi-mal electrojet intensity during the substorm was moderate, maximal disturbance amplitude at midnight (see SOD mag-netogram) was about 300 nT and the peak AE index value was ∼400 nT.
Figure 2 shows a unique constellation of basic space-craft in this study. At 21:00 UT there were two geosyn-chronous LANL spacecraft (02 A and 01 A) at 02:00 and 22:00 MLT, correspondingly, to probe the inner magneto-sphere around midnight. Another two spacecraft, Polar at [–8.8, –1.9, 1.8] RE and Geotail at [–8.8, 1.0, –1.3] (GSM
coordinates are used everywhere), were in an ideal position (at the same radial distance, ∼9 RE and being separated by <3 REboth in Y and Z coordinate) to probe the current sheet
on both sides, from the neutral sheet and from midnight. Four Cluster spacecraft separated by ∼2000 km from the tetrahe-dron barycenter (at [–16.1, 0.4, 4.5] RE) probed the northern
boundary portion of the plasma/current sheets at midnight. Such configuration resembles the proposed THEMIS config-uration by the cluster of 2 spacecraft at ∼9 RE (instead of
3 SC clustering at ∼11 RE) and by the Cluster spacecraft
at the intermediate distance (16 RE) between the inner
mag-netosphere and the expected average magnetic reconnection region (at 20–25 Re). With the Image magnetometer network
(midnight at around 21:30 UT) probing the ionospheric cur-rents near the spacecraft footpoints and global auroral images from IMAGE spacecraft, to our knowledge, this is the most closest analogy of the configuration expected to be realized in the THEMIS project.
2.2 Auroral and magnetic observations of the substorm on-set and preceding pseudo-breakup
The FUV observations from the Image spacecraft allow one to monitor the global distribution of total precipitation (WIC camera) and of the proton precipitation (S12 instrument) on the nightside at ∼2-min time resolution (e.g. Mende et al., 2003). The time variations of the auroral brightness inte-grated in 2-h wide MLT strips (Fig. 3a) indicate a smooth growth of the overall precipitation during the growth phase, with a clear brightness increase in the 22:00–24:00 MLT sec-tor at ∼21:18 UT, which then expanded to the post-midnight sector after 21:22 UT. The sequence of images shows this brightening which occurs close to the expected footpoints of major spacecraft.
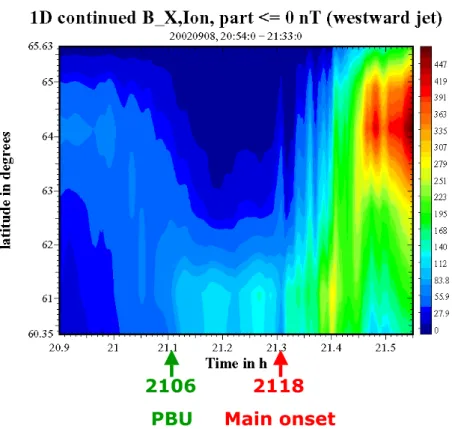
This onset timing is supported by the magnetometer data. The latitudinal distribution of westward currents in Fig. 4
2106
2118
PBU
Main onset
Fig. 4. Latitudinal distribution of the westward currents near midnight reconstructed from data of the IMAGE magnetometer network using the 1-D upward continuation method (Vanhamaki et al., 2003).
shows the results of the 1-D upward continuation of the ground magnetic perturbations (Mersmann et al., 1979; Van-hamaki et al., 2003), which allows one to reconstruct at each time step the density distribution of the east-west equivalent ionospheric currents crossing the meridian of the IMAGE magnetometer network (midnight at ∼21:30 UT). A sharp change in (previously smooth) pattern is evident at 21:18 UT, first, as a structuring of the current density at Pi2 frequency and, then, as the intensity increase and poleward expansion of the westward current (around 21:24 UT). The Pi2 pulsations after 21:18 UT were also observed at the SAMNET magne-tometer network (not shown) and even at mid-latitudes (at Crete station, courtesy by T. B¨osinger). A notable feature is an unusually low latitude (∼61◦CGLat) of the breakup re-gion, corresponding to the very expanded oval at that time.
Another notable feature is a fast equatorward shift after 21:00 UT followed by a weak intensity increase of the west-ward current at 21:06 UT (to less than 100 nT). The latter feature is later referred to as the pseudo-breakup and may be associated with the plasma injection to the geosynchronous orbit described in the next section. No distinct auroral bright-ening could be identified at that time in the FUV imager data. 2.3 Observations at the geosynchronous orbit
The geosynchronous plasma environment was monitored with two basic plasma instruments, MPA (covering elec-trons and protons below 45 keV) and SOPA (for energetic population above 50 keV). The most interesting information
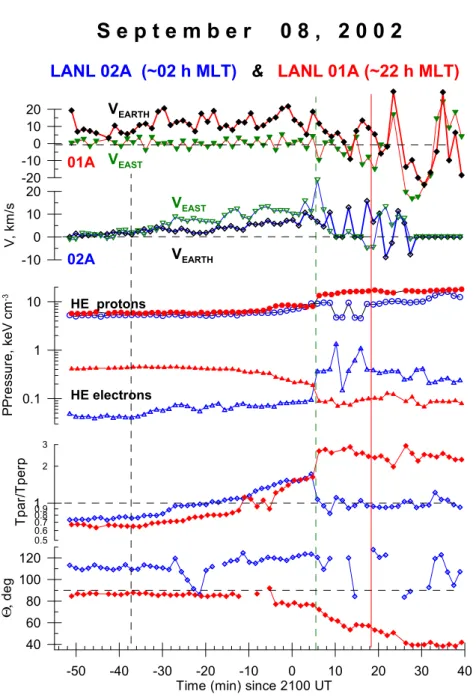
which came from MPA on two near-midnight spacecraft is displayed in Fig. 5. Very clear growth phase signatures were recorded between 20:20 and 21:06 UT. First, the steady en-hanced convection, established with mostly earthward (ra-dial) convection at premidnight SC 01 A and sunward (east-ward and earth(east-ward components) convection at the post-midnight spacecraft, has associated smooth increases of to-tal plasma pressure at both spacecraft. A gradual change in electron anisotropy (from pancake-to cigar-shaped distribu-tion) was also observed, as shown by increased Tk/T⊥. This is also a well-known manifestation of the growth phase inter-preted as a consequence of enhanced drift-shell splitting due to the increased magnetic field stretching in the tail (Baker et al., 1978). A proxy of the magnetic field orientation is given on the bottom plot, which indicates a slight stretching of the magnetic field at the spacecraft #02A (blue trace) dur-ing the growth phase.
This pattern was considerably perturbed at ∼21:06 UT. The pressure of energetic protons (electrons) was sharply enhanced at spacecraft 01 A (02 A) without a similar en-hancement of the other component, indicating that pro-tons observed at ∼22:00 LT and the electrons observed at
∼02:00 LT were probably injected near midnight, in between these two LT meridians. (A possibility still may be reserved that observed features could be the encounter of the sharp in-ner boundary of the proton (at 22:00 MLT) and electron (at 02:00 MLT) plasma sheet, although such coincidence looks improbable, unless these boundaries are suddenly shifted
-50 -40 -30 -20 -10 0 10 20 30 40 Time (min) since 2100 UT
40 60 80 100 120 Θ, deg 1 2 3 0.9 0.8 0.7 0.6 0.5 T par /T per p 0.1 1 10 PPr e ss u re , k e V c m -3 -10 0 10 20 V, k m /s -20 -10 0 10 20
S e p t e m b e r 0 8 , 2 0 0 2
LANL 02A (~02 h MLT)
&
LANL 01A (~22 h MLT)
VEARTH VEAST HE protons HE electrons 01A 02A VEAST VEARTH
Fig. 5. MPA observations at two geosynchronous LANL spacecraft including (from top to the bottom): proton flow components, electron and proton pressure of energetic plasma component (0.3–32 keV), the ratio Tk/T⊥for the energetic electron component, and the polar angle
of the energetic electron anisotropy axis (90◦corresponds to the dipole field direction).
earthward, which again points to the necessity of an inward plasma injection in a wide MLT sector around midnight.) The previously existing, steady convection pattern was dis-rupted at that time. The electron anisotropy also changed sharply, but in the opposite direction at the two spacecraft: it returned to the isotropic distribution post-midnight, whereas it sharply increased pre-midnight, indicating a stretching of the enhanced magnetic field at ∼22:00 LT (consistent with a strong deviation of the anisotropy axis from the dipole field direction as shown at the bottom plot). Surprisingly, no com-parable effects were seen in this energy range at these loca-tions 12 min later, at the substorm onset.
In sharp contrast to these observations, the substorm has very tiny effects in the more energetic geosynchronous pop-ulation (>50 keV) covered by the SOPA instrument, which is traditionally used to monitor the substorm-related injec-tions. The only injection feature recorded at the onset was the drifting electron hole (DEH) observed at the post-midnight spacecraft 02A (Fig. 6), whose injection time (from tracing back energy dispersed arrival time) was estimated to be at 21:20:00 (±20 s) UT. It was followed by a small flux increase only in the lowest energy (50 keV) channel.
100 1000 10000 100000 D iff. el ec tr o n fl u x Ee , keV DEH 50-75 75-105 105-150 150-225 225-315 20:50 21:00 21:10 21:20 21:30 UT
Fig. 6. Differential fluxes of energetic electrons recorded at the LANL 02A spacecraft (∼02:00 LT). The only feature around substorm onset at GEO orbit was the drifting electron hole corresponding to the injection of depressed particle flux at around 21:20 UT.
PBU
Onset
Fig. 7. Variations observed by Polar and Geotail in the transition region around pseudo-breakup and substorm onset. From top to the bottom: The spectrograms of energetic electrons and ions at Polar (HYDRA instrument); high time resolution (12 s at Geotail, 6 s at Polar) variations of the magnetic field (Bzgseand total B) and the plasma-spacecraft potential (SP).
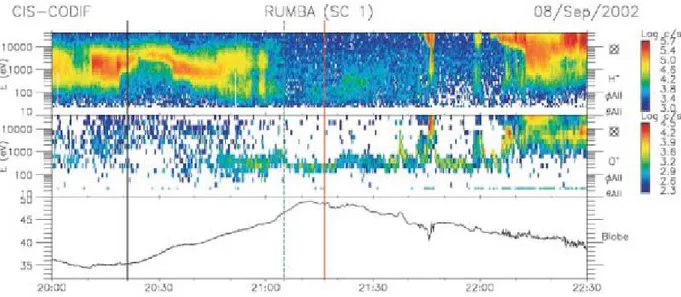
Fig. 8. Survey of selected Cluster observations: E-t spectrograms for hydrogen and oxygen ions from CODIF and equivalent
Blobe=(2µ0[(nkT )O++(nkT )H+]+B2)1/2obtained from the vertical pressure balance.
2.4 Observations in the transition region at ∼9 RE
To characterize the current sheet evolution, we plotted in the Fig. 1d the difference between the BX-components of
the external magnetic field (the Earth dipole field subtracted from the total observed field) at Polar and Geotail spacecraft. Near midnight the difference characterizes the amount of the current in the horizontal slab (per unit length) between the two spacecraft, whose distance in Z was about 3 RE and
which were on the opposite (N and S) sides from the neu-tral sheet. During the growth phase this quantity, 1BX EXT,
changed from 30 to about 120 nT, indicating a strong growth of the current density in the transition region. Also, BZ
de-creased below the average level down to ∼10 nT. Soon after the substorm onset the BZ-components sharply increased and 1BX EXT decreased, indicating the disruption of this intense
current, the standard signature of the substorm onset in the near-Earth tail region (e.g. Lui et al., 1992).
To see in more detail the plasma and magnetic field dy-namics around the pseudo-breakup and onset times, we plot-ted in Fig. 7 the spectrogram from the Polar HYDRA in-strument, as well as the variations of the magnetic field and spacecraft potential at Polar and Geotail (the latter parameter decreases with the increasing electron flux and serves to char-acterize the plasma population; e.g. Laakso, 2002). During that time both Polar (closer to the neutral sheet) and Geotail (near the plasma sheet boundary, consistent with their coor-dinates in Fig. 2 and the latter at a lower value of the space-craft potential) stayed within the plasma sheet. Geotail exited shortly from the plasma sheet between 20:53 and 21:02 UT as a result of a transient northward tilt of the current sheet (consistent with the modeling results of Sect. 3.1 and Fig. 11, top). No significant particle acceleration or magnetic field dipolarization was seen around the pseudo-breakup at either Polar or Geotail, except for the effects of fast plasma sheet thinning observed by Polar after 21:07 UT.
Around the substorm onset the earliest indication of ac-tivation was the sudden plasma sheet expansion at Polar at 21:17:40 UT, which was followed at both spacecraft a few minutes later by the BZ increase. The earliest changes in
plasma parameters at Geotail (according to the spectrogram from the LEP instrument, not shown here) started not ear-lier than at 21:19:40, with strong energization evident at 21:22 UT. When interpreting the observations one should take into account localization and dynamics of activity with respect to the spacecraft location. Particularly, the Polar foot-point initially was outside (eastward, within 1h LT – see Fig. 3) of the bright auroras at the onset, and considerable plasma acceleration at Polar was not observed until 21:26 UT when the spacecraft footpoint was occupied by the bright au-roras in the course of their eastward expansion.
2.5 Cluster observations at ∼16 RE
According to the CODIF spectrogram in Fig. 8, the Clus-ter spacecraft were in a cold (Ti∼1−2 keV) plasma sheet
at the beginning of the event. They exited from the plasma sheet at around 21:00 UT and returned back to the (considerably heated) plasma sheet after a series of transient encounters with hot boundary layer plasma be-tween 21:37 and 22:10 UT. Outside the thinned proton plasma sheet, between 21:00 and 21:37 UT, they encoun-tered continuously a considerable amount of cold (hundreds eV) oxygen ions (Fig. 8), flowing tailward with speeds of
Vx∼−40. . .−60 km/s (Fig. 9). This cold oxygen
(iono-spheric outflow) beam is an excellent tool for diagnosing the relatively weak (tens km/s) cross-B motions of the lobe plasma tubes, as has recently been shown by Sauvaud et al. (2004). The traces of VZ flows at two spacecraft (C1 and
C4) in Fig. 9 varied similarly, suggesting a relatively large scale of these perturbations. This gives us an opportunity to
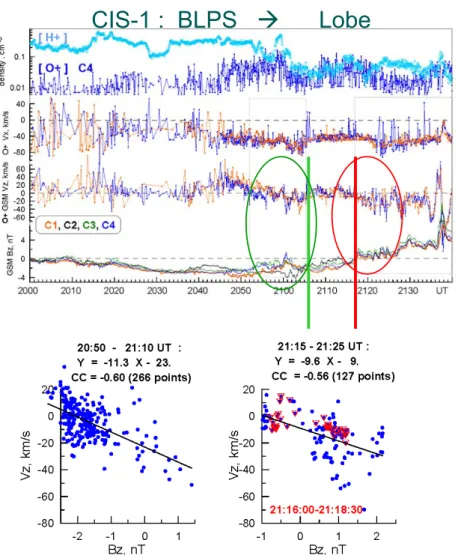
CIS-1 : BLPS Æ
Lobe
Fig. 9. Top: H+and O+plasma densities, O+perpendicular flows at C1 and C4 spacecraft and BZ-variations at four Cluster spacecraft.
Bottom: VZ−BZcorrelation plots for time periods, including the pseudo-breakup and the substorm onset.
look at the flux tube perpendicular motions (together with magnetic variations recorded) to learn about the associated plasma sheet dynamics, while the spacecraft are staying out-side of the plasma sheet.
Near the substorm onset (since 21:17 UT and throughout the substorm expansion while Cluster was in the lobe plasma) one sees a series of negative VZvariations
accompa-nied by positive BZ variations, suggesting some association
between plasma tube convection toward the neutral sheet and magnetic dipolarization events. A similar sequence is noticed between 20:52 and 21:05 UT, i.e. prior to the pseudo-breakup. A correlation analysis (Fig. 9, bottom) shows in both cases the anticorrelation between δVZ and δBZ(CC ∼−0.6 even without removing the slow
substorm-related BZ trends) which, in case of Alfv´en waves, implies
their earthward propagation. Moreover, the regression slope is nearly the same in both intervals (∼10 km/s/nT) which can be scaled to evaluate the earthward propagation speed as VX=(δVZ/δBZ)BL ∼500 km/s for an Alfv´en wave and
using the lobe field BL=50 nT.
Let us look now in more detail into the variations in dif-ferent components around substorm onset, which are shown in Fig. 10. First, the component variations are similar at all spacecraft, indicating a relatively large scale of the struc-tures (exceeding 3000 km spacecraft separation scale). Sec-ond, a small time shift exists from C4 to C1 for the first pulse shown in Fig. 10 (about a 6–8-s time delay when us-ing cross-correlation), supportus-ing earthward propagation at speeds of 500–700 km/s. There is a systematic phase shift between different components: the VZ and BZ variations
anticorrelate each other with little phase shift evident, but the beginning of a positive δBZ (negative δVZ) pulse
cor-responds to the maximum of BX-variation. Such
quarter-period phase shift between the components allows one to in-terpret them as localized earthward-contracting reconnected flux tubes (NFTEs) or the flux ropes, which will be discussed below. The more accurate determination of the horizontal velocity of the leading structure (centered at 21:17:22), us-ing all components at all four Cluster spacecraft (obtained by the algorithm used in Slavin et al. (2003b) to trace the flux ropes), gives VX=627 km/s and VY=–72 km/s.
Nightside FTE structure (Sergeev et al.,PSS, 1992, p.1551)
PS expansion
SC
Fig. 10. Time variations in the plasma sheet around the substorm onset (from top to the bottom): BZ components at Polar and Geotail
(with onset of rapid PS expansion shown by arrow), BXand BZ components at four Cluster spacecraft; vertical flows at C4 spacecraft. The scheme on the bottom panel displays the pattern of the nightside flux transfer event (NFTE) in the plasma sheet, from (Sergeev et al., 1992a) (including the magnetic field lines, plasma pressure showed by hatching and velocities of the flux tubes shown by the arrows) with the spacecraft trajectory overlapped to facilitate the interpretation of observed variations.
3 Analysis of observations and discussion
3.1 NFTEs : What can be observed by the spacecraft being outside the plasma sheet?
The typical situation for the spacecraft in the magnetotail at substorm onset (or near the reconnection region at any con-ditions) is that, due to severe thinning of the current sheet, the spacecraft finds itself outside the plasma sheet and can no longer diagnose directly the main product of the magnetic reconnection – the contracting reconnected plasma tubes car-rying the fast-flowing and heated plasma. However the con-sequences of that process, specific perturbations with smaller amplitude, can be observed in the lobes. The most well-known examples are the plasmoids or the flux ropes (see, e.g. Slavin et al., 2003a, for a description and references) which generate the well-known travelling compression re-gions (TCR) in the lobes. Other examples are the local-ized reconnected plasma tubes (or Nightside Flux Transfer Events, NFTEs, see Sergeev et al., 1992a, for the descrip-tion of previous work and Fig. 10). Both objects have the
propagating mesoscale (a few RE) bulge-like perturbations
of the plasma sheet, which create the BX-compression and
bipolar perturbation in the normal (BZ) component in the
lobes near the plasma sheet. The major difference between the two objects is topological; the plasmoid/flux rope looks like a loop when viewing along the core axis (from the dusk flank), and it produces symmetric bipolar N/S variations in
BZ. On the contrary, the NFTE has a unipolar closure (net
re-connected flux) across the sheet and provides asymmetric BZ
variation with a main (positive if observed earthward from the reconnection site) pulse preceded by a smaller negative pulse. (The latter pulse is created due to the specific wave perturbation launched by transient (pulse-like) reconnection, as shown in the theoretical models of transient reconnection (see Semenov et al., 2004, for reference to theoretical mod-els and Sergeev et al. (1987), for comparison between model predictions and observations) . Empirical reconstruction of perturbations during transient plasma sheet expansions ob-served by ISEE-1 and 2 spacecraft separated in the Z direc-tion gave the NFTE pattern (Sergeev et al., 1992a) shown at the bottom of Fig. 10. Such a pattern explains the phase shifts
between δBX and δBZ, the asymmetric (almost unipolar)
character of BZ variation, and anticorrelation between δVZ
and δBZin agreement with the observations. A good
quanti-tative agreement between predicted and observed variations has been recently demonstrated for our event by T. Penz and colleagues (T. Penz et al., 20051).
Based on these results we interpret the positive δBZ
(ac-companied by negative δVZ) pulses as the propagated
prod-ucts of pulsed magnetic reconnection. If so, it implies that a series of ∼1-min-long reconnection pulses (or a few X-O-pairs transported earthward, if one prefers the flux rope interpretation) was generated at substorm onset, at a distance
r>16 RE, tailward of the Cluster location. The earliest
in-dication of onset time at the Cluster location could then be defined at 21:16:40 UT (Fig. 10) when BX and VZ start to
increase before the main negative VZpulse (and positive BZ
pulse) was observed.
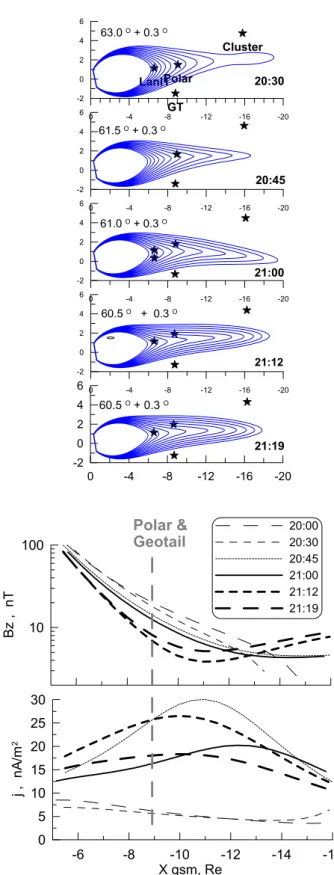
3.2 Tail current sheet dynamics on the large scale
The adaptive modeling approach (e.g. Kubyshkina et al., 1999) allows one to apply the model functions used in stan-dard magnetospheric models (here from the T89 model; Tsy-ganenko, 1989) to tune the free model parameters and obtain a best fit to the observations at the given time. The observed magnetic field components at all spacecraft and a proxy of the B-field direction at geostationary spacecraft were used here as the input. The spacecraft configuration on 8 Septem-ber 2002 is a kind of optimal distribution: the Cluster mag-netic measurements outside the plasma sheet allow one to fix the total current, the data from the Polar/Geotail spacecraft pair allow one to control the actual tilt of the current sheet and probe its thickness, and the LANL observations help to fix the inner magnetospheric magnetic field. No data exist at r>17 REwhich prevents us from discussing seriously the
configuration at far distances where the magnetic reconnec-tion could take place. The version of the adaptive model and the free model parameters used are similar to those described by Kubyshkina et al. (1999). We varied the tail current in-tensity, to thin CS locally and to tilt the current sheet. The sequence of the resulting generated models is displayed in Fig. 11.
The modeling confirms large changes in the magnetotail during the growth phase. The equatorial cross-tail current density started from standard values j ∼5 nA/m2(20:00 and 20:20 UT) and increased most of all (by a factor of 5, reach-ing 25–30 nA/m2 before the onset) in the transition region probed by the Polar and Geotail spacecraft. The BZ
compo-nent in the current sheet center decreased, with an indication of local BZminimum ∼5 nT, formed at 10–12 RE, where the
current density reached its highest value. This was probably the region where the tail current density (in absolute values) was maximum in the tail.
1Penz, T., Semenov, V. S., Ivanova, V. V., et al.: Reconstruction of the reconnection rate from Cluster measurements: First results, J. Geophys. Res., accepted, 2005.
0 -4 -8 -12 -16 -20 -2 0 2 4 6 Cluster GT Polar Lanl1 0 -4 -8 -12 -16 -20 -2 0 2 4 6 0 -4 -8 -12 -16 -20 -2 0 2 4 6 61.0 O + 0.3 O 0 -4 -8 -12 -16 -20 -2 0 2 4 6 60.5 O + 0.3 O 0 -4 -8 -12 -16 -20 -2 0 2 4 6 60.5 O + 0.3 O 20:30 20:45 21:00 21:19 61.5 O + 0.3 O 63.0 O + 0.3 O 21:12 10 100 Bz , nT 20:00 20:30 20:45 21:00 21:12 21:19 -6 -8 -10 -12 -14 -16 X gsm, Re 0 5 10 15 20 25 30 j , n A /m 2 Polar & Geotail
Fig. 11. Top: magnetic field line configurations (midnight XZ cross sections) during the substorm growth phase obtained from the adap-tive modeling; CGLat of the innermost field line and latitudinal step between field lines are shown for each configuration. Bottom: time evolution of the radial current density profiles and BZ profiles in
The modeling/mapping results have a few other implica-tions when interpreting the observation:
(1) The modeling reveals the up-down tilts of the current sheet, partly related to the changes in the solar wind ver-tical flow component (this effect is difficult to explore in our case due to the timing problems in the ACE-Wind comparisons mentioned above and the differences, in the recorded signals at two spacecraft). This explains the temporary exit from the plasma sheet of the Geotail spacecraft between 20:53 and 21:02 UT.
(2) The stretching associated with the growth of the tail cur-rent was so strong that at 21:12 UT the point at 6.6 RE
distance in the neutral sheet maps to ∼61◦CGLat. This helps to link the observation of distinct soft plasma injection at LANL spacecraft at 21:06 UT (Sect. 2.3) with a weak enhancement of westward electrojet at
∼61◦CGLat, considering them as a manifestation of the same process, described here as the pseudo-breakup. However, due to the small BZ(and small magnetic flux
closure) in the current sheet, the transition region also maps very near in latitude, for example, the Polar foot-point at 21:12 UT is only at 62.0◦and the neutral sheet point at 15 REmaps to 62.6◦CGLat.
(3) The magnetospheric location of the main breakup is dif-ficult to establish due to uncertainties in both the ob-served location of the breakup in the ionosphere and in the mapping (possible uncertainties are roughly esti-mated to be about 1◦CGLat in both cases). It is difficult to judge from these data for sure whether the breakup should be mapped to the GEO distance or to the mid-tail.
3.3 Substorm onset timing, interpretation of substorm on-set and of the pseudo-breakup
As noticed before, the earliest indication of substorm-onset-related variations was detected on Cluster at 21:16:40 UT. At ∼9 RE the corresponding earliest activity sign was the
start of sudden plasma sheet expansion at Polar, which was observed at 21:17:40 UT. A one minute time delay over
∼7 RE distance implies the earthward propagation speed of ∼700 km/s. This nicely agrees with the cross-correlation of magnetic variations at the Cluster spacecraft (giving
VX=627 km/s), as well as with the ∼500 km/s estimate of
the local Alfv´en speed evaluated from the δVZ/δBZ ratio
(Sect. 2.5). These results, obtained on different scales and/or by different methods, points to the earthward propagation of the disturbance from midtail to the near-Earth region at the substorm onset.
Concerning the near-Earth region, the only manifestation of the onset was the drifting electron hole (DEH, Fig. 6), which is known to be a negative of ordinary plasma jection (Sergeev et al., 1992b) and is explained by the in-ward injection of plasma tube in which the energetic par-ticle flux is depleted. (Depleted energetic parpar-ticle flux as
compared to the radiation belt population can be naturally explained by a very low temperature and soft electron spec-trum of the plasma sheet (see Sect. 3.5 and also Yahnin et al., 2001, for similar observations and interpretation). Since the “flux hole” is injected, the “flux hole” then propagates at the electron drift speed, similar to the ordinary injected plasma cloud. The time of its injection to the GEO orbit can be evaluated from this energy dispersed arrival shown in Fig. 6 to be at 21:20 UT. Compared to the earliest signature ob-served at ∼9 RE, this gives a time delay of 2.5 min over
2.5 RE, which represents a slower propagation speed in the
inner region of about 100 km/s. Such a propagation speed is, however, a typical propagation velocity of the dipolarization fronts at these distances, according to the statistical study by Ohtani (1998), who investigated their timing at two radially-separated spacecraft. Summarizing, if we believe in the in-terpretation of Cluster observations suggested in Sect. 3.1, the timing of plasma sheet phenomena at substorm onset is consistent with inward propagation from the midtail to the transition region and then to GEO orbit with realistic propa-gation speeds. The discussion in Sect. 3.1 also implies that this disturbance is produced by the impulsive reconnection, so it implies an association of substorm onset with the BBFs (as recently confirmed by Slavin et al., 2002) and points to the modified NENL model (Baker et al., 1996) to organize the observations.
The situation looks different concerning the “pseudo-breakup” at 21:06 UT. Unfortunately, the observations are less detailed and do not allow one to draw a complete picture for this episode. No considerable auroral brightening was observed by the FUV instruments at the Image spacecraft, and only very weak westward current intensification was in-ferred from the IMAGE magnetometer data (Fig. 4), which precludes the more detailed analysis of ground effects. The most distinct is the observation of enhanced fluxes of soft (keV–20 keV) plasma simultaneously at two locations (22:00 and 02:00 LT) at GEO orbit, with enhanced ions (electrons) observed exclusively at 22:00 (02:00) LT. This asymmetry implies a plasma injection somewhere in between these two meridians, somewhere around midnight. However, no signif-icant effects were observed at ∼9 REnear midnight at either
Polar or Geotail, suggesting that the most intense portion of the current sheet (in the transition region near midnight) was not disrupted and did not play an active role in generating this injection. Therefore, we cannot rule out the excitation of some instability (like ballooning) in the inner magnetosphere (e.g. Roux et al., 1991), but it then should be very localized in that region and have no global effects, i.e. should be de-coupled from the main portion of the intense current sheet. Alternatively, one still can imagine the earthward intrusion of the reconnected plasma tube from midtail, similar to that ob-served at the substorm onset, but more localized in Y , so that it could be missed by Polar and Geotail. Supporting evidence for such a version can be the observation of series of anticor-related δVZ/δBZvariations between 20:53 and 21:05 UT,
re-sembling those during substorm onset, but showing different
Fig. 9, which suggests their small scale in Y . Summarizing, we do not think either of these two options for the pseudo-breakup mechanism has enough evidence in our observation to be preferred. More studies with similar configurations are thus necessary.
Based on the timing result one may argue (Sect. 3.3) that although the current sheet reached its most stressed state near the transition region (at 10–12 RE, Sect. 3.2), it was not
ini-tially disrupted at that particular place at the substorm onset. The time delay analysis rather shows that the disruption of the most intense near-Earth portion of the intensified current sheet followed after some disturbance (earthward contracting reconnection tube, a kind of BBF) propagated from the mid-tail into/through that region. Although we could not probe directly the midtail at r>16 RE, from previous experience
we believe that a thin current sheet developed there also, so the thinned intensified current sheet is sufficiently long in X (say, from 10 to 30 RE; see, e.g. Pulkkinen et al., 2000) and
mainly its tailward portion is activated. Such asymmetry is consistent with statistical results by Asano et al. (2004), who showed that the initial current sheet thickness at substorm onset is smaller for cases starting from earthward flow bursts than in cases starting with tailward flow bursts, which implies that magnetic reconnection activated asymmetrically, prefer-ring the tailward portion of the intense current sheet. Such asymmetry, for example, was suggested theoretically by Sit-nov et al. (2002), who considered the influence of transient electron population on the excitation of tearing instability. 3.4 Lessons for substorm onset studies in radial
configura-tions
Our examination of one substorm event with favourable dis-tribution of several spacecraft and global control of activ-ity (also complemented with the magnetospheric modeling) shows that removing one of the elements (some spacecraft, or ground/auroral control) can modify (even alternate, see e.g. discussion of the pseudo-breakup observations in previ-ous section) the interpretation. This is why in this paper we prefer to abstain from discussing the substorm onset mecha-nism based on extensive literature of previous case and statis-tical studies, thereby waiting for the forthcoming projects in which all necessary elements will be in place (e.g. THEMIS). Our experience with such rare configuration may, however, suggest some constraints for such types of studies. One im-portant constraint is the necessity of detailed control of the source azimuthal location. An example is the difference between Polar and Geotail observations (separated by only 3 RE in Y and less than ∼1 h MLT in longitude) at the
on-set, where the plasma energization started a few minutes later at Polar (after 21:26 UT) following the eastward expansion of bright auroras. The good coverage of ionospheric observa-tions expected in the THEMIS project is a type of optimal re-quirement. Another point of interest is that the Z-separation between the spacecraft probing the transition region should not be too large (3 REappeared to be close to the thickness of
entire current/plasma sheet at 9 RE in out case) to have the
opportunity to probe the current density in the central and outer portions of the plasma sheet; here the value of about 1 RE could be evaluated as the preferable separation.
As argued in Sect. 3.1, in the vicinity of reconnection site the spacecraft are most often outside of the thin current sheet. Here we argued that the measurements of lobe plasma con-vection and magnetic variations can still be a valuable tool to diagnose the reconnection pulses. To prove this remote sensing technique will also be an important challenge for the THEMIS project. A caution is necessary, however, because of large contribution of oxygen ions in that plasma (Fig. 8) if the instruments without mass-discrimination are used. 3.5 Overloading of the tail, importance of plasma sheet
state
A basic feature of the substorm growth phase, the loading of the magnetic flux and magnetic energy into the mag-netotail, is very distinctly observed in our event. More-over, the amount of lobe magnetic field increase is unusually large. To see this in quantitative terms we can use the em-pirical model of the lobe field at substorm (unloading) on-set, which Shukhtina et al. (2004) obtained based on Geo-tail measurements in ∼150 substorms with a well-defined unloading phase as a function of spacecraft distance, solar wind pressure and the IMF parameters. For the Cluster dis-tance and given solar wind conditions it predicts a lobe field value at substorm onset of 38 nT (contrasted with 49 nT in our case, Fig. 8), whereas for the quiet state the correspond-ing relationship predicts 31 nT (which is comparable to 34 nT at 20:10 UT). The actual net lobe field increase 15 nT appears to be a factor of 2 larger than predicted, so the energy stor-age is a factor of 3–4 higher than in the averstor-age substorm! The extraordinary large increase in the tail current results in the unusually large equatorward expansion of the auroral oval and unusually low latitude of the substorm onset, at 61– 62◦C GLat instead of usual 65–67◦(e.g. Mende et al., 2003). Although the ground-based observations of the strong growth phase features followed by the insignificant expansion phase have been previously reported (e.g. Pellinen et al., 1982), the phenomenon of tail overloading by the stored magnetic en-ergy, to our knowledge, was not yet been reported before.
In the standard paradigm the stored energy is explosively dissipated during the substorm expansive phase, so one ex-pects to obtain a strong energy dissipation in the case of large energy storage. This is not the case in our event. The auroral currents were quite modest (peaked at ∼400 nT in AE index and about 400 kA in the westward electrojet at the midnight). Total precipitated energy deposited in the auroral oval on the nightside between 20:00 and 04:00 MLT evaluated from FUV Image observations reached the peak value of ∼34 GW at 21:50 UT, so a net increase in the precipitation rate during the expansion phase (starting from at ∼21:16 UT) was only 13 GW. This is comparable to the increase in the total auro-ral energy deposited on the nightside of ∼12 GW, obtained in a statistical study of 390 auroral substorms by Newell et al. (2001); see their Fig. 14. Moreover, the standard substorm
signature, the injections of energetic (>50 keV) electrons into the inner magnetosphere (Baker et al., 1978), was prac-tically not observed at all (the injection was soft and did not extend into this energy range).
We suggest these two features, an extraordinary large energy storage and a modest dissipation rate, may be un-derstood together by taking into account that before (and in the course of) the substorm we had a cool and dense plasma sheet (CDPS). Such conditions typically appear af-ter many hours of long periods of northward IMF and low magnetic activity (e.g. Terasawa et al., 1997; Thomsen et al., 2003), as we had in our case as well as in many cases of well-isolated substorms. In our case the GEO spacecraft and Polar observed n∼1 cm−3at the beginning of substorm growth, which changed to ∼3 cm−3 at GEO orbit during soft plasma injection at 21:06 UT; at that time the tem-perature was Ti∼7 keV at 01 A spacecraft. Dense, cool
plasma (n∼0.6 cm−3 and T
i∼1 keV) were also observed in
the boundary plasma sheet by Cluster prior to its excursion to the lobe.
The influence of plasma sheet parameters on the substorm manifestations was not seriously discussed previously, al-though it can be very important. It can be realized in a num-ber of ways:
(1) The amount (density) and energy of current carriers influence how much they should be accelerated (by a field-aligned electric potential drop (18k) near the
ionosphere) to support the field-aligned currents gener-ated during reconnection and current disruption. In case of n∼1 cm−3, the Knight conductance Q(jk≈Q 18k; Q∼ne/Te1/2)is large and less field-aligned acceleration
(18k) is required, in contrast to the standard case. This
relationship between the hardness of precipitation and the n/T ratio in the plasma sheet was directly confirmed recently by comparing the conjugate precipitation and plasma sheet characteristics (Sergeev et al., 2004). A consequence is that precipitated energy flux is low, and the Hall conductivity and currents increase weakly (in comparison to Pedersen currents, in the case of soft pre-cipitation), therefore only a weak magnetic disturbance can be observed on the ground. (See also Yahnin et al., 2001, for similar observations.)
(2) The soft energy spectrum (small temperature) has little particle flux in the high-energy tails of particle distri-butions, so no considerable energetic particle flux in-crease is observed in the CDPS case and the drifting electron holes (rather than ordinary drift-dispersed flux increases) are observed during the injection of plasma tubes into the inner magnetosphere. (See Yahnin et al., 2001, for other examples and discussion of previous studies.)
(3) Supposing that explosive growth of some local cur-rent instability is responsible for the substorm onset in the current sheet, one should remember that threshold conditions for the current sheet instabilities are always
given in normalized form, with current sheet thickness being normalized to either the ion gyroradius or to the inertial length. Both quantities can be much smaller (by a factor of 3 or more) in the CDPS case, as compared to the average plasma sheet. This means, in the CDPS case, that the current sheet should be thinned until it reaches a much smaller thickness, which takes a longer time. This may partly explain the much stronger loading and larger tail current reached in our case.
(4) The reconnection rate is proportional to the Alfv´en speed in the inflow region (i.e. ∼n−1/2) and is there-fore weak in the CDPS case. This means that after the reconnection was initiated, it proceeded with a smaller (than average) rate until reaching the open field lines (the CDPS after a long quiet period is often very thick, (see, e.g. Terasawa et al., 1997). This can also con-tribute to the weakness and gradual appearance of the substorm expansive phase in the CDPS case, as nicely demonstrated by Yahnin et al. (2001) for the 16 Novem-ber 1995 substorm. On the other hand, the slow dissi-pation/transfer rate will not compensate the energy/flux transfer into the tail which is dictated by the dayside merging; therefore, the transition from dominant stor-age to the dominant dissipation (a view of expansion phase onset) will be observed at a later time, helping to accumulate more magnetic flux and energy in the sys-tem. Another possible example for features (3) and (4) could be the well-known GEM substorm on 24 Novem-ber 1996 (e.g. Petrukovich et al., 1999).
(5) Last but not least, the CDPS case favors a deeper inward penetration (smaller size of Alfv´en forbidden region) and less shielding of the convection; therefore, the ra-dial distribution of plasma pressure and plasma current in the near-Earth tail may differ.
To conclude, we emphasize that, together with other fac-tors (IMF variations, etc.), the density/temperature of the plasma sheet may considerably influence the substorm man-ifestations and introduce a large variability in the behavior and appearance of the substorms. This could be an important issue to address in future (observation-based and simulation) studies.
4 Conclusions
Using fortunate radial configuration of ISTP, Cluster, and LANL spacecraft on 8 September 2002, supported by the monitoring of global auroral activity and ionospheric cur-rents, we analysed the development of an isolated substorm which demonstrated both the classic features (textbook ex-ample of growth/expansion/recovery phases with unprece-dented coverage of all basic regions) and some unusual prop-erties. The unusual aspect was that very strong tail current growth, magnetic energy loading and auroral oval expansion during the growth phase (the phenomenon of tail overload-ing) had an associated, unproportionally weak dissipation
rate (with the absence of energetic particle injections) dur-ing the followdur-ing expansion phase. We argue that the plasma sheet state (density/temperature) can influence the magneto-tail dynamics and its ionospheric manifestation in a num-ber of ways and that the cold/dense plasma sheet property in this event can be invoked to explain the weakness of dis-sipation signatures and the tail overloading observed. Con-centrating on the phenomena around the onset we found that basic signatures of substorm (expansion) onset in different phenomena/regions mutually agree and that, although the near-Earth current sheet was strongly thinned and intensified (j ∼30 nA/m2) before the onset, the sequence of events fa-vors the initiation of a substorm in the midtail region with the subsequent involvement of the near-Earth region. The indirect evidence (lobe signatures of earthward-propagating nightside flux transfer events) was the first to be observed, suggesting that the midtail magnetic reconnection could be the parent process.
On the other hand, 12 min prior to this distinct onset, a clear, soft plasma injection to the GEO orbit was recorded which had little associated effects both in the ionosphere and in the transition region at ∼9 RE. This pseudo-breakup was
probably due to either (very localized) a ballooning-type ac-tivity or due to the braking of very narrow BBF. There is still a large opportunity for various mechanisms or their combina-tions to be considered, so the problem still waits for system-atic studies of observations with THEMIS-like radial space-craft configurations.
Acknowledgements. We thank O. Troshichev for PC-index from
Vostok station; WDC-C Kyoto for SYM and ASY indices, SAM-NET team for the pulsation data and T. B¨osinger for Crete mag-netometer data, WIND and ACE teams for their data available via CDAWeb data base. J. Scudder and C. T. Russel are PIs of HYDRA and MFI instruments at Polar, and A. Balogh and H. R`eme are PIs of FGM and CIS instruments at Cluster. The work by V. A. Sergeev and M. V. Kubyshkina was partly supported by RFBR grants 04-05-64932 and 03-05-20012, as well as INTAS grant 03-51-3738. V. A. Sergeev thanks the Austrian Academy of Science and Finnish Meteorological Institute for support during his stays in Graz and Helsinki.
References
Asano, Y., Mukai, T., Hoshino, M., Saito, Y., Hayakawa, H., and Nagai, T.: Statistical study of thin current sheet evo-lution around substorm onset, J. Geophys. Res., 109, A5, doi:10.1029/2004JA010413, 2004.
Baker, D. N., Higbie, P. R., Hones, E. W., and Belian, R. D.: High-resolution energetic particle measurements at 6.6 RE, 3,
Low-energy electron anisotropies and short-term substorm pre-dictions, J. Geophys. Res., 83, 4863–4868, 1978.
Baker D. N., Pulkkinen, T. I., Angelopoulos, V., Baumjohann, W., and McPherron, R. L.: Neutral line model of substorms: Past results and present view, J. Geophys. Res., 101, 12 975–13 010, 1996.
Baker, D. N., Peterson, W. K., Eriksson, S., Li, X., Blake, J. B., et al.: Timing of magnetic reconnection initiation during a
global magnetospheric substorm onset, Geophys. Res. Lett., 29, doi:10.1029/2002GL015539, 2002.
Erickson, G. M., Maynard, N. C., Burke, W. J., Wilson, G. R., and Heinemann, M. A.: Electromagnetics of substorm onsets in the near-geosynchronous plasma sheet, J. Geophys. Res., 105, A11, 25265–25290, 2000.
Kennell, C. F.: The Kiruna conjecture: the strong version, in: Sub-storms 1, Eur. Space Agency Spec. Publ. SP-335, 599–602, 1992. Kubyshkina, M. V., Sergeev, V. A., and Pulkkinen, T. I.: Hybrid Input Algorithm: An event-oriented magnetospheric model, J. Geophys. Res., 104, A11 , 24 977–24 994, 1999.
Laakso, H.: Variation of the spacecraft potential in the magneto-sphere, J. Atm. Solar-Terr. Phys., 64, 1735–1744, 2002. Lui, A. T. Y., Lopez, R. E., Anderson, B. J., Takahashi, K., Zanetti,
L. J., McEntire, R. W., Potemra, T. A., Klumpar, D., Grene, E. M., and Strangeway, R.: Current disruptions in the near-Earth neutral sheet region, J. Geophys. Res., 97, 1461–1480, 1992. Lyons, L. R., Liu, S., Ruohoniemi, J. M., Solovyev, S. I.,
and Samson, J.C.: Observations of dayside convection reduc-tion leading to substorm onset, J. Geophys. Res., 108, A3, doi:10.1029/2002JA009670, 2003.
Mende, S. B., Frey, H. U., Morsony, B. J., and Immel, T. J.: Statis-tical behavior of proton and electron auroras during substorms, J. Geophys. Res., 108, A9, doi:10.1029/2002JA009751, 2003. Mersmann U., Baumjohann, W., Kuppers, F., and Lange, K.:
Anal-ysis of an eastward electrojet by means of upward continuation of ground-based magnetometer data, J. Geophys., 46, 281–298, 1979.
Nagai, T., Fujimoto, M., Saito, Y., Machida, S., Terasawa, T., Naka-mura, R., Yamamoto, T., Mukai, T., Nishida, A., and Kokubun, S.: Structure and dynamics of magnetic reconnection for sub-storm onsets with Geotail observations, J. Geophys. Res., 103, A3, 4419–4440, 1998.
Newell, P. T., Liou, K., Sotirelis, T., and Meng, C.-I.: Auro-ral precipitation power during substorms: A Polar-UV Imager-based superimposed epoch analysis, J. Geophys. Res., 106, A12, 28 885–28 896, 2001.
Ohtani, S.-I.: Earthward expansion of tail current disruption: Dual-satellite study, J. Geophys. Res., 103, A4, 6815–6825, 1998. Pellinen, R. J., Baumjohann, W., Heikkila, W. J., Sergeev, V. A.,
Yahnin, A. G., Marklund, G., and Melnikov, A. O.: Event study of presubstorm phases and their relation on the energy coupling between solar wind and magnetosphere, Planet. Space Sci., 30, 4, 371–388, 1982.
Petrukovich, A. A., Mukai, T., Kokubun, S., Romanov, S., Saito, Y., Yamamoto, T., and Zelenyi, L. M. : Substorm-associated pres-sure variations in the magnetotail plasma sheet and lobe, J. Geo-phys. Res., 104, A3, 4501–4514, 1999.
Pulkkinen, T. I., Kubyshkina, M. V., Baker, D. N., Cogger, L. L., Kokubun, S., Mukai, T., Singer, H. J., Slavin, J. A., and Zelenyi, L. M.: Magnetotail currents during the growth phase and lo-cal auroral breakup, in: Magnetospheric current systems, edited by: Ohtani, S. Ohtani,S.-I., Fujii, R., Hesse, M., and Lysak, R. L., Geophys. Monograph 118, AGU, 81–90, 2000.
Roux, A., Perraut, S., Robert, P., Morane, A., Pedersen, A., et al.: Plasma sheet instability related to the westward traveling surge, J. Geophys. Res., 96, A10, 17 697–17 714, 1991.
Sauvaud, J.-A., Louarn, P., Fruit, G., Stenuit, H., Vallat, C., Dan-douras, J., R`eme, H., et al.: Case studies of the dynamics of iono-spheric ions in the Earths magnetotail, J. Geophys. Res., 109, A1, doi:10.1029/2003JA009996, 2004.
I. V., Biernat, H. K., and Ivanova, V. V.: Reconstruction of the reconnection rate from magnetic field disturbances in an incom-pressible plasma, Recent Res. Devel. Plasmas, in press, 2004. Sergeev V. A., Semenov, V. S., and Sidneva, M. V.:
Impul-sive reconnection in the magnetotail during substorm expansion, Planet. Space Sci., 35, 9, 1199–1212, 1987.
Sergeev, V. A., Elphic, R. C., Mozer, F. S., Saint-Marc, A., and Sauvaud, J. A.: A two-satellite study of nightside flux transfer events in the plasma sheet, Planet. Space Sci., 40, 1551–1572, 1992a.
Sergeev, V. A., Bosinger, T., Belian, R. D., Reeves, G. D., and Cay-ton, T. E.: Drifting holes in the energetic electron flux at geosyn-chronous orbit following substorm onset, J. Geophys. Res., 97, 6541–6548, 1992b.
Sergeev, V. A., Dmitrieva, N. P., Timofeev, E. E., Liou, K., Miyashita, Y., Mukai, T., and Pulkkinen, T.: Strong control of auroral precipitation by plasma sheet parameters and the problem of pseudobreakups, Substorms-7, Proc. of the 7th of Intern. Conf. on Substorms, edited by: by Ganushkina, N. and Pulkkinen, T., Finnish Meteorol. Inst. reports, N 2004:5, 182–185, 2004. Shukhtina, M. A., Dmitrieva, N. P., and Sergeev, V. A.:
Quan-titative magnetotail characteristics of different magnetospheric states, Ann. Geophys., 22, 1019–1032, 2004,
SRef-ID: 1432-0576/ag/2004-22-1019.
Sitnov, M. I., Sharma, A. S., Guzdar, P. N., and Yoon, P. H.: Recon-nection onset in the tail of Earths magnetosphere, J. Geophys. Res., 107, A3, doi:10.1029/2001JA009148, 2002.
Slavin, J. A., Fairfield, D. H., Lepping, R. P., Hesse, M., Ieda, A., Tanskanen, E., Ostgaard, N., Mukai, T., Nagai, T., Singer, H. J., and Sutcliffe, P. R.: Simultaneous observations of Earthward flow bursts and plasmoid ejection during magnetospheric sub-storms, J. Geophys. Res., 107, A7, doi:10.1029/2000JA003501, 2002.
Slavin, J. A., Lepping, R. P., Gjerloev, J., Fairfield, D. H., Hesse, M., Owen, C. J., Moldwin, M. B., Nagai, T., Ieda, A., and Mukai, T.: Geotail observations of magnetic flux ropes in the plasma sheet, J. Geophys. Res., 108, A1, doi:10.1029/2002JA009557, 2003a.
Slavin, J. A., Lepping, R. P., Gjerloev, J., Goldstein, M. L., Fair-field, D. H., Acu˜na, M. H., Balogh, A., Dunlop, M., Kivelson, M. G., Khurana, K., Fazakerley, A., Owen, C. J., R`eme, H., and Bosqued, J. M.: Cluster electric current density measurements within a magnetic flux rope in the plasma sheet, Geophys. Res. Lett., 30, N7, doi:10.1029/2002JA016411, 2003b.
Terasawa, T., Fujimoto, M., Mukai T., et al.: Solar wind con-trol of density and temperature in the near-Earth plasma sheet: WIND/Geotail collaboration, Geophys. Res. Lett., 24, 935–938, 1997.
Thomsen, M. F., Borovsky, J. E., Skoug, R. M., and Smith, C. W.: Delivery of cold, dense plasma sheet material into the near-Earth region, J. Geophys. Res., 108, A4, doi:10.1029/2002JA009544, 2003.
Tsyganenko, N. A.: A magnetospheric magnetic field model with a warped tail current sheet, Planet. Space Sci., 37, 5–20, 1989. Vanhamaki, H., Amm, O., and Viljanen, A.: 1-dimensional
up-ward continuation of the ground magnetic field disturbance us-ing spherical elementary current systems, Earth Planets Space, 55, 613–620, 2003.
Yahnin, A. G., Sergeev, V. A., Bosinger, T., Sergienko, T. I., Ko-rnilov, I. A., Borodkova, N. L., Thomsen, M. F., Belian, R. D., Sauvaud, J.-A., Lutsenko, V. N., and Skalsky, A. A.: Correlated Interball/ ground-gased observations of isolated substorm: The pseudo-breakup Phase, Ann. Geophys., 19, 687–698, 2001, SRef-ID: 1432-0576/ag/2001-19-687.