HAL Id: hal-00330071
https://hal.archives-ouvertes.fr/hal-00330071
Submitted on 23 Dec 2005
HAL is a multi-disciplinary open access
archive for the deposit and dissemination of
sci-entific research documents, whether they are
pub-lished or not. The documents may come from
teaching and research institutions in France or
abroad, or from public or private research centers.
L’archive ouverte pluridisciplinaire HAL, est
destinée au dépôt et à la diffusion de documents
scientifiques de niveau recherche, publiés ou non,
émanant des établissements d’enseignement et de
recherche français ou étrangers, des laboratoires
publics ou privés.
plasmoid at substorm expansion phase onset and field
aligned currents in the plasma sheet boundary layer
N. C. Draper, M. Lester, S. W. H. Cowley, J.A. Wild, S. E. Milan, G. Provan,
A. Grocott, A. N. Fazakerley, A. Lahiff, J. A. Davies, et al.
To cite this version:
N. C. Draper, M. Lester, S. W. H. Cowley, J.A. Wild, S. E. Milan, et al.. Cluster magnetotail
observations of a tailward-travelling plasmoid at substorm expansion phase onset and field aligned
currents in the plasma sheet boundary layer. Annales Geophysicae, European Geosciences Union,
2005, 23 (12), pp.3667-3683. �hal-00330071�
SRef-ID: 1432-0576/ag/2005-23-3667 © European Geosciences Union 2005
Annales
Geophysicae
Cluster magnetotail observations of a tailward-travelling plasmoid
at substorm expansion phase onset and field aligned currents in the
plasma sheet boundary layer
N. C. Draper1, M. Lester1, S. W. H. Cowley1, J. A. Wild1, S. E. Milan1, G. Provan1, A. Grocott1, A. N. Fazakerley2, A. Lahiff2, J. A. Davies3, J.-M. Bosqued4, J. P. Dewhurst2, R. Nakamura5, C. J. Owen2, J. Watermann6,
M. G. Henderson7, H. J. Singer8, and E. Donovan9
1Radio and Space Plasma Physics Group, University of Leicester, University Road, Leicester, LE1 7RH, UK
2Mullard Space Science Laboratory, Holmbury St Mary, Dorking, Surrey RH5 6NT, UK
3Space Science and Technology Department, Rutherford Appleton Laboratory, Chilton, Didcot, Oxon OX11 0QX, UK
4CESR/CNRS, BP 4346 9, Avenue Colonel Roche, 31028 Toulouse CEDEX 4, France
5Space Research Institute, Austrian Academy of Sciences, 8042 Graz, Austria
6Danish Meteorological Institute, Copenhagen, Denmark
7Los Alamos National Laboratory, Los Alamos, NM 87545, USA
8Space Environment Center – National Oceanic and Atmospheric Administration, Boulder, CO 80305, USA
9University of Calgary, 2500 University Drive NW, Calgary, Alberta, T2N 1N4, Canada
Received: 4 May 2005 – Revised: 12 October 2005 – Accepted: 15 November 2005 – Published: 23 December 2005
Abstract. We present data from both ground- and space-based instruments for a substorm event which occurred on 5 October 2002, with an expansion phase onset time of 02:50 UT determined from the ground magnetometer data. During this substorm, the Cluster spacecraft were located
around 15 RE downtail, 8 RE from midnight in the
pre-midnight sector and just 2 RE above the equatorial plane (in
GSM coordinates). At expansion phase onset the Cluster spacecraft were located in the plasma sheet, tailward of a near-Earth neutral line and detected a significant time delay
of 6 min between the tail field Bzcomponent becoming
neg-ative and the subsequent detection of Earthward flows. This is explained by the formation of a tailward-directed travel-ling compression region initially Earthward of the spacecraft; 7 min later the Cluster spacecraft entered the plasma sheet boundary layer; they remained in and close to the plasma sheet boundary layer for around 15 min before exiting to the lobe. The spacecraft then re-entered the plasma sheet 30 min after onset. Earthward then tailward directed currents de-tected in the plasma sheet boundary layer after onset indi-cate that the Cluster spacecraft encountered the dawnward and duskward portions of the reconnection flow associated current system with Region 1 sense, respectively. The re-connection site and current system were initially skewed to-wards the pre-midnight sector, consistent with previous ob-servations that found the majority of substorm onsets located
Correspondence to: N. Draper
(email: [email protected])
in this sector. At later times the reconnection site and cur-rent system had moved towards dawn, to be located more centrally in the midnight sector.
Keywords. Magnetospheric physics
(Magnetosphere-ionosphere interactions; Magnetospheric configuration and dynamics; Magnetotail boundary layers)
1 Introduction
There are currently two main categories of substorm onset model which have been developed. The first of these is the near-Earth neutral line model (NENL; Baker et al., 1996, and references therein). A modified NENL model has also been proposed by Shiokawa et al. (1998). The cross-field current instability model (CCI) proposed by Lui (1996), and refer-ences therein, is the second main category of substorm onset model. Each encompasses three phases: the growth phase, the expansion phase, and the recovery phase. The NENL model suggests the spontaneous reconnection of antiparallel
magnetic field lines at around 20 to 30 RE from Earth in the
magnetotail (Nagai et al., 1998), as a result of the magnetotail loading that occurs due to dayside reconnection during the growth phase of the substorm. Closed magnetic field lines of the plasma sheet are reconnected first and then followed by the open field lines of the tail lobes. Newly-closed field lines are returned to the dayside, while tailward of the recon-nection site field lines remain connected to the interplanetary
Figures
Figure 1
30
Fig. 1. Northern Hemisphere polar cap within 60 deg at 03:00 UT on 5 October 2002 in geographic coordinates. Magnetic local times (MLT)
refer to 03:00 UT locations. Shown in blue are six of the nine SuperDARN radar fields of view from which data are used in this study. In green are the locations of the CANOPUS magnetometer stations, in red those of the Greenland magnetometer stations. The Cluster footprint is shown in orange.
magnetic field (IMF). The reconnection of field lines in this region decreases the current in the central plasma sheet, dis-turbing the current flow. Excess current is therefore diverted away from the inner current sheet region and redirected into the substorm current wedge (SCW; McPherron et al., 1973). The SCW consists of field-aligned currents directed both into and out of the ionosphere, which are closed in the ionosphere by a westward auroral electrojet and in the tail by a dawn-ward directed current. The modified NENL model involves braking of high-speed, Earthward ion flow in the region of the Earth’s magnetic field that is more dipolar than further downtail. This ion flow is diverted, producing a dawnward inertia current at the boundary between dipolar and tail-like fields. As flux pile-up continues, this boundary moves tail-wards; in the modified NENL model, it is at this boundary that the SCW is formed.
A consequence of the formation of a NENL together with the distant neutral line is the formation of a region of entirely closed magnetic flux, or plasmoid. At distances greater than
∼30 RE downtail plasmoid-type flux ropes from 10 RE long
have been detected travelling mostly tailward as found in ISEE and Geotail studies (Ieda et al., 1998). Between 20 and
30 RE downtail smaller flux ropes of 1 to 5 RE in diameter
have been detected travelling both Earthward and tailward
in equal numbers by Geotail (Slavin et al., 2003). Travel-ling compression regions (TCRs) are intensifications of the lobe magnetic field caused by the movement of plasmoids within the magnetotail. The presence of the plasmoid forces the lobe magnetic field lines to compress around it, and these compressions appear to move as the plasmoid moves through the tail. TCRs can be detected as perturbations in the north-south component of the magnetic field, usually bipolar in na-ture, reflecting the motion of the plasmoid, and by simulta-neous enhancements in the intensity of the tail field magni-tude. They are typically detected for a few minutes at a time, and both Earthward and tailward-moving TCRs have been observed; Slavin et al. (2005) showed that 20% of TCRs
de-tected by Cluster within 20 RE of Earth were tailward
di-rected whilst the rest were Earthward didi-rected.
The CCI model suggests that current disruption in the near-Earth current sheet at the start of the expansion phase of the substorm is caused by the onset of an instability and a high level of magnetic field fluctuations. The SCW is formed and diverts current into, and back out of, the ionosphere, and the NENL is formed further downtail (at around 20
to 30 RE) as a result. This then allows reconnection of
Field-aligned currents (FACs; Potemra, 1979; Stern, 1983) consist of two coupled systems: the Region 1 currents, which flow into the ionosphere from the magnetotail in the post-midnight sector, and out of the ionosphere in the pre-midnight sector; and the Region 2 currents, which are oppo-sitely directed and occur in the ionosphere at lower latitudes. The Region 1 currents are located along the outer edge of the plasma sheet, while the Region 2 currents are located well within the plasma sheet. These currents couple the magneto-sphere to the ionomagneto-sphere and are a consequence of drag im-posed on ionospheric plasma particles, colliding with neutral particles, as the magnetic field lines with which they are as-sociated are pulled over the polar caps (Cowley, 2000). The eastward and westward electrojets meet in the Harang dis-continuity region, where the Region 1 and 2 currents become hard to distinguish.
Hence, in the NENL model substorm onset is initiated by spontaneous reconnection of magnetic field lines at around
20 to 30 REdowntail, while in the CCI model it is the current
disruption closer to Earth that is the initiator of substorm on-set. In this paper we examine observations from a large num-ber of instruments collecting data in the solar wind, magneto-sphere and ionomagneto-sphere in order to determine the development of a substorm on a large scale. We pay special emphasis on the observations in the tail by Cluster relating the currents measured there to the overall substorm cycle.
2 Instruments
Data from various instruments on the four Cluster space-craft were used in this study. The Fluxgate Magnetome-ter (FGM; Balogh et al., 1997) provided information about the magnetic field, while the Cluster Ion Experiment (CIS; R`eme et al., 1997) and Plasma Electron and Current Experi-ment (PEACE; Johnstone et al., 1997) instruExperi-ments provided information about the low energy ions (0.02 eV to 30 keV) and electrons (0.7 eV to 30 keV), respectively. The Research with Adaptive Particle Imaging Detectors (RAPID; Wilken et al., 1997) instrument provided high energy electron (40 to 400 keV) data from the Imaging Electron Spectrometer (IES) instrument. At the time of interest the Cluster spacecraft
were located at around 15 REdowntail, 8 REfrom midnight
in the pre-midnight sector and around 2 RE above the
equa-torial plane at a separation of ∼1 RE; Cluster 1 was located
closest to midnight, Cluster 2 furthest from midnight, Clus-ter 3 closest to the equatorial plane, and ClusClus-ter 4 was located farthest downtail. Figure 1 presents the position of the mag-netic footprint of the Cluster 1 spacecraft on 5 October 2002 between 00:00 and 06:00 UT (orange line) mapped using the Tsyganenko 1996 model (Tsyganenko and Stern, 1996).
Supporting data are available from a number of other sources. The solar wind conditions for this event were de-tected using the magnetometer instrument (MAG; Smith et al., 1998) and Solar Wind Electron Proton Alpha Moni-tor instrument (SWEPAM; McComas et al., 1998) on the Advanced Composition Explorer spacecraft (ACE; Stone et
al., 1998). The near-Earth (6.6 RE)downtail conditions were
investigated for this event using magnetic field data from a Geostationary Operational Environmental Satellite (GOES-8) spacecraft (Nagai et al., 1982) and energetic proton and electron flux data from a Los Alamos National Laboratory (LANL-01A) spacecraft (Belian et al., 1978).
Data from two ground-based magnetometer chains were also used in this study: the Canadian Auroral Network for the Open Program Unified Study (CANOPUS; Rostoker et al., 1995) and the Greenland magnetometer network (Friis-Christensen et al., 1985). The CANOPUS magnetometers are located in west-central Canada (green crosses on Fig. 1), while the Greenland magnetometers are located along the eastern and western coasts of Greenland (red crosses on Fig. 1). Magnetometer stations of particular interest are la-belled. Unfortunately, data from other magnetometer sites located between CANOPUS and Greenland were not avail-able to provide more comprehensive coverage of this region of the ionosphere, as they were either located at too high a latitude to detect the substorm onset, or had no data available for this interval.
Ground-based data were also used from six of the Northern Hemisphere HF radars (Kodiak, Prince George, Pykkvibær, Hankasalmi, Saskatoon, Stokkseyri; depicted in blue in Fig. 1) of the Super Dual Auroral Radar Network (SuperDARN; Greenwald et al., 1995) radar array. These line-of-sight velocity data were used to obtain ionospheric flows.
3 Data description
3.1 Ground magnetometer data, SuperDARN radar data,
and IMF conditions
Figure 2 shows data from two selected CANOPUS
mag-netometer stations, Island Lake (ISL, 64.74◦ invariant
lati-tude; 21:00 MLT at 03:30 UT) and Pinawa (PIN, 60.98◦;
21:00 MLT at 03:30 UT), and from the Narsasuaq (NAQ,
66.31◦; 01:30 MLT at 03:30 UT) Greenland station for 5
Oc-tober 2002, from 02:30 to 04:30 UT. Shown are the X and Z components of the magnetic field at each station, and the X and Z components filtered between 20 and 200 s, providing information on the presence of Pi2 wave activity. The filtered X component of the magnetic field first detected Pi2 waves at 02:50 UT, and this time is taken as that of substorm expan-sion phase onset in the absence of optical data for this event. At 02:52 UT a decrease in the X component at the ISL sta-tion and a positive increase in the X component at PIN were detected. The PIN station also detected a decrease in the Z component of the magnetic field at this time, whilst ISL de-tected a gradually decreasing Z component. Given that both ISL and PIN were located at the same local time we conclude that ISL detected a westward electrojet, and was equatorward of the centre, whilst PIN detected the edge of the eastward electrojet. The NAQ station detected Pi2 pulsations from 02:52 UT. The X component of the magnetic field decreased
-200 0 200 X (nT) -100 0 100 -300 -1000 100 -20 0 20 -10 0 10 -10 0 10 -100 0 100 -100 0 100 -100 0 100 -20 0 20 -5 0 5 -5 0 5
02
4003
0003
2003
4004
0004
20UT
5 Oct 2002
CANOPUS & Greenland
X, Z and Pi2 filtered data
0250 UT ISL PIN NAQ ISL PIN NAQ ISL PIN NAQ ISL PIN NAQ X (nT) Pi2 filtered Z (nT) Z (nT) Pi2 filtered -200 Figure 2 31Fig. 2. CANOPUS and Greenland magnetometer data for 5 October 2002, from 02:30 to 04:30 UT, for the Island Lake (ISL), Pinawa (PIN)
and Narsarsuaq (NAQ) stations. Panels depict: X component of magnetic field; Pi2 filtered (period band 20 to 200 s) X component; Z component of magnetic field; Pi2 filtered Z component. Substorm onset at 02:50 UT is indicated by the vertical dashed line.
from 02:53 UT, indicating detection of the westward elec-trojet. At onset, the Z component of the magnetic field was negative, increasing and turning positive around 8 min after onset. This indicates that the centre of the westward elec-trojet was located poleward of the NAQ station at onset, and equatorward of the NAQ station from 8 min after onset.
Line-of-sight velocity measurements from six of the Su-perDARN radar array (Kodiak, Prince George, Pykkvibær, Hankasalmi, Saskatoon and Stokkseyri) were available for this interval. They were combined using the map potential analysis technique (Ruohoniemi and Baker, 1998) to produce large-scale global convection maps at two-minute intervals
Figure 3
-4
-2
0
IMF B
XGSM(nT)
2
46
-4 -20
2
01
3001
4502
0002
1502
3002
4503
0003
1503
30UT
0
2
4
6ACE MAG data lagged by 66.0 min
380
390
400
410
420
V
Total(GSM)(km s
-1)
01
3001
4502
0002
1502
3002
4503
0003
1503
30UT
0.6
0.7
0.8
0.9
1.0
1.1
1.2
Dynamic
pressure
(nPa)
ACE SWEPAM data lagged by 66.0 min
5 October 2002
Advanced Composition Explorer (ACE)
MAG & SWEPAM
0250 UT
IMF B
YGSM(nT)
IMF B
ZGSM(nT)
IMF B
Total(nT)
Figure 4
32
Fig. 3. SuperDARN map potential plots for 5 October 2002 in the Northern Hemisphere polar cap within 60 deg (geographic coordinates)
with IMF value and direction indicated. Noon local time is at the top of the plot. (a) 02:50 to 02:52 UT; (b) 03:14 to 03:16 UT; (c) 03:20 to 03:22 UT. Figure 3 -4 -2 0 IMF BXGSM (nT) 2 4 6 -4 -20 2 0130 0145 0200 0215 0230 0245 0300 0315 0330 UT 0 2 4 6
ACE MAG data lagged by 66.0 min
380 390 400 410 420 VTotal(GSM) (km s-1)
01
3001
4502
0002
1502
3002
4503
0003
1503
30UT
0.6 0.7 0.8 0.9 1.0 1.1 1.2 Dynamic pressure (nPa)ACE SWEPAM data lagged by 66.0 min
5 October 2002
Advanced Composition Explorer (ACE)
MAG & SWEPAM
0250 UT
IMF BYGSM (nT) IMF BZGSM (nT) IMF BTotal (nT) Figure 4 32Fig. 4. ACE MAG and SWEPAM data for 5 October 2002, from 01:30 to 03:30 UT, lagged by 66 min. Top panel depicts MAG data: Bx,
By, Bzcomponents of magnetic field and the total magnetic field, in GSM coordinates. Bottom panel depicts SWEPAM data: total velocity
0 50 100 150 200 BX (nT) -100 -80 -60 -40 -20 BY (nT) 40 60 80 100 120 BZ (nT) 50 100 150 BT (nT) 0 20 40 60 80 lambda (deg)
5 Oct 2002
0250UT 0256UT GOES 8 MFI 0230 0245 0300 0315 0330 0345 0400 0415 0430 UT Figure 5 33Fig. 5. GOES 8 magnetometer data for 5 October 2002, from 02:30
to 04:30 UT. Bx, By, Bzcomponents of magnetic field, total
mag-netic field, and lambda, where tan λ=Bz/
√
(Bx2+By2), are shown.
over the period of interest. At substorm onset, no strong flows were detected in the pre-midnight sector (see Fig. 3a). However, intensification of ionospheric flow occurred in the
midnight sector to ∼800 ms−1from 03:14 UT (24 min after
onset; Fig. 3b), and to ∼1000 ms−1from 03:20 UT (30 min
after onset; Fig. 3c).
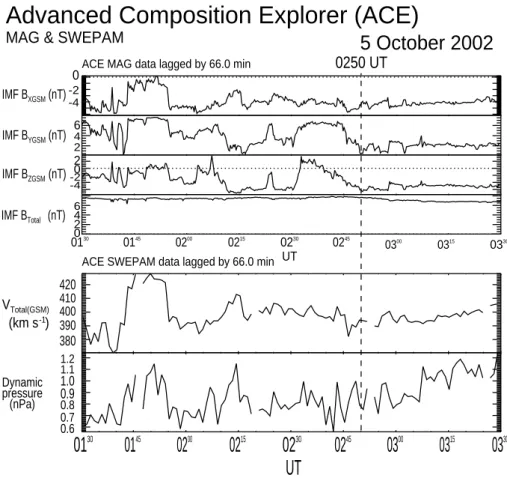
The IMF conditions for this event are shown in Fig. 4. These are data from the MAG and SWEPAM instruments on the ACE spacecraft for 5 October 2002, from 01:30 to 03:30 UT. They are lagged by 66 min to take into account the time between the solar wind being detected at the spacecraft and it reaching the Earth’s magnetopause. This lag is found using the technique of Khan and Cowley (1999). The IMF
conditions around onset time were generally steady, with Bz
negative for around 45 min prior to onset (apart from a small northward excursion around 15 min prior to onset). After
on-set the IMF conditions remained steady with Bz negative.
The solar wind velocity was ∼400 kms−1 for the interval,
and the dynamic pressure underwent a graduated increase from ∼0.9 nPa to ∼1.1 nPa over ∼40 min. It is worth not-ing that the data show no evidence for substorm triggernot-ing.
3.2 Near-Earth instruments
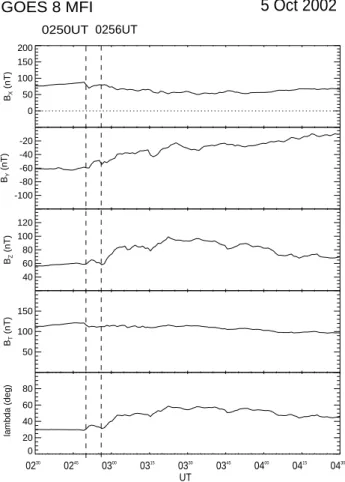
Figure 5 shows magnetometer data from the GOES 8 space-craft for 5 October 2002, from 02:30 to 04:30 UT. In GSM,
this spacecraft was located 5.5 RE downtail, 3.4 RE from
midnight in the pre-midnight sector and within 0.5 RE of
the GSM equatorial plane in the 22:00 MLT sector. The satellite is located north of the magnetic equator. A slight increase in the latitude angle of the field, λ (where tan
λ=Bz/
√
(Bx2+By2)), is observed at 02:50 UT and is followed
by a stronger increase at 02:56 UT, indicating dipolarization
of the magnetic field at 6.6 RE downtail. This is the
signa-ture of expansion phase onset at this location in the magne-tosphere.
Particle data from the Synchronous Orbit Particle Ana-lyzer instruments (SOPA; Belian et al., 1992) on the LANL-01A (located in 04:00 MLT sector at 03:00 UT), –02A (08:00 MLT at 03:00 UT), –97A (10:00 MLT at 03:00 UT) and 1991-080 (16:00 MLT at 03:00 UT) spacecraft are shown in Figs. 6 (50–315 keV electrons) and 7 (50–400 keV pro-tons) for 5 October 2002, from 00:00 to 06:00 UT. The space-craft located closest to the magnetotail at substorm expansion phase onset is therefore LANL-01A. The electron data show a plasma injection at this spacecraft at 02:51 UT, with dis-persed injections resulting from this event detected at other spacecraft at later times, most notably at the spacecraft lo-cated at 16:00 MLT (1991-080). The proton data show an increase in the dispersed injection at all spacecraft, occurring earliest at 02:55 UT at the spacecraft located at 16:00 MLT (1991-080).
3.3 Cluster data overview
3.3.1 Cluster particle data
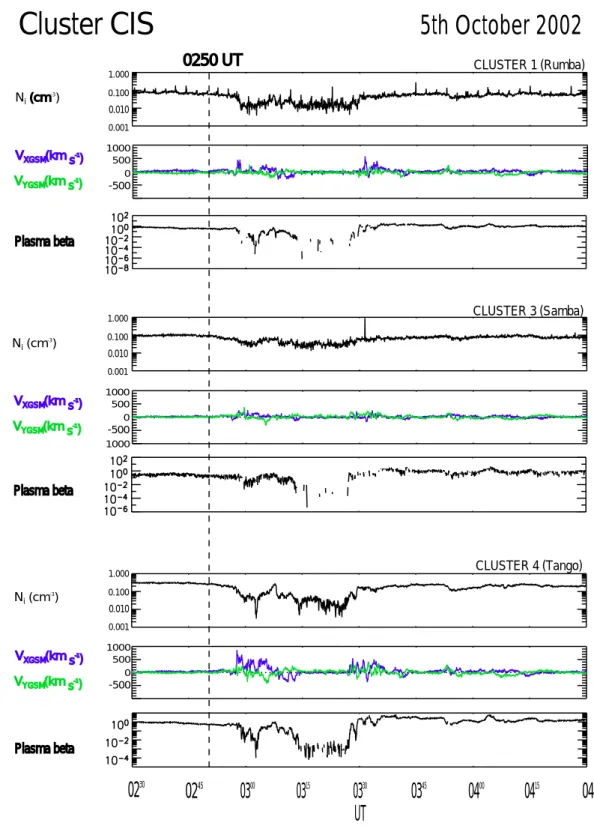
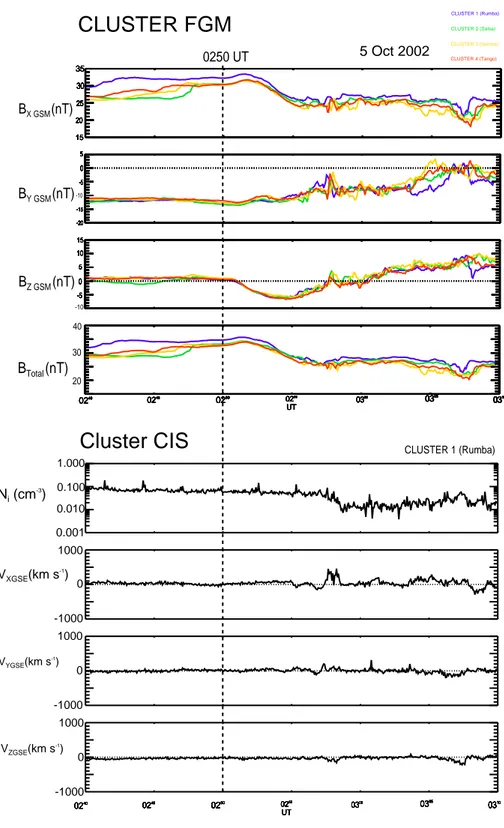
The ion data from the CIS instrument on Cluster 1, 3 and 4 are shown in Fig. 8 for 5 October 2002, from 02:30 to 04:30 UT. Note that the CIS instrument on Cluster 2 was not operational. The plots show the low energy (0.02 eV to
30 keV) ion density, Vxand Vyvelocity components (GSM
coordinates) and plasma beta (2µ0nkT⊥/B2, calculated from
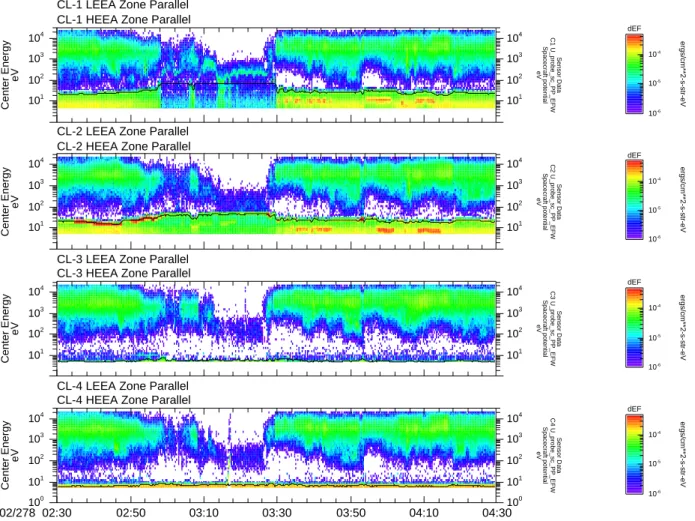
CIS and FGM data). Figure 9 shows low energy electron (0.7 eV to 30 keV) flux data from the four PEACE instru-ments, and Fig. 10 shows high energy electron flux data (20 to 400 keV) from the four RAPID-IES instruments.
The CIS instrument detected an ion density of ∼0.1 cm−3
before the substorm expansion phase onset at 02:50 UT, indicating that the Cluster spacecraft were located in the plasma sheet. The PEACE and RAPID-IES data corrobo-rate this: the PEACE instrument detected a differential flux
of ∼0.5 counts s−1cm−2sr−1keV−1in the 1 to 10 keV
en-ergy range, while the RAPID-IES instrument detected a
dif-ferential flux of ∼2.7 counts s−1cm−2sr−1keV−1in the
40-to 400-keV range. At 02:57 UT they entered the plasma sheet boundary layer, as the density began to decrease and fast Earthward-directed beams (composed primarily of
Figure 6
34
Fig. 6. LANL low energy electron data for 5 October 2002, from 00:00 to 06:00 UT.
CIS instruments. Such beams are the signature of the plasma sheet boundary layer (PSBL, e.g. Baumjohann et al., 1988). These beams became tailward-directed from 03:08 UT un-til 03:14 UT, but had plasma characteristics similar to the Earthward-directed beams. The PEACE data show that the spacecraft did not exit swiftly from the PSBL, but remained in it for around 15 min before entering the lobe at 03:14 UT. Cluster 3, which was located closest to the equatorial plane, detected the smallest decrease in density and the smallest plasma beams. This is consistent with Cluster 3 being further
into the plasma sheet than the other spacecraft. At 03:30 UT the plasma instruments on the Cluster spacecraft detected plasma densities close to those before onset, indicating that they re-entered the plasma sheet at that time. This was ac-companied by further PSBL beam signatures detected by the CIS instrument, directed mainly Earthward.
The plasma beta plots for the three spacecraft clearly de-pict the spacecraft as initially in the plasma sheet, when
plasma beta is close to 1. Plasma beta decreases at all
Figure 7
35
Fig. 7. LANL low energy proton data for 5 October 2002, from 00:00 to 06:00 UT.fluctuating between ∼10−4 and 1 at spacecraft 1 and 4 and
between ∼10−2and 1 at spacecraft 2, then show a clear
tran-sition to the lobe at 03:14 UT when plasma beta is less than
10−2 at all spacecraft. There is another clear transition at
03:30 UT when the spacecraft re-enter the plasma sheet, with plasma beta recovering to ∼1 at all spacecraft.
3.3.2 Cluster Magnetic Field Data
The Cluster FGM data are shown in panels 1 to 4 of Fig. 11a, and in more detail for the 02:40 to 03:10 UT interval in the
top four panels of Fig. 11b. Starting 02:51 UT (1 min af-ter onset), there was a decrease in the x component of the magnetic field from ∼33 nT to ∼26 nT over a 4-min period. Over this same period, the z component of the magnetic field also decreased, from ∼0 nT to ∼–6 nT, and then recovered to
∼0 nT. All spacecraft detected the decrease at virtually the
same time with detailed analysis revealing that Cluster 4, located farthest downtail, detected the negative turning of
Bz last; the recovery was also detected slightly earlier by
CLUSTER 1 (Rumba)
02
3002
4503
0003
1503
3003
4504
0004
1504
30UT
Cluster CIS
5th October 2002
CLUSTER 3 (Samba) CLUSTER 4 (Tango)
0250 UT
0250 UT
Ni (cm (cm -3) VXGSMXGSM(km (km s-1-1) 0.001 0.010 0.100 1.000 -500 0 500 1000 0.001 0.010 0.100 1.000 1000 -500 0 500 1000 0.001 0.010 0.100 1.000 -500 0 500 1000 Ni (cm -3) Ni (cm -3) VYGSMYGSM(km (km s-1-1) VXGSMXGSM(km (km s-1-1) VYGSMYGSM(km (km s-1-1) VXGSMXGSM(km (km s-1-1) VYGSMYGSM(km (km s-1-1) Plasma beta Plasma beta Plasma beta Plasma beta Plasma beta Plasma betaFigure 8
36
Fig. 8. Cluster CIS ion data from spacecraft 1, 3 and 4 for 5 October 2002, from 02:30 to 04:30 UT; density, x and y velocity components
(GSM coordinates) and plasma beta are shown for each spacecraft.
magnetic field at substorm expansion phase onset is charac-terized by a decrease of the x component of magnetic field, accompanied by a positive increase in the z component of magnetic field (e.g. Baumjohann et al., 1999). Therefore the signature detected in this case was not associated with dipolarization.
The current densities calculated from the magnetic field are shown in panels 5 to 7 of Fig. 11a. These are calculated from FGM data from all four spacecraft, with an indication of the accuracy of the calculation given by the divergence of
B (panel 8). When the divergence of B is close to zero, the
CL-1 HEEA Zone Parallel CL-1 LEEA Zone Parallel
10-6
10-5
10-4
ergs/cm**2-s-str-eV
dEF
CL-2 HEEA Zone Parallel CL-2 LEEA Zone Parallel
10-6
10-5
10-4
ergs/cm**2-s-str-eV
dEF
CL-3 HEEA Zone Parallel CL-3 LEEA Zone Parallel
10-6
10-5
10-4
ergs/cm**2-s-str-eV
dEF
CL-4 HEEA Zone Parallel CL-4 LEEA Zone Parallel
10-6 10-5 10-4 ergs/cm**2-s-str-eV dEF 101 102 103 104 Center Energy eV 101 102 103 104 eV Spacecraft potential C1 U_probe_sc_PP_EFW Sensor Data 101 102 103 104 Center Energy eV 101 102 103 104 eV Spacecraft potential C2 U_probe_sc_PP_EFW Sensor Data 101 102 103 104 Center Energy eV 101 102 103 104 eV Spacecraft potential C3 U_probe_sc_PP_EFW Sensor Data 2002/27810 0 101 102 103 104 Center Energy eV 100 101 102 103 104 eV Spacecraft potential C4 U_probe_sc_PP_EFW Sensor Data 02:30 02:50 03:10 03:30 03:50 04:10 04:30
Fig. 9. Cluster PEACE electron energy data from all spacecraft for 5 October 2002, from 02:30 to 04:30 UT.
to onset a current density of ∼0.8×10⁻⁹Am−2was detected
in the y direction, indicative of the cross-tail current at the location of the Cluster spacecraft. This current was mainly due to a difference of the x component of the magnetic field in the z direction. The spacecraft detected a total magnetic
field of ∼30 nT prior to onset, indicating a change in Bx of
∼60 nT across the plasma sheet inside Cluster. Typically, the
current sheet thickness would be around 5 RE. This implies
a total current of ∼60 nT / (µ0×5 RE), or ∼2×10⁻⁹Am−2.
This is of the order of twice the value deduced from the FGM data, and is consistent with a spacecraft location away from the centre of the plasma sheet (where the current density is
reduced). A few minutes prior to onset this Jy current
den-sity is lost, but the total magnetic field remains the same, indicating that the total current within the plasma sheet has remained the same.
When the spacecraft crossed into the plasma sheet bound-ary layer from the plasma sheet at 02:57 UT, predominantly
Earthward-directed Jx current densities were detected by
the spacecraft to a peak value of ∼2.3×10⁻⁹Am−2. At
03:30 UT, the spacecraft crossed the plasma sheet boundary layer from the lobe back into the plasma sheet, and this time
mainly tailward-directed Jx current densities were detected,
to a peak value of ∼–2.7×10⁻⁹Am−2. Examination of the
magnetic field data shows that these currents were
associ-ated mainly with By varying in the z direction, rather than
Bzvarying in the y direction.
4 Discussion
The substorm expansion phase onset timing for this substorm is taken as 02:50 UT. This is from the earliest Pi2 pulsation detection at the PIN and ISL magnetometer stations of the CANOPUS network. It has been deduced that the westward electrojet was located poleward of the ISL station and located equatorward of the NAQ Greenland station after onset. Com-bining these observations constrains the substorm electrojet to the region shown by the shaded area in Fig. 12. This re-gion was in the pre-midnight sector during this interval of the substorm and extended over 4 h of magnetic local time.
Prior to substorm expansion phase onset the current den-sities calculated from the magnetic field measurements at
the Cluster spacecraft indicated a value of Jycurrent around
half the probable average in that region. This small value of cross-tail current indicates that the spacecraft were located
Figure 10
38
Fig. 10. Cluster RAPID-IES electron energy data for 5 October 2002, from 02:30 to 04:30 UT.
to ∼zero a few minutes before onset while the total magnetic field remained constant. This is consistent with the rapid thinning of the current sheet within the plasma sheet dur-ing the growth phase of the substorm, leavdur-ing the spacecraft located above this thinned current sheet.
At 02:51 UT, 1 min after substorm expansion phase onset, the Cluster spacecraft detected a signature not consistent with substorm expansion phase onset in the magnetic field data prior to exiting the plasma sheet to the plasma sheet boundary layer. At onset one would expect to see a classic dipolarization signature for a spacecraft located Earthward of
a near-Earth neutral line, with a decrease in the x component of magnetic field and increase in the z component. Here
Bx increased very slightly then strongly decreased, and
Bz decreased, becoming strongly negative for 7 min. Bx
remained reduced when the spacecraft entered the plasma
sheet boundary layer, but Bzrecovered to its original value
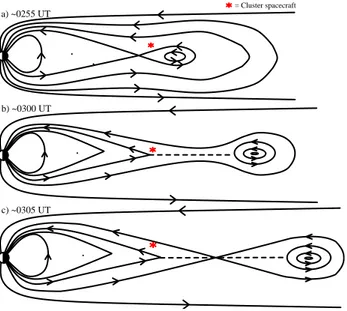
of ∼1 nT. This signature is consistent with the formation of a reconnection site Earthward of the spacecraft, creating a plasmoid whose centre was tailward of the spacecraft which then formed a TCR, as illustrated in Fig. 13a. Thus only fields with a negative z component were observed as
Figure 11a
39
Fig. 11. (a) Cluster FGM data for 5 October 2002, from 02:30 to 04:30 UT. Bx, By, Bzcomponents of the magnetic field (GSM coordinates),
the total magnetic field, Jx, Jy, Jzcomponents of the current (also GSM coordinates), div B and plasma beta are shown, with shaded areas
representing regions of magnetosphere;
the TCR formed and then departed tailward. The tailward motion is corroborated by the order in which the spacecraft detected the TCR: the spacecraft farthest downtail, Cluster 4,
detected the TCR last. The formation of this plasmoid
resulting in a TCR under the spacecraft places the spacecraft
tailward of a near-Earth neutral line, and positive Bx
con-firms that the spacecraft were above the plasma sheet centre,
in the PSBL. Analysis of the timings for the peak in Bx, the
negative turning of Bz and the peak in Bt ot al revealed that
the TCR was travelling at ∼200 kms−1. This is around one
quarter the values described in Slavin et al. (2005), but may be accounted for by the fact that the TCR was still in its early stages of formation. Immediately after the plasmoid
departed downtail and Bz returned to small positive values,
the spacecraft all detected a decrease in plasma densities and a sustained increase in plasma velocities for up to 10 min at Cluster 4. The Cluster 3 spacecraft, located closest to the equatorial plane, detected the weakest beams and smallest decrease in plasma density. This began at 02:57 UT, and
indicates that the spacecraft entered the PSBL at that time; their location is illustrated in Fig. 13b. There was therefore a significant time delay (6 min) between the measurement
of a negative Bzand the subsequent detection of Earthward
flows which is accounted for by this scenario. Figure 13c
illustrates the departure of the plasmoid downtail. From
03:08 UT the beams were tailward and detected mainly by Cluster 1 and 4, indicating that the beams were located only on the outer edge of the plasma sheet and not further into the plasma sheet where the Cluster 3 spacecraft was
located. The tailward beams indicate that the spacecraft
may have detected PSBL particles that were mirrored at the Earth and returned to the location of the spacecraft during time-dependent behaviour of the plasma sheet, but further study is required to determine whether this is the case. From here the spacecraft exited to the lobe. At 03:30 UT, the spacecraft re-entered the plasma sheet from the lobe, again crossing the PSBL, and detected increased densities and high-speed Earthward plasma beams. Taguchi et al. (1998)
CLUSTER 1 (Rumba) 15 20 25 30 35 15 20 25 30 35 CLUSTER 2 (Salsa) 15 20 25 30 35 15 20 25 30 35 CLUSTER 3 (Samba) 15 20 25 30 35 15 20 25 30 35 CLUSTER 4 (Tango) 15 20 25 30 35 15 20 25 30 35 -20 -15 -5 0 5 -20 -15 -5 0 5 -20 -15 -5 0 5 -20 -15 -5 0 5 -20 -15 -5 0 5 -20 -15 -5 0 5 -20 -15 -5 0 5 -20 -15 -10 -5 0 5 -5 0 5 10 15 -5 0 5 10 15 -5 0 5 10 15 -5 0 5 10 15 -5 0 5 10 15 -10 -5 0 5 10 15 -5 0 5 10 15 -5 0 5 10 15 0240 0245 0250 0255 0300 0305 0310 UT 0240 0245 0250 0255 0300 0305 0310 UT 0240 0245 0250 0255 0300 0305 0310 UT 0240 0245 0250 0255 0300 0305 0310 UT 0240 0245 0250 0255 0300 0305 0310 UT 0240 0245 0250 0255 0300 0305 0310 UT 0240 0245 0250 0255 0300 0305 0310 UT 0240 0245 0250 0255 0300 0305 0310 UT 20 30 40 0250 UT
CLUSTER FGM
5 Oct 2002 BZ GSM (nT) BX GSM (nT) BY GSM (nT) BTotal (nT) CLUSTER 1 (Rumba) 0.001 0.010 0.100 1.000 Ni (cm -3 ) VXGSE(km s -1 ) VYGSE(km s -1 ) VZGSE(km s -1)Cluster CIS
-1000 1000 0 -1000 1000 0 -1000 1000 0 0240 0245 0250 0255 0300 0305 0310 UT 0240 0245 0250 0255 0300 0305 0310 UT 0240 0245 0250 0255 0300 0305 0310 UT 0240 0245 0250 0255 0300 0305 0310 UT 0240 0245 0250 0255 0300 0305 0310 UT 0240 0245 0250 0255 0300 0305 0310 UT 0240 0245 0250 0255 0300 0305 0310 UT 0240 0245 0250 0255 0300 0305 0310 UTFigure 11b
40
Fig. 11. (b) zoomed view for the 02:40 to 03:10 UT interval: Bx, By, Bzand Bt ot alCluster FGM data from the four spacecraft and density,
Vx, Vyand VzCIS data from Cluster 1.
examined the midtail lobe TCRs relative to onset during
substorm events and interpreted “the flat BZphase preceding
the south tilting interval” in the same way as for this event: “being due to the close proximity to the growing plasmoid bulge just prior to plasmoid ejection down the tail”.
At around 03:05 UT a large Jx current density,
predomi-nantly in the Earthward direction, was detected at the Cluster spacecraft as they left the plasma sheet. A predominantly
tailward Jx current density was detected upon re-entry to
the plasma sheet at 03:30 UT. These currents are due to a difference of the y component of the magnetic field in the
Figure 12
41
Fig. 12. Northern Hemisphere at 03:00 UT on 5 October 2002 in geographic coordinates; shaded area indicates region of substorm electrojet
during substorm. = Cluster spacecraft a) ~0255 UT c) ~0305 UT b) ~0300 UT Figure 13 42
Fig. 13. (a) location of spacecraft within magnetopause around
02:55 UT; (b) location of spacecraft around 03:00 UT; (c) location of spacecraft around 03:05 UT.
z direction, rather than being due to the difference of the z component in the y direction. This suggests that these Earthward- and tailward- directed currents are flowing in a sheet at the boundary of the plasma sheet, in the interface between open and closed field lines. Such sheets of current, having the sense of “Region 1” field-aligned currents, have been observed in substorm simulations (e.g. Birn and Hesse, 1996), with an explanation which is illustrated in Fig. 14.
Figure 14a shows the x-y plane of the magnetosphere, with open field lines above the plasma sheet depicted by dashed blue lines. The dashed red line in the y direction repre-sents the reconnection line which occupies the central part of the tail, shown symmetric about midnight for the simplest case. The dashed red lines with arrows depict plasma stream-lines away from the reconnection line, representing the paths followed by the ends of the newly-reconnected closed field
lines. These imply that a Vy velocity component should be
present in the downstream flow, carrying the newly-closed field lines away from the reconnection region in the midnight sector towards both dawn and dusk, as required to distribute the newly-reconnected flux broadly through the closed field region. The dawnward and duskward motion causes the re-connected field lines to twist in direction in the plasma sheet as shown by the black solid lines, the twist in the North-ern Hemisphere being towards dawn on the dusk side, and
towards dusk on the dawn side, and vice versa in the South-ern Hemisphere.
The consequent shear in By at the surface of the plasma
sheet is associated with a field-aligned current directed to-wards and away from the Earth which has the sense of the “Region 1” current, i.e. Earthward at dawn, and tailward at dusk. This is shown in Fig. 14b, where we show a cut through the y-z plane in a region just Earthward of the re-connection line. The pre-existing plasma sheet is located on either side of the lozenge-shaped portion of the recently-reconnected plasma sheet, which is enhanced as a result of the increased flux of closed field lines within it. A projec-tion of these newly-closed field lines onto this cross-secprojec-tion
is depicted by the black lines; the shear in the Bycomponent
between plasma sheet and lobe can clearly be seen. This re-sults in the current flow along the surface of the plasma sheet, which is depicted by circled blue crosses (current into the page) and dots (current out of the page). The current system is closed in the ionosphere and on the magnetopause.
At 03:05 UT, the Cluster spacecraft were located in the
northern boundary of the plasma sheet (Bx is positive) and
detected an Earthward current, which places them in the northern, dawnward portion of the scenario presented above.
However, the spacecraft were actually located 8 RE from
midnight in the pre-midnight sector, from which we con-clude that the reconnection site and consequent current sys-tem were skewed to the pre-midnight sector at this time. Pre-vious observations show that substorm onsets are often lo-cated in the pre-midnight sector (e.g. Nagai et al., 1998).
The Vy velocities observed by the CIS instrument were
in-deed mainly negative (i.e. dawnward) during this interval, as then expected (see Fig. 8). Following this, the spacecraft exit to the lobe. Upon re-entry at 03:30 UT, they detect a tailward
current in the lobe-plasma sheet boundary, again 8 RE from
midnight. This then places the spacecraft in the northern, duskward portion of the reconnection structure, from which we conclude that the reconnection region and current system had become more centrally-located in the tail by this time,
as may be expected. The sense of the Vy flow measured by
CIS had also changed to become small but mainly duskward directed.
The question of which substorm onset mechanism is sponsible for this substorm event is one that is difficult to re-solve. The substorm onset was taken as 02:50 UT, the time at which Pi2 pulsations were detected at the PIN magnetometer station located at 21 MLT and the development of a westward electrojet. The westward electrojet subsequently developed at NAQ near midnight a few minutes later. The Pi2 pulsations were simultaneous with a small dipolarisation at the location of the GOES 8 spacecraft in the 22:00 MLT sector in geo-stationary orbit, which was followed 5 min later by a larger dipolarization. Just one minute after onset at 02:51 UT, the
Cluster spacecraft detected the formation of a TCR 15 RE
downtail, in the pre-midnight sector. At the same time there was an electron injection detected by the LANL-01A space-craft, in the 04:00 MLT sector in geostationary orbit. These signatures were detected at very widely spaced locations in
Figure 14
43 Figure 14
43
Fig. 14. (a) cut through x-y plane of magnetosphere; (b) cut through
y-z plane of magnetosphere.
the magnetotail, and since they all occurred within just one minute of each other it is not possible to distinguish the loca-tion of initial onset for this substorm. Furthermore, the large local time extent of this event suggests that this was the onset of the full expansion phase rather than a spatially localized pseudobreakup.
It is worth noting that there was a further intensification of this substorm at ∼03:15 UT detected by the ISL and PIN magnetometer stations. There was also a dipolarization at geostationary orbit detected by the GOES spacecraft at this time, and this is also related to the intensifications of iono-spheric flow out of the polar cap depicted in the map potential plot for 03:14 to 03:16 UT (Fig. 3b). The Cluster spacecraft were located in the lobe at this time, and no dipolarization was detected at their location.
5 Conclusions
In this paper we have brought together several data sets which give a good overview of the conditions in the iono-sphere, near-magnetosphere and magnetosphere during a
substorm event on 5 October 2002. Despite not resolving the question of which mechanism was responsible for the sub-storm onset in this case, many other interesting findings have been presented. The magnetometer data set determines the time of onset as 02:50 UT; the time when Pi2 pulsations were first detected for this substorm. The location of the substorm electrojet is constrained using the magnetometer data, and LANL particle data infer the time at which plasma were
in-jected at geosynchronous orbit. A small Jy current detected
before onset is lost a few minutes prior to onset. This in-dicates that the spacecraft detected the rapid thinning of the plasma sheet under the spacecraft prior to onset, i.e. during the growth phase. The negative z component of the magnetic field at substorm onset coupled with a large time delay be-fore detection of Earthward flows is most easily explained by the formation of a tailward-moving plasmoid, produc-ing a TCR at onset. The near-Earth neutral line therefore formed somewhere Earthward of the Cluster spacecraft at
their location of ∼15 RE downtail. Importantly, the
Clus-ter spacecraft detected Region 1 currents during this inClus-ter- inter-val flowing at the surface of the plasma sheet. In contrast to the usual SCW picture, these Region 1 currents were
asso-ciated mainly with Byvarying in the z direction, rather than
Bz varying in the y direction. Initially these currents were
predominantly Earthward-directed as the spacecraft left the plasma sheet, then later were tailward-directed as the space-craft re-entered the plasma sheet. These findings indicate that the Region 1 currents were initially skewed towards the pre-midnight sector, and later became more centrally-located about the midnight sector. This is consistent with previous findings that place substorm onset in the pre-midnight sector of the magnetotail.
Acknowledgements. The authors would like to thank the PIs for the
SuperDARN radars from which data have been presented; the Clus-ter Principal Investigators for the FGM (A. Balogh), CIS (H. R`eme), PEACE (A. Fazakerley) and RAPID (P. Daly) instruments; the ACE MAG and SWEPAM instrument teams and the ACE Science Cen-ter for providing the ACE MAG and SWEPAM data; the Canadian Space Agency (CSA) for supplying the CANOPUS magnetometer data; to M. G. Henderson for providing LANL data and to CDAWeb for providing the GOES data. Thanks also to D. S. Manning for as-sistance with figures. During this study J. A. Wild, G. Provan and A. Grocott were supported by PPARC grant PPA/G/O/2003/00013. N. C. Draper was funded by a University of Leicester postgraduate studentship.
Topical Editor T. Pulkkinen thanks J. Slavin and another referee for their help in evaluating this paper.
References
Baker, D. N., Pulkkinen, T. I., Angelopoulos, V., Baumjohann, W., and McPherron, R. L.: Neutral line model of substorms: Past results and present view, J. Geophys. Res., 101, 12 975–13 010, 1996.
Balogh, A., Dunlop, M. W., Cowley, S. W. H., Southwood, D. J., Thomlinson, J. G., Glassmeier, K.-H., Musmann, G., L¨uhr, H., Buchert, S., Acu˜na, M. H., Fairfield, D. H., Slavin, J. A., Riedler,
W., Schwingenschuh, K., and Kivelson, M. G.: The Cluster mag-netic fields investigation Space Sci. Rev., 79, 65–91, 1997. Baumjohann, W., Paschmann, G., Sckopke, N., Cattell, C. A., and
Carlson, C. W.: Average ion moments in the plasma sheet bound-ary layer, J. Geophys. Res., 93, 11 507–11 520, 1988.
Baumjohann, W., Hesse, M., Kokubun, S., Mukai, T., Nagai, T., and Petrukovich, A. A.: Substorm dipolarization and recovery, J. Geophys. Res., 104, 24 995–25 000, 1999.
Belian, R. D., Baker, D. N., Higbie, P. R., and Hones, E. W.: High-resolution energetic particle measurements at 6.6 RE: 2 high-energy proton drift echoes, J. Geophys. Res., 83, 4857–4862, 1978.
Belian, R. D., Gisler, G. R., Cayton, T., and Christensen, R.: High-Z Energetic Particles at Geostationary Orbit During the Great Solar Proton Event Series of October 1989, J. Geophys. Res., 97, 16 897–16 906, 1992.
Birn, J. and Hesse, M.: Details of current disruption and diversion in simulations of magnetotail dynamics, J. Geophys. Res., 101, 15 345–15 358, 1996.
Cowley, S. W. H.: Magnetosphere-ionosphere interactions – a tu-torial review, in: Magnetospheric Current Systems, edited by: Ohtani, S., Fujii, R., Hesse, M., and Lysak, R. L., Geophys. Monograph 118, AGU Publ., Washington, USA, 91–106, 2000. Friis-Christensen, E., Kamide, Y., Richmond, A. D., and
Mat-sushita, S.: Interplanetary magnetic field control of high-latitude electric fields and currents determined from Greenland magne-tometer data, J. Geophys. Res., 90, 1325–1338, 1985.
Greenwald, R. A., Baker, K. B., Dudeny, J. R., Pinnock, M., Jones, T. B., Thomas, E. C., Villain, J.-P., Cerisier, J.-C., Senior, C., Hanuise, C., Hunsucker, R. D., Sofko, G., Koehler, J., Nielsen, E., Pellinen, R., Walker, A. D. M., Sato, N., and Yamagishi, H.: Darn/SuperDARN: a global view of the dynamics of high-latitude convection Space Sci. Rev., 71, 761–796, 1995. Hones Jr., E. W., Baker, D. N., Bame, S. J., Fedman, W. C., Gosling,
J. T., McComas, D. J., Zwickl, R. D., Slavin, J. A., Smith, E. J., and Tsurutani, B. T.: Structure of the magnetotail at 220 REand
its response to geomagnetic activity, Geophys. Res. Lett., 11, 5– 7, 1984.
Ieda, A., Machida, S., Mukai, T., Saito, Y., Yamamoto, T., Nishida, A., Terasawa, T., and Kokubun, S.: Statistical analysis of the plasmoid evolution with Geotail observations, J. Geophys. Res., 103, 4453–4465, 1998.
Johnstone, A. D., Alsop, C., Burge, S., Carter, P. J., Coates, A. J., Coker, A. J., Fazakerley, A. N., Grande, M., Gowen, R. A., Gurgiolo, C., Hancock, B. K., Narheim, B., Preece, A., Sheather, P. H., Winningham, J. D., and Woodliffe, R. D.: Peace: A Plasma Electron and Current Experiment, Space Sci. Rev., 79, 351–398, 1997.
Khan, H. and Cowley, S. W. H.: Observations of the response time of high-latitude ionospheric convection to variations in the in-terplanetary magnetic field using EISCAT and IMP-8 data, Ann. Geophys., 17, 1306–1335, 1999,
SRef-ID: 1432-0576/ag/1999-17-1306.
Lui, A. T. Y.: Current disruption in the Earth’s magnetosphere: Ob-servations and models, J. Geophys. Res., 101, 13 067–13 088, 1996.
McComas, D. J., Bame, S. J., Barker, P., Feldman, W. C., Philips, J. L., Riley, P., and Griffee, J. W.: Solar Wind Electron Proton Alpha Monitor (SWEPAM) for the Advanced Composition Ex-plorer, Space Sci. Rev., 86, 563–612, 1998.
McPherron, R. L., Russell, C. T., and Aubry, M. P.: Satellite studies of magnetospheric substorms on August 15, 1968, 9,
Phenomenological model for substorms J. Geophys. Res., 78, 3131–3149, 1973.
Nagai, T.: Observed magnetic substorm signatures at synchronous altitude, J. Geophys Res., 87, 4405–4417, 1982.
Nagai, T., Fujimoto, M., Saito, Y., Machida, S., Terasawa, T., Naka-mura, R., Yamamoto, T., Mukai, T., Nishida, A., and Kokubun, S.: Structure and dynamics of magnetic reconnection for sub-storm onsets with Geotail observations, J. Geophys. Res., 103, 4419–4440, 1998.
Potemra, T. A.: Current systems in the Earth’s magnetosphere, Rev. Geophys., 17, 640–656, 1979.
R`eme, H., Bosqued, J. M., Sauvaud, J. A., Cros, A., Dandouras, J., Aoustin, C., Bouyssou, J., Camus, Th., Cuvilo, J., Martz, C., M´edale, J. L., Perrier, H., Romefort, D., Rouzaud, J., d’Uston, D., M¨obius, E., Crocker, K., Granoff, M., Kistler, L. M., Popecki, M., Hovestadt, D., Klecker, B., Paschmann, G., Scholer, M., Carlson, C. W., Curtis, D. W., Lin, R. P., McFadden, J. P., Formisano, V., Amata, E., Bavassano- Cattaneo, M. B., Baldetti, P., Belluci, G., Bruno, R., Chionchio, G., di Lellis, A., Shel-ley, E. G., Ghielmetti, A. G., Lennartsson, W., Korth, A., Rosen-bauer, U., Lundin, R., Olsen, S., Parks, G. K., McCarthy, M., and Balsiger, H.: The Cluster Ion Spectrometry (CIS) Experiment, Space Sci. Rev., 79, 303–350, 1997.
Rostoker, G., Samson, J., Creutzberg, F., Hughes, T., McDiarmid, D., McNamara, A., Jones, A. V., Wallis, D., and Cogger, L.: CANOPUS-A ground based instrument array for remote sens-ing the high latitude ionosphere dursens-ing the ISTP/CGS program, Space Sci. Rev., 71, 734–760, 1995.
Ruohoniemi, J. M. and Baker, K. B.: Large-scale imaging of high-latitude convection with Super Dual Auroral Radar Network HF radar observations, J. Geophys. Res., 103, 20 797–20 811, 1998. Shiokawa, K., Baumjohann, W., Haerendel, G., Paschmann, G., Fennel, J. F., Friis-Christensen, E., Luhr, H., Reeves, G. D., Rus-sell, C. T., Sutcliffe, P. R., and Takahashi, K.: High-speed ion flow, substorm current wedge, and multiple Pi 2 pulsations, J. Geophys. Res., 103, 4491–4507, 1998.
Slavin J. A., Lepping, R. P., Gjerloev, J., Fairfield, D. H., Hesse, M., Owen, C. J., Moldwin, M. B., Nagai, T., Ieda, A., and Mukai, T.: Geotail observations of magnetic flux ropes in the plasma sheet, J. Geophys. Res., 108, 1015–1032, 2003.
Slavin J. A., Tanskanen, E. I., Hesse, M., Owen, C. J., Dun-lop, M. W., Imber, S., Lucek, E. A., Balogh, A., and Glassmeier, K.-H.: Cluster observations of traveling compres-sion regions in the near-tail, J. Geophys. Res., 110, A06207, doi:10.1029/2004JA010878, 2005.
Smith, C. W., Acu˜na, M. H., Burlaga, M. F., L’Heureux, J., Ness, N. F., and Scheifele, J.: The ACE Magnetic Fields Experiment, Space Sci. Rev., 86, 613–632, 1998.
Stern, D. P.: The origins of Birkeland currents, Rev. Geophys., 21, 125–138, 1983.
Stone, E. C., Frandsen, A. M., Mewaldt, R. A., Christian, E. R., Margolies, D., Ormes, J. F., and Snow, F.: The Advanced Com-position Explorer, Space Sci. Rev., 86, 1–22, 1998.
Taguchi, S., Slavin, J. A., Kiyohara, M., Nos´e, M., Reeves, G. D., and Lepping, R. P.: Temporal relationship between midtail traveling compression regions and substorm onset: Evidence for near-Earth neutral line formation in the late growth phase, J. Geo-phys. Res., 103, 26 607–26 612, 1998.
Tsyganenko, N. A. and Stern, D. P.: Modeling the global magnetic field of the large-scale Birkeland current systems, J. Geophys. Res., 101, 27 187–27 198, 1996.
Wilken, B., Axford, W. I., Daglis, I., Daly, P., G¨uttler, W., Ip, W. H., Korth, A., Kremser, G., Livi, S., Vasyliunas, V. M., Woch, J., Baker, D., Belian, R. D., Blake, J. B., Fennell, J. F., Lyons, L. R., Borg, H., Fritz, T. A., Gliem, F., Rathje, R., Grande, M., Hall, D., Kecsuem´ety, K., McKenna-Lawlor, S., Mursula, K., Tanska-nen, P., Pu, Z., Sandahl, I., Sarris, E. T., Scholer, M., Schulz, M., Sørass, F., and Ullaland, S.: RAPID, The Imaging Energetic Particle Spectrometer on Cluster, Space Sci. Rev., 79, 399–473, 1997.