HAL Id: hal-00266799
https://hal.archives-ouvertes.fr/hal-00266799
Submitted on 8 Jan 2020HAL is a multi-disciplinary open access archive for the deposit and dissemination of sci-entific research documents, whether they are pub-lished or not. The documents may come from teaching and research institutions in France or abroad, or from public or private research centers.
L’archive ouverte pluridisciplinaire HAL, est destinée au dépôt et à la diffusion de documents scientifiques de niveau recherche, publiés ou non, émanant des établissements d’enseignement et de recherche français ou étrangers, des laboratoires publics ou privés.
Distributed under a Creative Commons Attribution| 4.0 International License
Demolding strategy to improve the hot embossing
throughput
Tanguy Lévéder, Stéfan Landis, Laurent Davoust, Sébastien Soulan, Nicolas
Chaix
To cite this version:
Tanguy Lévéder, Stéfan Landis, Laurent Davoust, Sébastien Soulan, Nicolas Chaix. Demolding strat-egy to improve the hot embossing throughput. SPIE 6517 Advanced Lithography, 2007, San Jose, United States. �10.1117/12.711151�. �hal-00266799�
Demolding strategy to improve the hot embossing throughput
Tanguy Leveder
*a, Stefan Landis
a, Laurent Davoust
b, Sebastien Soulan
c, Nicolas Chaix
c aCEA – Leti \ Minatec, 17 rue des martyrs, 38054 Grenoble, France
bLEGI/ENSHMG, 1025 rue de la piscine Dom. Univ. BP 53, 38041 Grenoble
cCNRS-LTM, 17 rue des martyrs, 38054 Cedex 9 Grenoble, France
ABSTRACT
Hot embossing throughput is a key issue, which has been addressed in this paper. We show how it is possible to remove the mold from the imprinted resist at the imprint temperature. We study reflow behavior of imprinted patterns, and make a cooling and quenching simulation. This work can lead to design of cooling tools adapted to a given application, and suits as well for the full wafer imprint, as well for the roll imprint.
Keywords: Nanoimprint lithography, pattern reflow, throughput improvement.
INTRODUCTION
The resolution improvement is the main point of interest of the lithography roadmap [1]. Optical lithography is limited by the Raleigh criterion. Different planed solutions to improve the ultimate resolutions are so challenging to implement [2][3], that new ways of patterning resist called next generation lithographies (NGL) [4] have emerged. Among them, the nanoimprint lithography (NIL) appeared as the most promising technique in term of resolution [5]. This also appears as the most innovative one [6]. It has been demonstrated that the resolution issue was fixed with the NIL technique, since the limitation comes only from the mold fabrication, and not from the replication process itself [5]. But the resolution is only one of the key parameters of the lithography process; many others are required to allow an industrial use. For instance, electron beam lithography reaches very low dimension [7], but remains a very slow technique. From a manufacturing point of view, considering equipment costs and production rates, the process cycle times should be as short as possible. It is also desirable to improve mold durability by getting the smoothest possible temperature cycle. In this paper, we will show how it is possible to greatly improve the hot embossing process throughput in lowering thermal cycle amplitude. By considering which part of the thermal cycle is useful for the printing, and which one is not; we performed a study on resist behavior in order to suppress useless steps.
1. Experimental
1.1. Concept of hot demolding
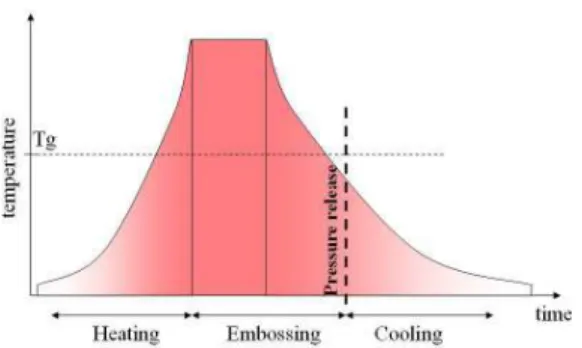
This paper will only focus on the thermal imprint process, also called hot embossing lithography. The usual process, as defined by Chou [4] in 1995, includes three main thermal steps (fig. 1). First, the mold, the substrate and the spin coated resist film are heated above the glass transition temperature of the resist (Tg). The resist then becomes a viscous material, and a pressure is applied on the back side of the mold. The imprint stack then stays at this temperature during the whole imprint step: the patterns are replicated in the liquid polymer. Finally, the imprint stack is cool down below Tg and the resist becomes elastic again. The pressure is then released and the patterns remain in the cold resist.
*
_________________________________ - tune
Heatmg Ernbossmg Cooling
Heating Multi -embossing
time
Cooling
1
...
—I
Figure 1. Standard hot embossing process. The pressure is released after freezing of the resist.
To understand how this thermal cycle can be shortened, two points have been highlighted. First, it is noticeable that from a cost-effectiveness point of view, the embossing time (figure 1) should be the shortest as possible. Subsequently, steps where mold is not really used to print (i.e. cooling time to reach temperature below Tg) should be
avoided. Actually, from the patterning point of view, the only useful part of the process is the printing time, i.e. contact time between the mold and the resist. Then, the heating and cooling times are useless in series in the process. Secondly, it is important to perform imprints at a temperature above the glass transition temperature of the resist. Indeed, the stresses in the material are significantly reduced by avoiding elastoplastic behavior of the polymer, which increases the life time of the mold. But, in order to keep the resist patterns, they have to be frozen. However, even at the melt state, the evolution time of the resist is the result of a competition between the surface tension which tends to flatten the film surface, and the viscosity of the film which slows this flattening down. So, if the reflowing of the resist patterns is slow enough to allow a hot demolding, demolding at imprint temperature would be possible (figure 2).
Figure 2. Proposed multi embossing process. If no cooling is performed between every imprint, time for heating and
cooling is saved up.
We will show in this paper under which conditions it is possible to perform a demolding at imprint temperature and what it implies for the imprint tool conception.
1.2. Experimental set up
In order to characterize the resist reflow after imprint, we proposed an experimental scheme. First, an usual nanoimprint step is performed (figure 3-1).
Figure 3-1. A spin coated resist is first imprinted with the standard nanoimprint process. Demolding is carried out at
______________________I L*L*±.*LLL:s:.L:_1
:::::::::::::::::::::::::::I
.1...
The printing processes have been performed on EVG®520HE system [8] for substrate sizes up to 200 mm wafers. The maximum applied force is 40 kN, equivalent to a pressure of 13 bars on a whole 200 mm wafer. The top and bottom heaters are controlled from room temperature up to 350 °C. The printing process is performed under vacuum by pumping the chamber down to 5.10−4 bar. The 200 mm silicon stamp used for this paper was manufactured with DUV optical lithography and reactive ion etching. A 250 nm isodense line array, 180 nm deep, have been printed into 110 nm thick mr-I 7010E resist from Micro Resist Technology. The resist film was thick enough to ensure a complete filling of the stamp. It has been printed at 110 °C (Tg + 50 °C) under 40 kN for 2 minutes.
In order to observe the time evolution of the resist reflow, patterns were annealed during several time steps (figure 3-2), and then quenched below Tg. Those experiments are performed on small samples (2x20mm2), which
ensures a very low thermal inertia. Consequently, both heating and quenching times are very short compared with the annealing time (below 1 second).
Figure 3-2. By annealing samples for different times, it is possible to access to the time evolution of reflowing patterns.
1.3. Metrology
The initial resist features are 250 nm isodense lines, 180nm high, with sidewall angle larger than 85°. In order to observe the resist patterns reflow above Tg in great details, measurements are performed on frozen resist samples at ambient temperature (20 °C). The pattern shapes were measured with an Atomic Force Microscopy set-up. Accurate measurements of the reflowing shape may be tricky, even if the measurement is performed onto the frozen states. Indeed, for slight resist reflowing (small baking times) the patterns were still vertical with side-wall angles larger than 70°. Standard conic shape AFM tips were therefore inappropriate for such characterizations. For small annealing times flared shape tips onto Veeco Dimension X3D AFM were then used. Such tips can access re-entrant patterns but not acute angles. Thus, the first stages of the reflow is measured with flared tips (figure 4-1), whereas the last stages are measured with conic tips (figure 4-2). Consequently, we could access to accurate measurements of the whole evolution of a reflowing grating as a function of time. We verify that at the two measurements mode are compatible at the boundary (edge angle from 70° to 60°). Those measurements have been performed on the same resist for 4 different temperatures: 80 °C, 90 °C, 100 °C and 110 °C. That is to say from 20 °C to 50 °C above the glass transition temperature of the mr-I 7000E resist.
Figure 4-1. Even very vertical pattern edges can be measured thank to flared tip of the Veeco Dimension X3D AFM, in
a specific CD tapping mode.
-100 -50 0 50 100 -500 0 500
Figure 4-2. By using the same AFM equipment in standard tapping mode with conic tips, it is possible to access
2. Results and analysis 2.1. Experimental results
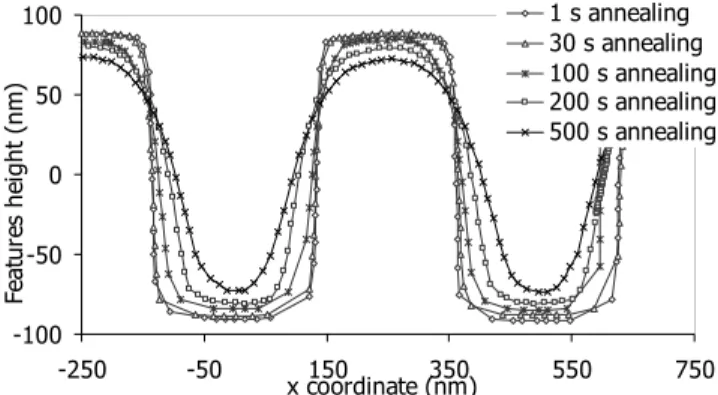
A quantitative characterization of the resist pattern reflow requires defining a process window for a mold-substrate demolding at a printing temperature higher than the glass transition temperature. In this paper, we will look at the pattern height, edge angles, and top rounding modifications with respect to the annealing time for four different temperatures. Figure 5-1 shows the cross sectional profile evolution for an annealing time varying from 1 second to 500 seconds, at 80 °C, i.e. Tg +20 °C. Flared tip was used as long as the sidewall angle was larger than 77°. Then, for smother profiles - i.e. annealing time longer than 100 seconds- conic tips are sharp enough to explore the bottom of the trenches. When increasing the annealing time, the cross-sectional profiles become more rounded and patterns height decreases. This resist flow is clearly related to the surface free energy which tends to minimize the interfacial surface between resist and air.
-100 -50 0 50 100 -250 -50 150 350 550 750 x coordinate (nm) F e a tur e s h e ig ht ( n m ) 1 s annealing 30 s annealing 100 s annealing 200 s annealing 500 s annealing
Figure 5-1. Profile of the reflowing patterns with respect to annealing time. Those experiments have been carried out at
80 °C.
Similarly to a time evolution at a constant annealing temperature; it is possible to plot patterns evolution with respect to temperature, at constant annealing time (30 s) as shown in figure 5-2.
-100 -50 0 50 100 -500 -300 -100 100 300 500 x coordinates (nm) F e a tur e s he ig ht ( n m ) 80 °C90 °C 100 °C 110 °C
Figure 5-2. Profile of the reflowing patterns with respect to annealing temperature. Annealing time has been fixed for
every sample at 30 s.
It is obvious that demolding at imprint temperature leads to a lost of pattern quality. Subsequently, three geometrical parameters will be studied: the pattern heights, the edge angle, and the radius of top rounding. Another point of interest of the following work is to investigate the similarity between time and temperature evolution that figures 5-1 and 5-2 suggest.
2.2. Geometrical analysis
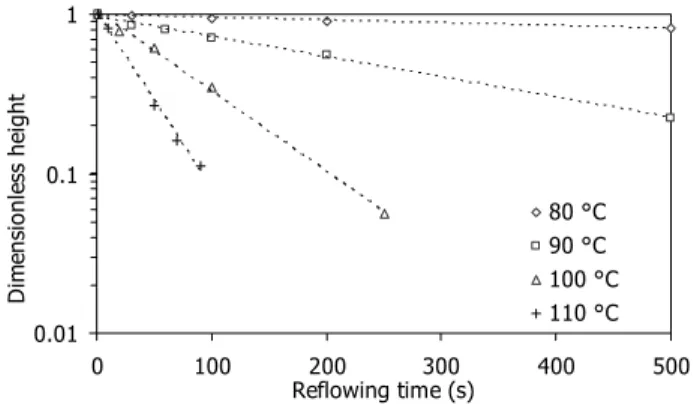
In this section, the evolutions of three geometrical parameters are investigated. The figure 6-1 shows the time evolution of the dimensionless height of patterns. This dimensionless number is a ratio between pattern height during the reflow and pattern initial height. The exponential trends are suggested by logarithmic scale shows for all curves. Moreover the correlation coefficients between experimental data and exponential trends (higher than 0.98) confirm this assessment. Every curve can be fitted withH(t,T)=H0⋅exp
(
−tτ
H( )
T)
, where H is the evolution of pattern height and H0 the initial height, t and T the time and temperature parameters, and τH a characteristic time, which is temperaturedependant, and characterizes time evolution of height. We can notice that slope of the curve (~ τH-1 in a logarithmic
chart) increases with the temperature. This corresponds to the well-known decreasing of polymer viscosity with temperature increasing. 0.01 0.1 1 0 100 200 300 400 500 Reflowing time (s) Dim e ns io nle ss h e igh t 80 °C 90 °C 100 °C 110 °C
Figure 6-1. Time evolution of the dimensionless height of features for 4 different temperatures from Tg + 20 °C to
Tg + 50 °C.
Time and temperature influence on the edge angle and top rounding behaviors has been investigated similarly to the feature height. However, top rounding radius has not been estimated at 80 °C, because the pattern corners are too sharp. The identified trends are identical to the height trend. Exponential trends fit with the experimental data as well for the edge angle (figure 6-2) as for the top rounding radius (figure 6-3). Characteristic times τA¸(angle) and τR (top
rounding) have been computed.
0.01 0.1 1 0 100 200 300 400 500 Reflowing time (s) Di m e ns io nl e ss a n gl e 80 °C 90 °C 100 °C 110 °C figure 6-2 0.01 0.1 1 0 100 200 300 400 500 Reflowing time (s) di m e ns io nl e ss t o p r o u n di n g 90 °C 100 °C 110 °C figure 6-3
Figure 6-2 & 6-3. This charts present time evolution of the dimensionless edge angle and top rounding radius
at different temperatures. The firsts are measured at 4 different temperatures from Tg + 20 °C to Tg + 50 °C and the seconds at 3 different temperatures from Tg + 20 °C to Tg + 40 °C.
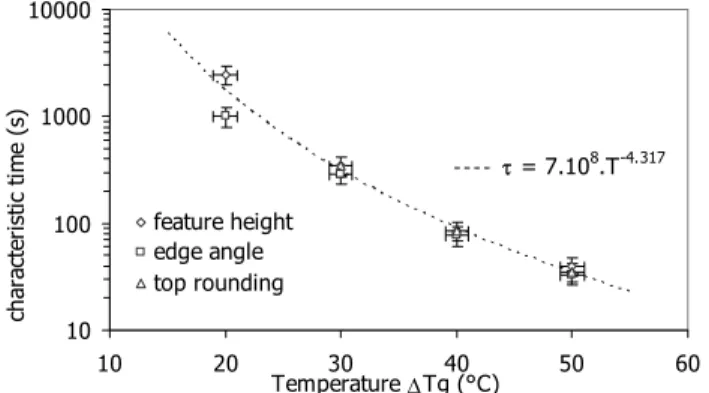
It has been shown that knowing of the temperature dependant characteristic time (τH, τR, and τA) is enough to
fully describe the time evolution of the three studied geometrical parameters with respect to the time at any temperature. The dimensionless parameters are strictly describes by exponential law with high correlation coefficients. It seems obvious that for every temperature (figure 7), the three measured parameters have the same trends. By comparing those evolutions, it appears that is it possible to define an only characteristic time τ. It has been computed that in the studied case, a power-law trend fits with the data with a correlation coefficient of 0.9998. Then, we define a global characteristic time, that is a function of the temperature: τ = K0.(T-Tg)-n, with K0 = 6.72.108 Kn.s, and n = 4.317.
τ = 7.108.T-4.317 10 100 1000 10000 10 20 30 40 50 60 Temperature ∆Tg (°C) ch ar act er is ti c ti m e ( s) feature height edge angle top rounding
Figure 7. Comparison between the three geometrical characteristic times. Their trends are similar and an average
characteristic time describing faithfully the whole reflowing shape can be defined.
2.3. Demolding optimization prospect
In this part, we will show how the previous results can be used to design a quenching tool. Indeed, the imprinted substrate cooling down is a compromise between the fastest one providing high quality imprint, and the slowest one which prevents from thermal stresses. Moreover, the quenching ability of the tool has to be adapted to the imprint (and so, demolding) temperature. The characteristic time describing the whole shape of the grating at all the temperatures enables us to optimize the hot demolding. Indeed, since every quality parameter of the reflowing geometry decreases with an exponential law, we are now able to determine the optimal speed of the imprint cooling down. That is to say that after an imprint at a given temperature, it is possible to calculate the slope temperature which needs to be applied to the substrate to reach a given quality of the imprinted feature.
First, we define at constant temperature the following quality factor: ( ) ( )
0 , , H T t H T t
Q = . This is describing the
time evolution of patterns height during an isothermal annealing. In order to determine the evolution of the patterns during a cooling, we have to integrate the instantaneous lost of quality
( )
t T t Q
∂
∂ , on another thermal way that the
isothermal one. By interpolation and numerical integration we can calculate
( )
∫
( )
∂ ∂ = t dt t T t Q T t Q 0 , ,~ . But, this implies to know (or to choose) the cooling law, that is to say the time dependency of the temperature (soft cooling, or quenching for instance). Then, we finally calculate
(
( )
)
( )
( )
∫
⎜⎜⎝⎛− ⎟⎟⎠⎞ = t dt t t t t T t Q 0 exp 1 , ~ ττ , and this allows us to compare influence
either of cooling rate, or cooling law, or even of the demolding temperature.
The ability to keep patterns good quality as a function either of the demolding temperature, or of the temperature slope, will be investigated. The imprinted substrate is supposed to be cooled down at a controlled rate from
a given imprint temperature. This well-controlled and relatively slow cooling enables us to avoid thermal shock. By choosing either a low imprint temperature, or a quick cooling, it enables us to get good results (figure 8).
60% 80% 100% 0.1 1 10 100 Cooling time (s) R a ti o o f t h e ini tia l qua li ty -10 °C/s -5 °C/s -2 °C/s -1 °C/s figure 8.1 60% 80% 100% 0.1 1 10 100 Cooling time (s) R a ti o o f init ia l q u a lit y 80 °C 90 °C 100 °C 110 °C figure 8.2
Figure 8: Numerical integration of the measured time and temperature parameters allows determining the final shape. Figure 8.1 presents the influence of different cooling rates on patterns quality, at a constant demolding temperature of 110 °C. On the contrary, figure 8.2 shows the patterns behavior for a constant cooling rate of -1 °C/s and for different demolding temperatures: 80 °C, 90 °C, 100 °C and 110 °C.
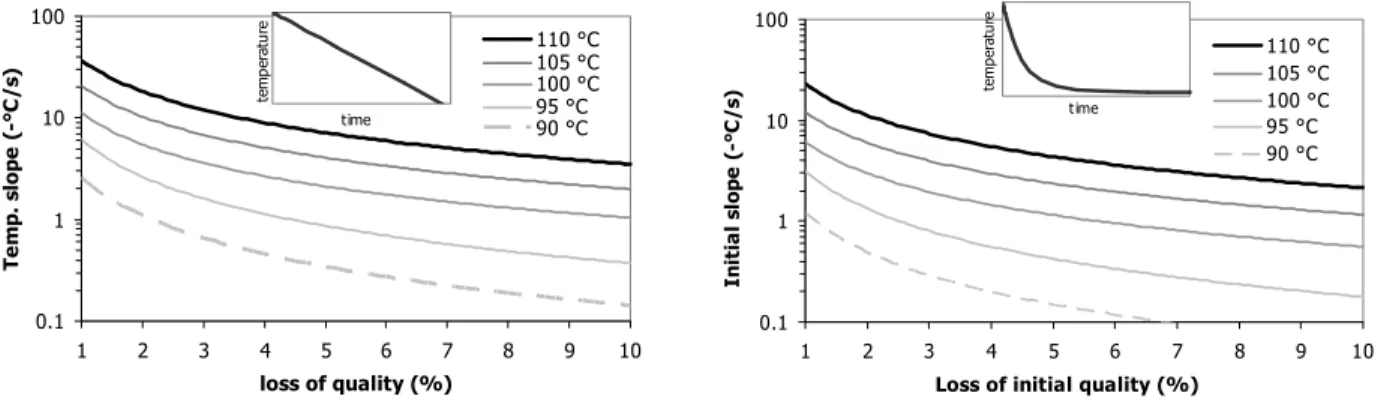
Then, in order to get an optimal process window, or to design an imprint tool, it is useful to know the cooling rate influence on the final pattern quality. The minimum cooling slope needed to get a quality pattern from 90% to 99% during 20 s cooling step has been computed for imprint temperature from 90 °C to 110 °C (figure 9.1). Even if the smoothest temperature transition is requested, we compared those results to a sudden quenching: for instance, the contact with a large, room-temperature, metallic plate. This kind of quench is modeled by an exponential decreasing of the substrate temperature down to the room temperature in 20 s. The free computed parameter is the initial slope of the quench (figure 9.2). This parameter could be linked to the mass of the plate, or to the calorific capacity of the chosen material. 0.1 1 10 100 1 2 3 4 5 6 7 8 9 10 loss of quality (%) Te m p . s lop e ( -° C / s ) 110 °C 105 °C 100 °C 95 °C 90 °C time te m p e ra tu re figure 9.1 0.1 1 10 100 1 2 3 4 5 6 7 8 9 10
Loss of initial quality (%)
I n it ia l s lo p e ( -° C / s ) 110 °C 105 °C 100 °C 95 °C 90 °C t ime te m p e ra tu re figure 9.2
Figure 9. The cooling rate need to get a given ratio of the initial quality loss after a 20 s of cooling has been plotted for two different kinds of cooling. The first one (fig 9.1) is a controlled linear cooling, the second one (fig 9.2) is a sudden quenching.
This study finally exhibits that by designing a quenching tool cooling down a substrate at 6 °C/s, this is possible to keep 98% of the initial perfect shape after an imprint and a demolding at 100 °C.
3. Conclusion
The investigation work leading to the design of a high throughput imprint tool has been done for the mr-I 7000E resist, from micro resist technology. But carry out a demolding at imprint temperature may imply a loss of pattern quality. We demonstrated that the control of the cooling of an imprint enable as to control precisely patterns dimensions, as to design a suitable cooling tool. Although reducing resist dynamic viscosity is known as the best way to improve imprint time, we showed that decreasing reflowing velocity will improve pattern shape, when demolding is performed at temperature above Tg. Our results clearly highlighted interests for tailor-made resists with very low surface free energy, for imprint throughput improvement. Moreover, theoretical works are underway to clearly describe the resist reflow and identify the role of polymer viscosity and surface free energy.
1. The international technology roadmap for semiconductor: 2006 update, lithography.
http://www.itrs.net/Links/2006Update/2006UpdateFinal.htm
2. D. Attwood, J. Phys. D 37, 2004.
3. T.M. Bloomstein, and al., J. Vac. Sci. Technol. B, Vol. 24, No. 6, (2006) 2790-2797 4. S.Y. Chou, P.R. Krauss, P.J. Renstrom, Appl. Phys. Lett. 67 (1995) 3114.
5. F. Hua, Y. Sun, A. Gaur, M. Meitl, L. Bilhaut, L. Rotkina, J. Wang, P. Geil, M. Shim, J.A. Rogers, Nano Lett. 12 (2004) 2467–2471.
6. M. Tormen, F. Romanato, M. Altissimo, L. Businaro, P. Candeloro, E.M. Di Fabrizio, J. Vac. Sci. Tec. B 22 (2004) 767–770.
7. W. Hu, and al, J. Vac. Sci. Technol. B, Vol 22 No. 4 (2004), 1711-1716.