Publisher’s version / Version de l'éditeur:
Questions? Contact the NRC Publications Archive team at
PublicationsArchive-ArchivesPublications@nrc-cnrc.gc.ca. If you wish to email the authors directly, please see the
https://publications-cnrc.canada.ca/fra/droits
L’accès à ce site Web et l’utilisation de son contenu sont assujettis aux conditions présentées dans le site LISEZ CES CONDITIONS ATTENTIVEMENT AVANT D’UTILISER CE SITE WEB.
Technical Report; no. TR-2011-19, 2011-08
READ THESE TERMS AND CONDITIONS CAREFULLY BEFORE USING THIS WEBSITE.
https://nrc-publications.canada.ca/eng/copyright
NRC Publications Archive Record / Notice des Archives des publications du CNRC : https://nrc-publications.canada.ca/eng/view/object/?id=fa180fa9-a9cb-4453-af74-a94fcb1a9a8c https://publications-cnrc.canada.ca/fra/voir/objet/?id=fa180fa9-a9cb-4453-af74-a94fcb1a9a8c
NRC Publications Archive
Archives des publications du CNRC
For the publisher’s version, please access the DOI link below./ Pour consulter la version de l’éditeur, utilisez le lien DOI ci-dessous.
https://doi.org/10.4224/19577541
Access and use of this website and the material on it are subject to the Terms and Conditions set forth at
Thermal requirements for surviving a mass rescue incident in the arctic - report on environmental conditions
DOCUMENTATION PAGE REPORT NUMBER
TR-2011-19
NRC REPORT NUMBER DATE
August 2011
REPORT SECURITY CLASSIFICATION
Unclassified
DISTRIBUTION
Unlimited
TITLE
Thermal Requirements for Surviving a Mass Rescue Incident In the Arctic - Report on Environmental Conditions
AUTHOR (S)
Mak, L.M. and Kuczora, A.
CORPORATE AUTHOR (S)/PERFORMING AGENCY (S)
National Research Council, Institute for Ocean Technology, St. John’s, NL
PUBLICATION
SPONSORING AGENCY(S)
Transport Canada and National Search and Rescue Secretariat
IOT PROJECT NUMBER
2381
NRC FILE NUMBER
KEY WORDS
Arctic survival, accident, cruise ship, airplane, thermal protection PAGES ii, 12 FIGS. 11 TABLES 3 SUMMARY
In this project, the objective is to investigate if the current thermal protective equipment and
preparedness available to people traveling in the Canadian Arctic are adequate for surviving a major air or cruise ship disaster and to identify the minimum thermal protection criteria for survival.
To facilitate experimental design and modeling effort, the environmental conditions along the cross-polar routes for modern aviation and shipping routes for cruise ships in the Canadian Arctic are studied and summarized in this report.
There is daily air traffic through the Arctic, so it is important to consider mean and extreme
environmental conditions throughout the year as accidents may occur any time. However, cruise ship traffic through the Canadian Arctic is typically between the months of July to late September or early October, where the environmental conditions are less severe.
Considering air traffic throughout the year, the daily average air temperature varies between 5°C and -40°C. The extreme minimum air temperature can drop to -55°C and the extreme wind chill can be -70°C. Snow depth can be up to 40 cm during winter months.
For cruise traffic during the months of July to September, the daily average air temperature varies between 5°C and -10°C. In July, there is typically one day or less with temperature below –2°C. In August, there are typically 5 to 10 days below –2°C but not less than -10°C. In September, virtually every day is below -2°C. There are 5 to 10 days below -10°C and approximately 3 days below -20°C. In the summer, typical significant wave height reaches 3 m and peak period varies between 4.5 s and 20 s.
ADDRESS National Research Council
Institute for Ocean Technology Arctic Avenue, P. O. Box 12093 St. John's, NL A1B 3T5
National Research Council Conseil national de recherches Canada Canada Institute for Ocean Institut des technologies
Technology océaniques
Thermal Requirements for Surviving a Mass Rescue Incident
In the Arctic
Report on Environmental Conditions
TR-2011-19Mak, L.M. and Kuczora, A. August 2011
i
Executive Summary
In this project, the objective is to investigate if the current thermal protective equipment and preparedness available to people traveling in the Canadian Arctic are adequate for surviving a major air or cruise ship disaster and to identify the minimum thermal protection criteria for survival.
To facilitate experimental design and modeling effort, the environmental
conditions along the cross-polar routes for modern aviation and shipping routes for cruise ships in the Canadian Arctic are studied and summarized in this report. There is daily air traffic through the Arctic, so it is important to consider mean and extreme environmental conditions throughout the year as accidents may occur any time. However, cruise ship traffic through the Canadian Arctic is typically between the months of July to late September or early October, where the environmental conditions are less severe.
Considering air traffic throughout the year, the daily average air temperature varies between 5°C and -40°C. The extreme minimum air temperature can drop to -55°C and the extreme wind chill can be -70°C. Snow depth can be up to 40 cm during winter months.
For cruise traffic during the months of July to September, the daily average air temperature varies between 5°C and -10°C. In July, there is typically one day or less with temperature below –2°C. In August, there are typically 5 to 10 days below –2°C but not less than -10°C. In September, virtually every day is below -2°C. There are 5 to 10 days below -10°C and approximately 3 days below -20°C. In the summer, typical significant wave height reaches 3 m and peak period varies between 4.5 s and 20 s.
Table of Contents
1.0 Introduction... 1
2.0 Airplane Flight Routes... 2
3.0 Canadian Arctic Cruise Ship Routes and Seasons... 3
4.0 Environmental Conditions ... 4
4.1 Source of Environmental Data... 4
4.2 Compiled Environmental Data ... 6
5.0 Conclusions... 11
6.0 Acknowledgements... 11
7.0 References... 12
List of Tables
Table 1. Environment Canada Weather Stations... 4Table 2. Wave Buoy MEDS023 Available Data ... 5
Table 3. Wave Buoy MEDS086 Available Data ... 5
List of Figures
Figure 1. The new cross-polar routes connect eastern and interior regions of North America to Asian cities via the North Polar region... 2Figure 2. Typical cruise ship routes ... 3
Figure 3. Location of 22 Environment Canada Land Weather Stations and 2 Fisheries and Oceans Wave Buoys ... 5
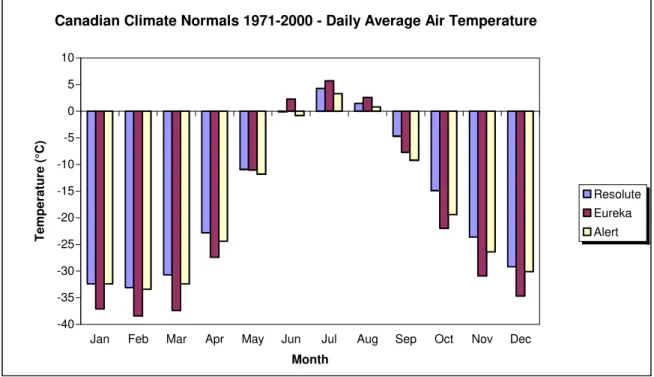
Figure 4. Canadian climate normals 1971-2000, daily average air temperature... 6
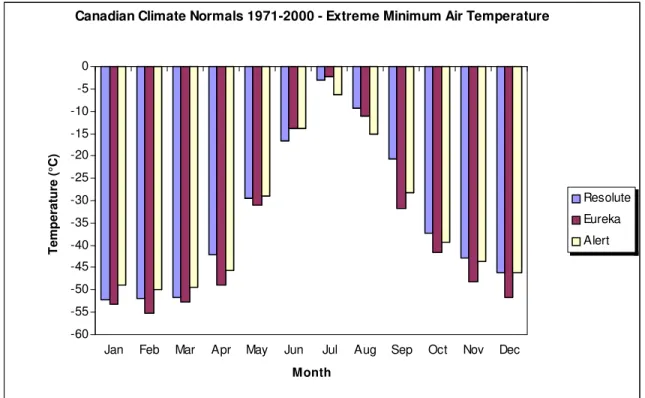
Figure 5. Canadian climate normals 1971-2000, extreme minimum air temperature ... 7
Figure 6. Canadian climate normals 1971-2000, extreme wind chill ... 7
Figure 7. Canadian climate normals 1971-2000, average snow depth... 8
Figure 8. Canadian climate normals 1971-2000, days air temperature < -2°C... 8
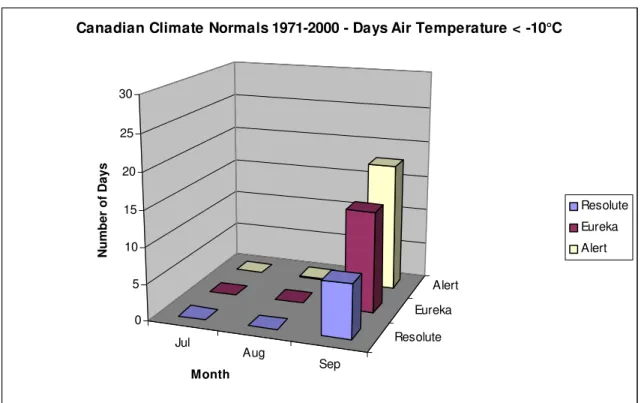
Figure 9. Canadian climate normals 1971-2000, days air temperature < -10°C ... 9
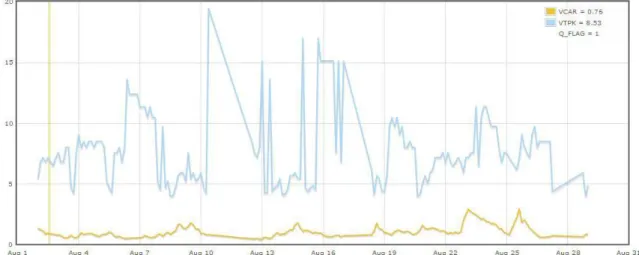
Figure 10. Canadian climate normals 1971-2000, days air temperature < -20°C . 9 Figure 11. Characteristic significant wave height (m), VCAR and wave spectrum peak period (s), VTPK from MEDS023 wave buoy in Aug 1976. ... 10
1
1.0 Introduction
Maritime and air traffic through the Arctic has increased in recent years. Cruise ship and commercial jet liners carry a large number of passengers. With
increased traffic, there is a higher probability that a major disaster could occur. Cruise ship and plane accidents could be catastrophic and may require mass rescue. Due to the remote location, limited search and rescue resources, time for these resources to get to the accident location and large number of survivors, the retrieval time could be several days. Therefore, survivors may be required to survive on their own for days while they await rescue.
Recognizing that the International Maritime Organization does not have specific thermal performance criteria for liferafts and lifeboats and personal and group survival kits, and there is minimum thermal protection for airplanes passengers in an emergency situation, a team of researchers from 14 Canadian and
international organizations, including government agencies, universities,
companies and regulatory authority, initiated a research project to improve safety and provide input for advances to regulations.
The objective of the project is to investigate if the current thermal protective equipment and preparedness available to people traveling in the Canadian Arctic are adequate for surviving a major air or cruise ship disaster and to identify the minimum thermal protection criteria for survival. This project builds on the results and tools developed in other research projects conducted by the team on thermal protection of liferafts, lifeboats and immersion suits.
Representative environmental conditions in the Canadian Arctic were studied and presented in this report, to help define the test conditions for the experiments to be conducted at the ice tank of National Research Council Canada, Institute for Ocean Technology.
2.0 Airplane Flight Routes
For modern air travel, the official opening of cross-polar routes in February 2001 marked an important step in air travel between North America and Asia. After two and one-half years and more than 650 demonstrations flights, airlines are making polar operations routine. The required flight distances from North America to Asia are substantially reduced. The more direct routing also provides significant time and fuel savings. Nonstop flights between North America and Asia via the North Pole, while long recognized as advantageous, have only now become practical. Although the new cross-polar routes take international flights over previously untraveled territory, commercial airlines have been flying in the polar region north of the Arctic Circle for more than 40 years. Today, hundreds of flights operate each week over the interior of Russia en route between Europe and Asia. Similarly, a large volume of traffic crosses the Atlantic north of Iceland and the Arctic Circle on flights between Europe and the West Coast of North America. Figure 1 shows the conventional and new polar routes (Boeing, 2001). In addition to large commercial jet liner, there are small passenger planes flying through the Canadian Arctic (Captain Laval St. Germain, personal communication, Oct 13, 2010).
Figure 1. The new cross-polar routes connect eastern and interior regions of North America to Asian cities via the North Polar region
3
3.0 Canadian Arctic Cruise Ship Routes and Seasons
Canadian Arctic is popular to cruise tourists and adventurers. Cruise ship activity in Canadian Arctic typically starts each year in July and last until late September or early October. Cruise ships, such as Lyubov Orlova, Kapitan Khlebnikov, Akademik loffe, Bremen, Hanseatic, Clipper Adventurer, Prince Albert II, Polar Star, Akademik Shokalskiy, National Geographic Explorer, Ocean Nova, MS Alexander Von Humboldt etc., are some of the vessels that frequent Canadian waters. Over the past years, there has been significant increase in foreign
shipping particularly in the Eastern Arctic around Hudson Bay, Davis Strait, Baffin Bay, Lancaster Sound and the water ways between Ellesmere Island and
Greenland. Some of the cruise ships sail as far North as Smith Sound, beyond the 75N communications boundary. A typical map of cruise ship routes (JTFN, 2009) is shown in Figure 2.
4.0 Environmental Conditions
4.1 Source of Environmental Data
The climate normals and averages of 22 land weather stations (see Table 1) between 1971 and 2000 were collected from Environment Canada, National Climate Data and Information Archive website
http://www.climate.weatheroffice.ec.gc.ca/climate_normals/index_e.html. Stations with an “ * “ indicate that it meets the United Nation’s World
Meteorological Organization (WMO) standards. Amongst the 22 land weather stations, three (Alert, Eureka and Resolute Cars) were selected for final
compilation of representative environmental data because they have the highest latitude and conform to the World Meteorological Organization standards.
Wave data were also collected at two wave buoy locations (MEDS023 and MEDS086) from Fisheries and Oceans Canada, Marine Environmental Data Services (MEDS). The MEDS data is available online at http://www.meds-sdmm.dfo-mpo.gc.ca/. Its databases contain over 6 million observed wave spectra from 500 locations in Canada. Schock and Tominson (2002) gave a description of the MEDS data. Tables 2 and 3 show the data available from the two wave buoys.
Figure 3 shows the locations of the 22 Environment Canada weather stations and the two Fisheries and Oceans wave buoys. Data from the 22 land weather stations are documented in Appendix A.
5
Table 2. Wave Buoy MEDS023 Available Data
Table 3. Wave Buoy MEDS086 Available Data
Figure 3. Location of 22 Environment Canada Land Weather Stations and 2 Fisheries and Oceans Wave Buoys
4.2 Compiled Environmental Data
The daily average air temperature between 1971 and 2000 for Alert, Eureka and Resolute Car is shown in Figure 4. It shows that the average air temperature throughout the year varies between 5°C and –38°C. This is representative of the air traffic seasons year round. However, during the cruise seasons between July and September, the average air temperature varies between 5°C and -10°C only.
-40 -35 -30 -25 -20 -15 -10 -5 0 5 10 Temperature (°C)
Jan Feb Mar Apr May Jun Jul Aug Sep Oct Nov Dec Month
Canadian Climate Normals 1971-2000 - Daily Average Air Temperature
Resolute Eureka Alert
Figure 4. Canadian climate normals 1971-2000, daily average air temperature
Figures 5 to 6 show the extreme minimum air temperature and extreme wind chill respectively. They show that the extreme minimum air temperature can be -55°C and the extreme wind chill can be –70°C. Figure 7 shows the average snow depth.
Figures 8 to 10 show the number of days the air temperature falls below –2°C, -10°C and –20°C respectively during the cruise seasons of July, August and September. It shows that there is typically one day or less with temperature
7 -60 -55 -50 -45 -40 -35 -30 -25 -20 -15 -10 -5 0 Temperature (°C)
Jan Feb Mar Apr May Jun Jul Aug Sep Oct Nov Dec Month
Canadian Climate Normals 1971-2000 - Extreme Minimum Air Temperature
Resolute Eureka Alert
Figure 5. Canadian climate normals 1971-2000, extreme minimum air temperature -80 -70 -60 -50 -40 -30 -20 -10 0 T e mp eratu re (°C)
Jan Feb Mar Apr May Jun Jul Aug Sep Oct Nov Dec
Month
Canadian Climate Normals 1971-2000 - Extreme Wind Chill
Resolute Eureka Alert
0 5 10 15 20 25 30 35 40 Depth (cm)
Jan Feb Mar Apr May Jun Jul Aug Sep Oct Nov Dec Month
Canadian Climate Normals 1971-2000 - Average Snow Depth
Resolute Eureka Alert
Figure 7. Canadian climate normals 1971-2000, average snow depth
Jul Aug Sep Resolute Eureka Alert 0 5 10 15 20 25 30 N u m b er of D ays Month
Canadian Climate Normals 1971-2000 - Days Air Temperature < -2°C
Resolute Eureka Alert
9 Jul Aug Sep Resolute Eureka Alert 0 5 10 15 20 25 30 N u m b er of D ays Month
Canadian Climate Normals 1971-2000 - Days Air Temperature < -10°C
Resolute Eureka Alert
Figure 9. Canadian climate normals 1971-2000, days air temperature < -10°C
Jul Aug Sep Resolute Eureka Alert 0 5 10 15 20 25 30 N u m b er of D ays Month
Canadian Climate Normals 1971-2000 - Days Air Temperature < -20°C
Resolute Eureka Alert
Figure 10. Canadian climate normals 1971-2000, days air temperature < -20°C
Figure 11 shows the typical characteristic significant wave height (m), VCAR, and wave spectrum peak period (s), VTPK, from Aug 1976. It shows the significant wave height reached 3 m and peak period varied between 4.5 s and 20 s.
Figure 11. Characteristic significant wave height (m), VCAR and wave spectrum peak period (s), VTPK from MEDS023 wave buoy in Aug 1976.
11
5.0 Conclusions
The environmental conditions along the cross-polar routes for modern aviation and shipping routes for cruise ships in the Canadian Arctic are summarized in this report, with an objective to guide experimental design and modeling effort. The following conclusions are drawn:
a. There is daily air traffic through the Arctic, so it is important to consider mean and extreme environmental conditions throughout the year as accidents may occur any time. However, cruise ship traffic through the Canadian Arctic is typically between the months of July to late
September or early October, where the environmental conditions are less severe.
b. Considering air traffic throughout the year, the daily average air
temperature varies between 5°C and -40°C. The extreme minimum air temperature can drop to -55°C and the extreme wind chill can be -70°C. Snow depth can be up to 40 cm during winter months.
c. Considering cruise traffic during the months of July to September, the daily average air temperature varies between 5°C and -10°C. In July, there is typically one day or less with temperature below –2°C. In August, there are typically 5 to 10 days below –2°C but not less than -10°C. In September, virtually every day is below –2°C. There are 5 to 10 days below -10°C and approximately 3 days below –20°C.
d. In the summer, typical significant wave height reaches 3 m and peak period varies between 4.5 s and 20 s.
6.0 Acknowledgements
The project team would like to thank National Search and Rescue Secretariat SAR New Initiatives Fund for their financial support on this project, and Transport Canada for sponsoring this project.
7.0 References
1. Boeing (2001), “Polar Route Operations”,
http://www.boeing.com/commercial/aeromagazine/aero_16/polar.html, AERO No.16, Boeing, Last updated Oct, 2001.
2. Marine Environmental Data Service, http://www.meds-sdmm.dfo-mpo.gc.ca/, accessed June, 2009
3. The Green Lane, Canadian Climate Normals or Averages 1971-2000, Environment Canada.
http://www.climate.weatheroffice.ec.gc.ca/climate_normals/index_e.html, accessed June, 2009
4. JTFN (2009), “Expected Arctic Shipping Activity 2009” presentation, Joint Task Force North, Department of National Defense, June 2009.
5. Schock, C and Tominson, S (2002), Marine Environmental Data Service Report for 2002, Marine Environmental Data Service (MEDS), Department of Fisheries and Oceans.