RESEARCH ARTICLE
Liver and Biliary Tract Physiology/Pathophysiology
Determinants of postprandial plasma bile acid kinetics in human volunteers
XJarlei Fiamoncini,1* Andrianos M. Yiorkas,2,7* Kurt Gedrich,1Milena Rundle,3Sanne I. Alsters,2,7 Guus Roeselers,4,8Tim J. van den Broek,4Thomas Clavel,5Ilias Lagkouvardos,6Suzan Wopereis,4 Gary Frost,3Ben van Ommen,4Alexandra I. Blakemore,2,7and Hannelore Daniel11Nutrition and Food Sciences, Technische Universität München, Freising-Weihenstephan, Germany;2Section of Investigative Medicine, Imperial College London, London, United Kingdom;3Division of Diabetes, Endocrinology and Metabolism, Department of Medicine, Imperial College London, London, United Kingdom;4Microbiology & Systems Biology Group, The Netherlands Organisation for Applied Scientific Research, Zeist, The Netherlands;5Institute of Medical Microbiology, Rheinisch-Westfaelische Technische Hochschule Aachen University Hospital, Aachen, Germany;6Core Facility Microbiome/ Next Generation Sequencing, Institute for Food & Health, Technische Universität München, Freising-Weihenstephan, Germany;7Department of Life Sciences, Brunel University London, Uxbridge, United Kingdom; and8Danone-Nutricia Research, Utrecht, The Netherlands
Submitted 17 May 2017; accepted in final form 26 June 2017
Fiamoncini J, Yiorkas AM, Gedrich K, Rundle M, Alsters SI, Roeselers G, van den Broek TJ, Clavel T, Lagkouvardos I, Wopereis S, Frost G, van Ommen B, Blakemore AI, Daniel H.
Determinants of postprandial plasma bile acid kinetics in human volunteers. Am J Physiol Gastrointest Liver Physiol 313: G300 – G312, 2017. First published June 29, 2017; doi:10.1152/ ajpgi.00157.2017.—Bile acids (BA) are signaling molecules with a wide range of biological effects, also identified among the most responsive plasma metabolites in the postprandial state. We here describe this response to different dietary challenges and report on key determinants linked to its interindividual variability. Healthy men and women (n⫽ 72, 62 ⫾ 8 yr, mean ⫾ SE) were enrolled into a 12-wk weight loss intervention. All subjects underwent an oral glucose tolerance test and a mixed-meal tolerance test before and after the intervention. BA were quantified in plasma by liquid chromatography-tandem mass spectrometry combined with whole genome exome sequencing and fecal microbiota profiling. Considering the average response of all 72 subjects, no effect of the successful weight loss intervention was found on plasma BA profiles. Fasting and postpran-dial BA profiles revealed high interindividual variability, and three main patterns in postprandial BA response were identified using multivariate analysis. Although the women enrolled were postmeno-pausal, effects of sex difference in BA response were evident. Exome data revealed the contribution of preselected genes to the observed interindividual variability. In particular, a variant in the SLCO1A2 gene, encoding the small intestinal BA transporter organic anion-transporting polypepti1A2 (OATP1A2), was associated with de-layed postprandial BA increases. Fecal microbiota analysis did not reveal evidence for a significant influence of bacterial diversity and/or composition on plasma BA profiles. The analysis of plasma BA profiles in response to two different dietary challenges revealed a high interindividual variability, which was mainly determined by genetics and sex difference of host with minimal effects of the microbiota.
NEW & NOTEWORTHY Considering the average response of all
72 subjects, no effect of the successful weight loss intervention was found on plasma bile acid (BA) profiles. Despite high interindividual variability, three main patterns in postprandial BA response were
identified using multivariate analysis. A variant in the SLCO1A2 gene, encoding the small intestinal BA transporter organic anion-transport-ing polypeptide-1A2 (OATP1A2), was associated with delayed post-prandial BA increases in response to both the oral glucose tolerance test and the mixed-meal tolerance test.
bile acids; SLCO1A2; postprandial, oral glucose tolerance test; mixed-meal tolerance test
IN ADDITION TO THEIR ROLEin solubilizing lipids in the intestine,
bile acids (BA) are now recognized as important signaling molecules. They serve as ligands of the farnesoid X receptor (FXR) expressed in intestine and liver and thus control syn-thesis and transport of BA but also modulate expression of other genes (24, 28, 39, 43, 57, 64). After the discovery of a G protein-coupled receptor (TGR5) for BA (28, 39), acute met-abolic effects of BA received considerable interest. With the expression of TGR5 and FXR in a wide range of cell types and tissues, BA effects cover immunomodulation, metabolism of adipose tissue and muscle, and gastrointestinal hormone secre-tion [e.g., glucagon-like peptide-1 (GLP-1); 27, 28]. TGR5 activation by BA was shown to activate deiodinase, increasing the level of active thyroid hormone, which, in turn, elevates the expression of enzymes involved in fatty acid oxidation in brown adipose tissue and skeletal muscle (24, 28, 39, 43, 57, 60, 64, 66). TGR5 was also identified as a target for treatment of obesity and type 2 diabetes. BA can [via FXR-induced activation of small heterodimer partner (SHP) and its effect on hepatocyte nuclear factor 4 (HNF-4) and/or forkhead box O1 (Foxo1)] decrease the expression of gluconeogenic enzymes with a beneficial effect on glucose homeostasis in insulin resistance (28, 35, 38, 39). FXR also participates in the regu-lation of insulin synthesis and secretion as well as in the protection of pancreatic islets from lipotoxicity (27, 28, 44, 45). Via sterol regulatory element-binding protein-1c (SREBP-1c) activation, BA were also shown to modulate triacylglycerol synthesis in rodent liver (61).
Given the relevance of BA as receptor ligands and their increase in circulation in the postprandial state, it is remarkable that impressive differences in plasma levels of BA between
* J. Fiamoncini and A. M. Yiorkas contributed equally to this work. Address for reprint requests and other correspondence: J. Fiamoncini, Unité de Nutrition Humaine, UMR 1019-INRA/Université Clermont 1, Centre de Recherches INRA de Clermont-Fd/Theix, F-63122 Saint Genès Champanelle, France (e-mail: jarlei.fiamoncini@inra.fr).
individuals are not explained as yet. Within the NutriTech study, we recorded changes in BA plasma concentrations in 72 healthy male and female (postmenopausal) volunteers in re-sponse to an oral glucose tolerance (OGTT) and a mixed-meal tolerance test (MMTT) combined with exome sequencing and fecal microbiota analysis. We here report on a large interindi-vidual variability of plasma BA profiles with pronounced effects of sex difference and the identification of a number of gene variants underlying hepatic BA synthesis and enterohe-patic recirculation.
METHODS
Study design. The intervention study was carried out by Imperial College London. The study received an ethical approval from Brent Ethics Committee (REC ref: 12/LO/0139). Informed, signed consent was collected from all participants at the moment of enrollment. The research project NutriTech was funded by the European Union 7th Framework Programme (http://clinicaltrials. gov record no. NCT01684917). It aimed at better phenotyping human volunteers in response to standardized challenge tests. Seven-ty-two volunteers (37 women and 35 men), in average 59.2⫾ 4.2 (SE) yr old, body mass index 29.7⫾ 2.7, and healthy at the screening considering fasting glucose and insulin concentrations and blood pressure values, were recruited. The subjects underwent comprehen-sive phenotyping, including MRI scanning, food intake recording, and blood profiling for metabolites, hormones, and chemokines. All sub-jects underwent an OGTT and a MMTT before and after a 12-wk period, in which 40 participants followed a 20% caloric restriction diet while subjects in the control group consumed an average European diet that was matched for their energy expenditure to maintain body weight. Challenge tests always started at 9 AM after 12 h of fasting. The OGTT drink consisted of 75 g glucose in 250 ml of water consumed within 5 min. Blood was collected in heparin-coated tubes at 0, 15, 30, 60, 90, 120, and 240 min. The MMTT (also known as the “PhenFlex drink”) was a high-fat, high-glucose, high-caloric drink (400 ml) consisting of 320 ml tap water, 75 g glucose, 60 g palm olein, 20 g Profitar (protein supplement; Nutricia, Utrecht, The Nether-lands), and 0.5 g artificial vanilla aroma resulting in a shake with 33, 59, and 8% of energy from carbohydrates, lipids, and proteins, respectively. The drink was ingested within 5 min, and blood was collected at 0, 30, 60, 120, 240, 360, and 480 min. Plasma was separated and stored at⫺80°C for later analyses. Clinical chemistry parameters were assayed using enzymatic colorimetric kits, and GLP-1 was measured using an in-house radioimmunoassay as previ-ously described 30).
Bile acid analysis. Plasma bile acids were analyzed by a modified method originally described by Tagliacozzi et al. (53). Briefly, 10l of plasma were mixed with 10l internal standard solution, and 500 l ice-cold methanol was added for deproteinization. Samples were vortexed and centrifuged at 15,000 g for 10 min. The supernatant was transferred to a 96-deep-well plate and evaporated under a stream of N2. The solid remnants were resuspended in methanol-water (1:1). Analysis was performed by liquid chromatography-tandem mass spectrometry using a triple-quadrupole mass spectrometer (Agilent HPLC; Agilent Technologies, Santa Clara, CA; and QTrap 5500; ABSciex, Framingham, MA). BA were separated using a gradient with 0.2% formic acid in water and acetonitrile (acetonitrile going from 30% at the start of the run to 100% at 20 min) with a flow rate of 0.6 ml/min and a reverse phase column [Phenomenex Luna C18(2) 150 ⫻ 4.6 mm; 5-m particle size], kept at 40°C. The mass spec-trometer was operated in negative ion mode, and mass spectra were obtained using the multiple reaction-monitoring mode (MRM). Inte-gration of the peaks was done using Analyst Software (ABSciex). Analyte concentration was calculated using deuterated internal stan-dards (d4-deoxycholic acid, d4-glycoursodeoxycholic acid,
d4-gly-codeoxycholic acid, d4-glycocholic acid, and d5-taurocholic acid). Samples were randomized so that every batch contained samples from men and women and from OGTT and MMTT performed before and after the intervention to avoid batch effects. Reference fasting plasma samples (Recipe Clinical Diagnostics, Munich, Germany) were in-cluded in each batch, and a dilution row of BA standards was processed in a similar manner in every batch for quantitation pur-poses. In total, 13 BA were quantified: ursodeoxycholic acid (UDCA), cholic acid (CA), chenodeoxycholic acid (CDCA), deoxycholic acid (DCA), glycoursodeoxycholic acid (GUDCA), glycocholic acid (GCA), glycochenodeoxycholic acid (GCDCA), glycodeoxycholic acid (GDCA), tauroursodeoxycholic acid (TUDCA), taurocholic acid (TCA), taurochenodeoxycholic acid (TCDCA), taurodeoxycholic acid (TDCA), and taurolitocholic acid (TLCA). Because of the low abun-dancy and values below the lower limit of quantitation, UDCA, TUDCA, and TLCA were not taken into consideration in the statis-tical analysis. In our analyses, BA were grouped as primary (sum of CA, CDCA, and their taurine and glycine conjugates) or secondary⫹ tertiary (DCA, LCA, and UDCA including taurine and glycine con-jugates thereof). The terms “taurine-conjugated,” “glycine-conju-gated,” and “unconjugated” BA are used regardless of whether BA are primary or secondary⫹ tertiary. In the text, total BA refers to the sum of all individual BA.
Exome DNA sequencing. Genomic DNA was extracted from saliva, collected using the Oragene DNA sample collection kit (DNA Genotek, Ottawa, ON, Canada), following the manufacturer’s proto-col. Whole exome-sequencing libraries were prepared from DNA using SureSelectXT Human All Exon V4⫹UTRs (71 Mb) kit (Agilent Technologies). Sequencing was performed on a HiSeq25000 platform generating 100-bp end reads. After quality control using FastQC (29) version 0.10.0, sequencing reads were mapped to the GRCh37 (hg19) reference assembly of the human genome using Burrows-Wheeler Aligner (BWA)-MEM (36) version 0.7.2 (36). Variant calling was performed using Genome Analysis Toolkit (GATK) version 2.6 (41) and quality-filtered variants were annotated in ANNOVAR (58). Annotated exonic variants were filtered on the basis of in silico predictive functional effects on the protein by two algorithms incor-porated in the ANNOVAR suite: 1) SIFT (31), which relies on the degree of conservation of amino acid residues in highly conserved regions in sequence alignments derived from closely related se-quences, and 2) Polyphen-2 (2), which predicts the possible impact of amino acid substitutions on the stability and function of human proteins using structural and comparative evolutionary considerations. These approaches indicate a high probability that an amino acid change is “deleterious” based on a combination of these attributes. The effect of the identified variants on postprandial BA metabolism was analyzed by creating allelic gene scores, which represented the sum of deleterious variants per gene involved in BA synthesis, metabolism, and transport. Where necessary, individual variants were analyzed separately.
High-throughput microbiome 16S rRNA gene amplicon sequencing. Fresh stool samples were collected by subjects before and after a 12-wk intervention period. Samples were immediately frozen at⫺20°C by the subjects after defecation and transported in frozen state to the laboratory at Netherlands Organisation for Applied Sci-entific Research (TNO), where samples were mechanically homoge-nized, split into aliquots in sterile 2-ml cryovials, and stored at ⫺80°C. For fecal genomic DNA isolation, ~100–150 mg of fecal material were directly transferred to DNA isolation plates. Phenol pH 8.0 was added, and the samples were mechanically disrupted by bead beating with a 96-well plate BeadBeater (Biospec Products, Bartles-ville, OK). Isolated DNA was extracted and purified with the Agowa mag Mini DNA Isolation Kit (Agowa, LGC Genomics, Berlin, Ger-many) as described by Kelder et al. (29). Microbiota analysis was performed by high-throughput sequencing of bar-coded amplicons spanning the archaeal and bacterial V4 hypervariable region. These amplicons, generated from a standardized quantity of template DNA
(100 pg) using adapted primers 515F and 806R, were bidirectionally sequenced using the MiSeq system (Illumina, San Diego, CA) as described previously (11).
Data were analyzed as described in detail previously (33). Raw reads were processed using an in-house-developed pipeline (https:// www.imngs.org/; 32) based on the UPARSE approach (16). Se-quences were trimmed to the first base with a quality score⬍3 and then paired. Those with⬍200 and ⬎300 nucleotides and paired reads with an expected error⬎3 were excluded from the analysis. Remain-ing reads were trimmed by five nucleotides on each end to avoid GC bias and nonrandom base composition. The presence of chimeras was tested using UCHIME (15). Operational taxonomic units (OTUs) were clustered at 97% sequence similarity, and only those with a relative abundance⬎0.5% in at least one sample were kept. Taxon-omies were assigned at 80% confidence level using the Ribosomal Database Project (RDP) classifier (59).
Statistical analysis. Depending on the nature of comparisons, t-test, one-way ANOVA, or two-way ANOVA with post hoc multiple-comparison Bonferroni test was used. Unless otherwise stated, differ-ences with P⬍ 0.05 were considered significant. Shapiro-Wilk test was used to assess normality. Results from calculation of area under the curve (AUC) refer to incremental AUC, which considers individ-ual values at t⫽ 0 as baseline. In cases where outliers were removed, their detection was done using the ROUT method.
The contribution of individual predictors to the overall variation of plasma BA concentrations was quantified by means of percent mar-ginal coefficients of determination (R2), which were obtained by means of ANOVA using a mixed-design model taking into account repeated measures per subject during the MMTT. Individual predic-tors included allelic gene scores, microbiota families, sex difference, and MMTT time points. For this analysis, family-level microbiota data were used with a relative abundance of⬎0.5% in at least 30% of the samples. Analysis at lower taxonomic ranks is not compatible with the classification confidence of short reads and the taxonomic incon-gruence of some dominant and prevalent bacterial genera in the human gut.
Statistical analysis of microbiota profiles was performed in the R programming environment using Rhea (https://lagkouvardos.github.
io/Rhea/; 32). OTU tables were normalized to account for differences in sequence depth. The -diversity was computed on the basis of generalized UniFrac distances (12) whereas␣-diversity was assessed on the basis of species richness and Shannon effective diversity (26). For de novo clustering of microbiota profiles, Partitioning Around Medoids was performed as described previously (7).
RESULTS
Effect of the intervention on plasma bile acids. All subjects
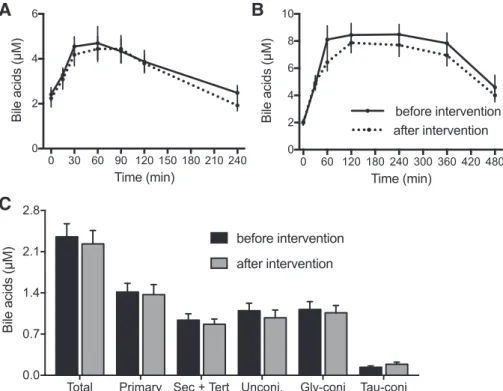
underwent the OGTT and MMTT challenges two times, sep-arated by 12 wk of weight loss intervention. While a subgroup of volunteers (n⫽ 32) followed a supervised diet to keep body weight constant, 40 volunteers followed a diet with a 20% energy restriction that led to a mean weight loss of 5.6 kg. This weight loss, however, did not cause any significant changes in fasting glucose or insulin concentrations (data not shown), nor did it change the composition and concentrations of circulating BA in fasting state and during the dietary challenges (Fig. 1). On the basis of the lack of an effect of the weight loss we calculated and used the mean values of the BA concentrations during the OGTT and MMTT. In this way, we minimized variation and could overcome problems caused by eventual missing samples.
Fasting plasma BA levels. Quantification of the most
abun-dant BA species in plasma (collected between 8 and 9 AM after 12 h of fasting) revealed a high interindividual variability in both concentrations and composition. For the sum of all BA, a 12-fold difference across the 72 volunteers was found. Gly-cine-conjugated BA accounted for ~47% and taurine-conju-gated species for ~7% of the total BA pool, whereas unconju-gated species represented 46% of total (Figs. 2 and 3, G and H,
time point 0). Primary BA were more abundant than the sum of
secondary⫹ tertiary and corresponded to ~60% of the total BA
pool.
A B
C
Fig. 1. Energy restriction did not affect BA profiles during OGTT and MMTT or after 12-h fasting. A: total BA in plasma during the OGTT. B: total BA in plasma during the MMTT. Solid lines represent the BA profile before and dotted lines the BA profile after a 12-wk period of intervention with 20% dietary energy restriction. Only the volunteers that abided by the energy restriction are represented (in control group, no changes due to the energy restric-tion were observed either). C: total BA and BA classes in plasma after a 12-h fasting; n⫽ 40. Sec, secondary; tert, tertiary; unconj, unconjugated; conj, conjugated.Postprandial responses of plasma BA to OGTT and MMTT.
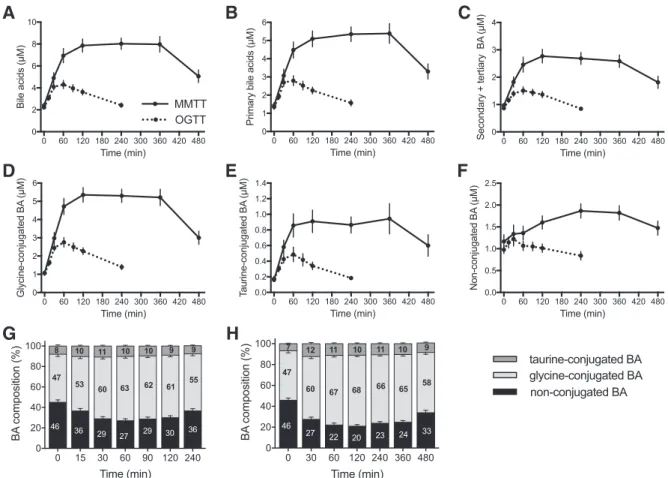
The mean total plasma BA concentration increased 3.3-fold in response to the MMTT (Fig. 3A) with maximal levels reached after 1 h and remaining constant for up to 6 h. Even at 8 h after consumption of MMTT test drink, concentrations were on average 1.7-fold higher than in overnight-fasting state. Bile acid concentrations also increased during the OGTT, but here, peak concentrations were reached after 30 min with levels on average twofold higher than in the fasting state (Fig. 3A). After 90 min, BA concentrations started to decline, to reach fasting state levels after 240 min.
Different classes of BA displayed different kinetic behav-iors. On the basis of mean values of all volunteers, primary BA increased by 3.9-fold during the MMTT and by 2.1-fold during
the OGTT. Secondary⫹ tertiary BA showed a lower response
with a maximal increase of 2.8-fold during the MMTT and 1.8-fold during the OGTT compared with fasting levels (Fig. 3,
B and C). In the OGTT and MMTT, levels of glycine- and
taurine-conjugated BA increased around fivefold in the MMTT and around threefold in the OGTT (Fig. 3, D and E). Plasma concentration of unconjugated BA showed only a small in-crease during MMTT (1.6-fold at 240 min) and even a 15%
Fig. 2. Fasting plasma bile acids. Plasma concentrations of the most abundant BA in healthy subjects in the overnight-fasting state (average of sampling performed at t⫽ 0 of OGTT and MMTT before and after the weight loss intervention). Each differently colored segment in bars represents the con-centration of an individual BA.
A B C
D E F
G H
Fig. 3. Plasma BA concentration profiles in response to the OGTT and MMTT. A–F: plasma concentrations of different BA classes during the OGTT (dotted lines) and MMTT (solid lines). G and H: changes in the composition of the plasma BA pool according to their conjugation type during the OGTT (G) and MMTT (H). Results are shown as means⫾ SE of all volunteers averaging the results of the two challenges performed before and after 12 wk (n ⫽ 72).
decrease at the end of the OGTT (Fig. 3F). A shift in the composition of circulating BA was observed in the transition from fasting to postprandial state. Glycine-conjugated BA, comprising 47% of the total BA pool in fasting state, increased to 68% during the MMTT, and the taurine-conjugated species went from 7 to 11%, whereas unconjugated entities declined from 46 to 20% after 2 h in the MMTT (Fig. 3H). A very similar change in composition was observed during the OGTT, although in this case the increase in glycine-conjugated BA (and concomitant decline in unconjugated species) was less pronounced (Fig. 3G).
Sex-specific differences in postprandial BA responses.
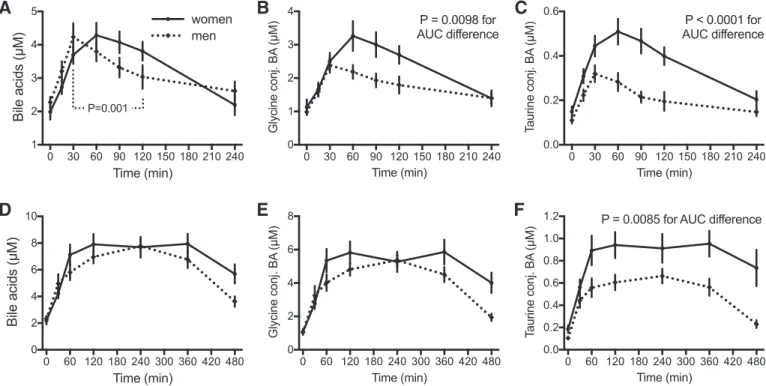
Dur-ing OGTT, plasma BA concentrations increased similarly in men and women, reaching maximum values after 30 and 60 min, respectively. Women thereafter sustained maximal con-centrations of BA for at least 2 h, whereas in men,
concentra-tions were significantly reduced already at 90 min (P ⫽
0.0011) as shown in Fig. 4A. The sex-specific differences in response to the OGTT were particularly evident when
inspect-ing the glycine- and taurine-conjugated BA (P⬍ 0.0001 and
P ⫽ 0.0098 for differences in AUC for taurine- and
glycine-conjugated BA, respectively), as demonstrated in Fig. 4, B and
C. Although less pronounced than in the OGTT, sex-related
differences were also observed in response to the MMTT, but
only for taurine-conjugated BA (P⫽ 0.0085 for difference in
AUC), as shown in Fig. 4F. Despite these postprandial sex differences, overnight-fasting BA concentrations were similar between men and women.
Clusters of postprandial BA responses. Not only fasting BA
concentrations but also postprandial changes in plasma BA displayed large interindividual variability. There was no
cor-relation between the AUC of postprandial total BA and their fasting concentration (data not shown).
Compared with an average 3.3-fold increase in circulating total BA levels following the MMTT, some subjects responded
with a ⬎10-fold increase, whereas others barely showed any
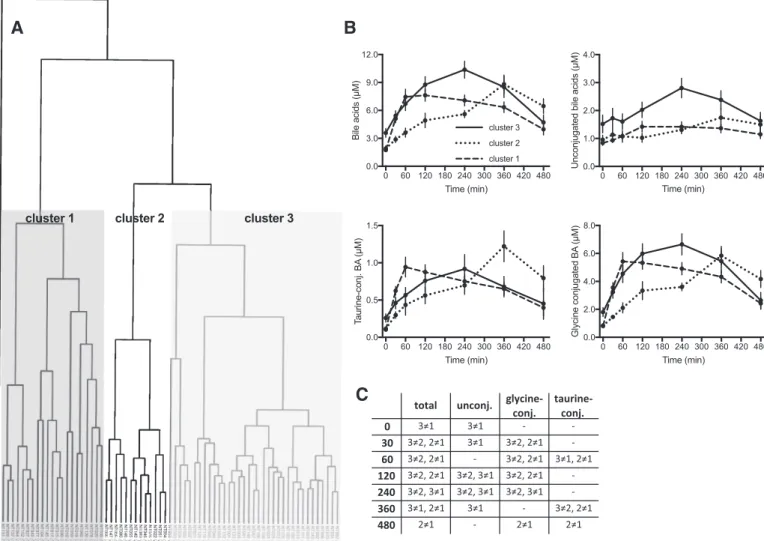
change. A hierarchical clustering approach based on BA con-centration profiles in response to the MMTT identified three subgroups of volunteers with an almost equal distribution of men and woman in each cluster. These significant differences in plasma BA kinetics are shown in Fig. 5, A and B. Different classes of BA displayed distinct kinetic behaviors, particularly when unconjugated BA were compared with conjugated
spe-cies. In cluster 1 (n ⫽ 35), postprandial BA concentrations
increased on average 4.3-fold with a maximum reached within the first hour. Even after 8 h, in this cluster, BA concentrations were 2.3-fold higher than in fasting state. In cluster 3 (n⫽ 21), fasting levels of BA were almost twice as high as in other clusters, but here, subjects displayed a slower increase in plasma profiles with maximal values of ~2.9-fold of fasting state after 4 h, returning to fasting-state concentrations after
8 h. Subjects in cluster 2 (n ⫽ 13) displayed a completely
different kinetic profile with plasma concentrations increasing to a maximum of 4.6-fold of fasting levels at 6 h, and even after 8 h, levels were still 3.4-fold higher than in fasting state.
Determinants of BA profiles. To identify some of the
deter-minants underlying the different BA kinetics, host genome and fecal microbiota sequencing approaches were used. Exome-sequencing data were analyzed for genetic heterogeneity in target genes identified by knowledge and Gene Ontology classification for a subset of 60 genes involved in hepatic BA synthesis, enterohepatic recirculation, and transmembrane
A B C
D E F
Fig. 4. Effects of sex difference on plasma BA concentration profiles during the OGTT and MMTT. A–C: plasma concentrations of total, glycine-conjugated, and taurine-conjugated BA in men (dotted lines, n ⫽ 35) and women (solid lines, n ⫽ 37) during the OGTT. D–F: plasma concentrations of total, glycine-conjugated, and taurine-conjugated BA in men (dotted lines, n ⫽ 35) and women (solid lines, n ⫽ 37) during the MMTT. Results are shown as means⫾ SE, averaging the results of challenges performed before and after intervention. Significant differences in the AUC after t-test are indicated in the graphs.
transport of BA. A list of these genes screened for variations is provided in Table 1. Subjects were grouped according to the presence of variants known or predicted to impair protein functionality defined as “deleterious” based on SIFT and Poly-phen-2 algorithms. Although various gene variants revealed associations with plasma BA profiles (Table 2), those in the
SLCO1A2 gene were observed in a large enough number of
volunteers to allow a reliable association with phenotype.
SLCO1A2 encodes the organic anion-transporting
polypeptide-1A2 (OATPpolypeptide-1A2), which mediates BA uptake across the apical membrane of enterocytes in upper small intestine but also in distal nephrons, in cholangiocytes, and at the blood-brain barrier (10, 21). In this gene, a previously described func-tional polymorphism, rs11568563 (c.A516C, p.E172D,
mi-nor allele frequency⫽ 0.03), was found in 9 out of 72
subjects, and an additional rare variant rs368672331 (c.G727A, p.G243S) was found in another subject. All rs11568563 carriers displayed a delayed postprandial in-crease of conjugated BA in plasma compared with the other volunteers not bearing this variant (Fig. 6). Variants in the
SLC10A2 gene that encodes the apical sodium-dependent
bile acid transporter (ASBT) in ileum (considered the prime
site for BA reabsorption) such as rs71640248, rs117447044, and rs56398830 were also found in four volunteers that as well showed reduced postprandial increases in BA concen-trations (data not shown).
Multivariate analyses providing marginal R2showed that a
substantial proportion of the variation in BA concentration profiles could be attributed to the time point of measurement during the MMTT, sex difference, selected single-nucleotide polymorphisms (SNPs), and microbiota (Table 2). Across all individual parameters, the lowest cumulative values were found for the cholic acid-conjugated species TCA and GCA with 37 and 43% of total variation explained, whereas the highest values were calculated for DCA and its glycine and taurine conjugates with 69, 63, and 64% of variance explained. Up to 50% of total variation could be attributed to the selected SNPs, particularly in case of DCA and its taurine and glycine conjugates. Variants in the gene encoding epoxide hydrolase 1 (EPHX1) were found in 39 subjects, and this gene alone accounted for 14% of variation in DCA concentrations and ~30% of variation in concentrations of its conjugates GDCA and TDCA. Additional individual effects (particularly for unconjugated primary BA) were found for the canalicular
A B
C
Fig. 5. Clustering of volunteers according to postprandial plasma BA kinetics. A: clustering of volunteers based on plasma concentration profiles of bile acids during the MMTT. B: changes in total and different classes of bile acids during the MMTT in participants of the three clusters. Results are expressed as means⫾ SE; n ⫽ 35 in cluster 1, n ⫽ 13 in cluster 2, and n ⫽ 21 in cluster 3. C: summary of differences found among the three clusters for the different bile acid classes as represented in B (Pⱕ 0.05).
multispecific organic anion transporter ABCC3 and the racemase AMACR, which can interconvert BA, as well as for the BA receptor TGR5 encoded by GPBAR1 (variants found in 6 subjects) and for a putative phospholipid-trans-porting ATPase encoded by ATP8B1, which displayed del-eterious variants in 26 volunteers. Given the small size of the study population and the small number of carriers of individual variants, no other attempts were made to associ-ate phenotype and genotypes.
Sex difference was particularly associated with the concen-trations of taurine-conjugated BA. Most of the selected gut bacterial families had only a marginal effect on BA concen-trations, with the exception of Coriobacteriaceae,
Erysipelo-trichaceae, and most notably Peptostreptococcaceae, which
accounted for 12% of variation in CA concentrations. Whereas the family Coriobacteriaceae is known to include bile acid-converting species (46, 62), results pertaining to the
Pepto-streptococcaceae require additional studies.
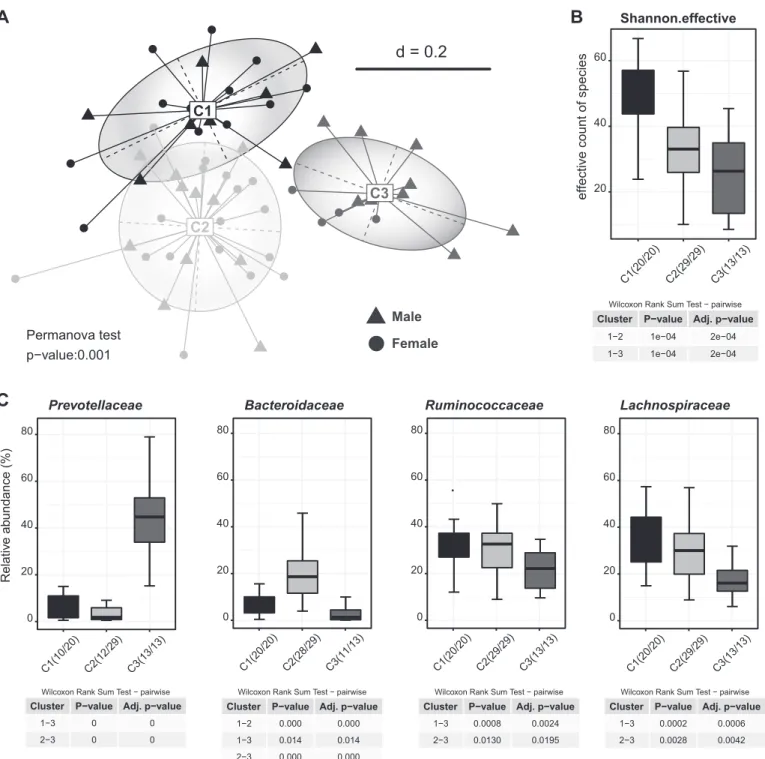
To further assess the possible influence of gut microbiota in a nonsupervised manner, de novo clustering of fecal microbial profiles based on phylogenetic distances revealed the presence of three distinct clusters of individuals (Fig. 7). Each of these clusters was characterized by significant
differences in ␣-diversity and in the relative abundance of
specific taxa (data not shown), but supervised multidimen-sional analysis of BA kinetics parameters on the basis of Table 1. List of selected genes known to be involved in BA synthesis and transport that were screened for
deleterious variations
Protein Name Symbol Gene Symbol Function
Cholesterol 7␣-hydroxylase CYP7A1 CYP7A1 Enzyme
Sterol 27-hydroxylase CYP27A1 CYP27A1 Enzyme
25-hydroxycholesterol 7␣-hydroxylase CYP7B1 CYP7B1 Enzyme
24-hydroxycholesterol 7␣-hydroxylase CYP39A1 CYP39A1 Enzyme
Microsomal 3-hydroxy-⌬5-C27-steroid oxidoreductase HSD3B7 HSD3B7 Enzyme
Microsomal sterol 12␣-hydroxylase CYP8B1 CYP8B1 Enzyme
⌬4-3-oxosteroid 5-reductase AKR1D1 AKR1D1 Enzyme
Acyl-CoA oxidase 1 ACOX1 ACOX1 Enzyme
Acyl-CoA oxidase 2 ACOX2 ACOX2 Enzyme
Bile acid-CoA:amino acid N-acyltransferase BAAT BAAT Enzyme
Bile acid-CoA ligase BAL SLC27A5 Enzyme
␣-Methylacyl-CoA racemase AMACR AMACR Enzyme
D-bifunctional enzyme DBP DBP Enzyme
Peroxisomal thiolase 2 SCP2 SCP2 Enzyme
Aldo-keto reductase family 1 member C4 AKR1C4 AKR1C4 Enzyme
Hydroxysteroid sulfotransferase HST SULT2A1 Enzyme
UDP glucuronosyltransferase family 2 member B4 UGT2B4 UGT2B4 Enzyme
UDP glucuronosyltransferase family 2 member B7 UGT2B7 UGT2B7 Enzyme
UDP glucuronosyltransferase family 1 member A3 UGT1A3 UGT1A3 Enzyme
Solute carrier family 4 member 2 SLC4A2 SLC4A2 Enzyme
Microsomal epoxide hydrolase mEH EPHX1 Enzyme
Cholecystokinin CCK CCK Hormone
Fibroblast growth factor 19 FGF19 FGF19 Hormone
Farnesoid X receptor FXR NR1H4 Nuclear receptor
Small heterodimer partner SHP NR0B2 Nuclear receptor
Liver X receptor LXR NR1H3 Nuclear receptor
Forkhead box A2 HNF-3 FOXA2 Nuclear receptor
Hepatocyte nuclear factor-4␣ HNF-4␣ HNF4A Nuclear receptor
G protein-coupled bile acid receptor 1 GPBAR1 GPBAR1 Receptor
Bile salt export pump BSEP ABCB11 Transporter
Apical sodium-dependent BA transporter ASBT SLC10A2 Transporter
Organic solute transporter-␣ subunit OST␣ SLC51A Transporter
Organic solute transporter- subunit OST SLC51B Transporter
Sodium/taurocholate cotransporting polypeptide NTCP SLC10A1 Transporter
Solute carrier organic anion transporter family member 1A2 OATP1A2 SLCO1A2 Transporter Solute carrier organic anion transporter family member 1B1 OATP1B1 SLCO1B1 Transporter Solute carrier organic anion transporter family member 1B3 OATP1B3 SLCO1B3 Transporter Solute carrier organic anion transporter family member 2B1 OATP2B1 SLCO2B1 Transporter
ATP binding cassette subfamily C member 3 ABCC3 ABCC3 Transporter
ATP binding cassette subfamily A member 1 ABCA1 ABCA1 Transporter
ATP binding cassette subfamily A member 3 ABCA3 ABCA3 Transporter
ATP binding cassette subfamily G member 2 ABCG2 ABCG2 Transporter
ATP binding cassette subfamily G member 5 ABCG5 ABCG5 Transporter
ATP binding cassette subfamily G member 8 ABCG8 ABCG8 Transporter
ATP binding cassette subfamily C member 2 ABCC2 ABCC2 Transporter
ATP binding cassette subfamily B member 1 ABCB1 ABCB1 Transporter
ATP binding cassette subfamily B member 4 ABCB4 ABCB4 Transporter
ATPase phospholipid transporting 8B1 ATP8B1 ATP8B1 Transporter
Cytosolic intestinal BA-binding protein IBABP FABP6 Transporter
Genes selected represent hormones, membrane receptors, transcription factors, and enzymes involved in BA synthesis as well as transporters expressed in hepatocytes, bile canaliculi, and intestine.
these microbiota-derived clusters followed by statistical tests on individual BA parameters did not reveal any sig-nificant associations. Likewise, comparison of the fecal microbiota of individuals belonging to the three different BA-specific clusters (Fig. 5) did not show significant dif-ferences in any of the bacterial taxonomic groups identified (data not shown).
DISCUSSION
The high interindividual variability of plasma BA levels and composition in the fasting and postprandial states found in our study confirms previous observations (9, 18, 52). This high variability has intrinsic and extrinsic origins. BA synthesis rate, intestinal absorption, and hepatic processing, as well as bacte-rial metabolism, are just a few factors that may contribute to the variability. In addition, acute and chronic effects of diet or drug use and also diurnal variation (14, 18) are known to affect the BA pool. Given the fact that dozens of proteins are involved in BA synthesis and handling in the mammalian system, it can be anticipated that there are also numerous underlying genetic factors. Nies et al. attributed the high interindividual variability specifically to differences in the
expression of transporters involved in hepatic BA transport such as OATP1B1, OATP1B3, and OATP2B1 (42). Although no systematic study has explored SNPs or haplotypes in rela-tion to postprandial plasma BA profiles, a recent study identi-fied epistatic effects in primary BA biosynthesis by employing an empirical Bayesian Lasso approach for analysis of pathway-based genome-wide association study data (25).
On the basis of blood sampling, up to 4 (OGTT) or even 8 h postprandially in the case of MMTT, distinct kinetic profiles of individual BA species were observed. Maximal increases in plasma levels exceeding fasting concentrations up to 4.6-fold for taurine- as well as glycine-conjugated BA were found at 30 min in the OGTT with sustained levels for over 2 h. These changes match well with those reported previously by others (49),(65). In a study with 73 young volunteers (26⫾ 4 yr old), Matysik et al. demonstrated a rise in glycine- and taurine-conjugated BA with a peak at 60 min after glucose ingestion, although there was no blood sampling at earlier time points (40). Interestingly, Zhao et al. reported a biphasic increase in plasma BA, with the first peak at 30 min and a second peak at 120 min (65). Although the mean plasma levels in our study did not reveal a biphasic behavior, some volunteers clearly Table 2. Effect of different parameters identified by multivariate analyses as responsible for the observed variation in the
most abundant bile acids in plasma in the postprandial state
n CA CDCA DCA GCA GCDCA GDCA TCA TCDCA TDCA
Time 2* 6* 4* 14* 21* 10* 5* 13* 7*
Sex 1 1 0 0 1 1 3* 5* 4*
Genetically explained variation 39 38 54 23 18 50 25 24 50
Microbiome-explained variation 21 10 11 6 8 2 4 6 3 CYP27A1 4 0 0 0 0 0 0 0 0 0 CYP39A1 24 3 2 0 1 1 0 0 0 0 HSD3B7 4 1 2 0 0 0 1 3* 2 0 SLC10A2 4 5* 3 3 0 0 0 1 3 2* SLCO1A2 9 1 0 0 3 0 1 2* 1 0 SLCO1B1 30 1 0 3 0 0 3 1 0 1 SLCO1B3 24 3 2 1 2 2 2 3 2 3 ABCC3 63 9 4 6 1 0 2 1 2 2 ABCA3 4 0 0 2 1 2 3 0 0 2 ABCG5 10 0 0 2 0 0 0 0 1 1 ABCG8 6 2 0 2 1 0 3 0 0 2 ABCC2 8 0 0 4 1 0 1 1 0 1 AMACR 63 2 4 8 3 3 2 6 4 3 GPBAR1 6 6* 6 2 1 2 0 1 2 1 EPHX1 39 2 3 14* 2 3 29* 0 2 31* UGT2B4 49 1 3 1 3 0 1 2 1 1 ATP8B1 26 3 8 1 4 3 1 4* 2 0 NR0B2 10 0 1 5 0 2 1 0 2 0 Acidaminococcaceae 0 2 2 1 1 0 0 1 0 Alcaligenaceae 0 0 1 0 0 0 0 0 0 Bacteroidaceae 0 1 2 1 2 0 0 0 1 Bifidobacteriaceae 0 0 1 1 1 0 1 0 0 Christensenellaceae 0 0 0 0 0 0 1 1 0 Coriobacteriaceae 0 1 2 0 4 0 0 4* 0 Erysipelotrichaceae 5* 2 0 0 0 0 0 0 0 Lachnospiraceae 1 0 1 0 0 0 0 0 0 Peptostreptococcaceae 12* 3 0 1 0 0 0 0 0 Porphyromonadaceae 2 0 0 0 0 0 0 0 0 Prevotellaceae 0 0 1 0 0 0 0 0 0 Rikenellaceae 0 0 0 1 0 0 2 0 0 Ruminococcaceae 0 1 0 1 0 1 0 0 1 Veillonellaceae 1 0 1 0 0 1 0 0 1
Total explained variation 63 55 69 43 48 63 37 48 64
Values are proportions of variation (in percent) in each BA explained by the corresponding variable; n, number of subjects carrying variations in the respective gene. *P⬍ 0.05, significant associations.
presented two distinct peaks in BA profiles. The fast appear-ance of the BA in blood during the OGTT, which in essence can be superimposed onto the rise in blood glucose levels (Fig. 6, C and F), suggests a very rapid uptake of BA in the upper small intestine. Absorption in the duodenum and jejunum is generally not considered as relevant and is postulated to occur by passive diffusion of protonated BA species (13, 54). The main site of BA reuptake and delivery into portal circulation is
thought to be the ileum with apical influx via the Na⫹
-dependent SLC10A2 (ASBT) transporter. Our results, however, strongly argue for absorption of a considerable quantity of BA already in duodenum and jejunum. This applies to the conju-gated BA, since maximal plasma concentrations were observed here at 30 min in response to the OGTT and at 60 min in response to the MMTT, when the majority of ingested nutrients would not even have reached the ileum (Fig. 3).
The presence of glucose in the intestinal lumen is known to elicit a cholecystokinin (CCK) secretion (37) followed by gallbladder contraction. A rise in plasma BA levels in response to the OGTT is thus per se not surprising. Since BA are not required for glucose absorption, BA secretion may therefore be taken as an archaic evolutionary response with glucose sensing as a surrogate for ingested food. CCK secretion is far stronger in response to a mixed meal and was shown to increase in proportion to the lipid content of the meal (37, 50). Increasing CCK output translates into differences in gallbladder emptying and corresponding plasma BA changes (50, 51). Although we did not determine CCK levels and gallbladder ejection fraction, it is very reasonable to assume that the responses to the OGTT and MMTT in our volunteers were very similar to those described in other studies (44). Conjugated BA are the most abundant in bile (3, 47), and consequently, the postprandial
plasma changes of these BA compared with the other species were much more pronounced. Concentrations of unconjugated BA only mildly increased in a small subset of subjects after 6 h in response to the MMTT.
It was previously reported that the increase in plasma levels of conjugated BA in response to OGTT and oral lipid tolerance tests is higher in women than in men (23, 48), whereas no differences are reported in most studies for the fasting state (9, 19, 63). Also, in mice, effects of sex difference in the BA pool were observed, and those were related to different expression levels of BA biosynthetic enzymes (17, 55). Although all women enrolled in our study were postmenopausal, significant differences in postprandial levels of conjugated BA were still detectable between men and women, particularly for taurine-conjugated BA during the OGTT, but also during the MMTT. Bile acids quantified in systemic circulation are basically the spillover of a noncomplete hepatic extraction of BA in first pass (6, 24). Their concentration in peripheral blood is thus the result of a series of connected processes with secretion from the gallbladder into intestine and transit and absorption across apical and basolateral membranes of enterocytes into portal blood followed by hepatic uptake and biliary secretion. Vari-ability in individual components within this sequence of events will eventually define the shape of the temporal plasma BA profile following a meal. We could group our volunteers on the basis of the postprandial kinetic profiles into three main clus-ters with different velocities in plasma appearance and absolute concentrations of BA.
It can be expected that these differences in plasma BA profiles in response to dietary challenges lead to alterations in physiological processes sensitive to BA. It is known that GLP-1 (8a, 22, 27) and insulin (1) secretion as well as substrate
A B C
D E F
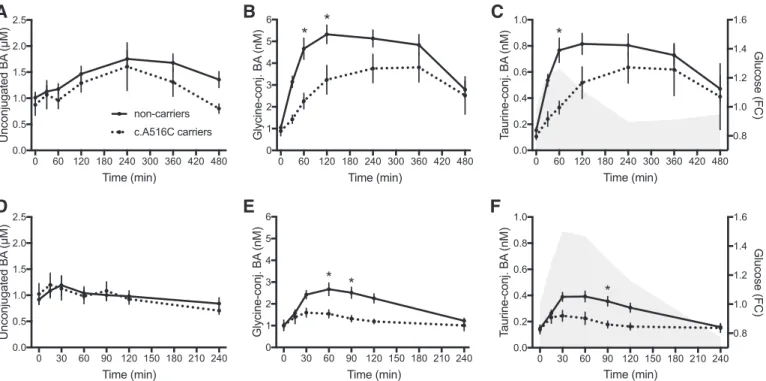
Fig. 6. Effects of the functional polymorphism A516C in SLCO1A2 (OATP1A2) on plasma BA kinetics. A–C: plasma concentrations of bile acids in A516C carriers (dotted lines, n⫽ 9) and noncarriers (solid lines, n ⫽ 62) during the MMTT. D–F: plasma concentrations of bile acids in A516C carriers and noncarriers during the OGTT. Results are means⫾ SE of BA levels averaging the results of challenges performed before and after the weight loss intervention. *Statistical differences (multiple t-tests). The gray areas in C and F represent the profiles of glucose during the MMTT and OGTT, respectively. FC, fold change.
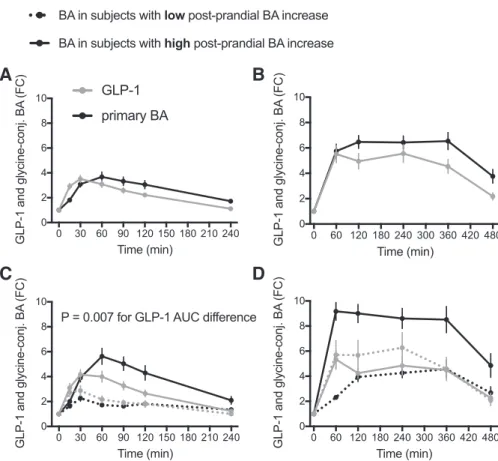
oxidation (demonstrated in rodents) are subject to regulation by BA. Indeed, we observed an association of postprandial total plasma BA and GLP-1 concentrations during the OGTT (Fig. 8). When volunteers were clustered according to the increase in plasma levels of glycine-conjugated BA during the first hour of the OGTT, significant differences between the high and low responders were observed for circulating GLP-1 levels. This suggests that the rise in GLP-1 initiated by glucose adminis-tration may be modulated by BA released into the intestine by
circulating BA reaching enteroendocrine cells (Fig. 8C). The effect was most prominent for glycine-conjugated BA as the responsive BA category that also has the highest circulating concentrations. This relationship between BA secretion and corresponding GLP-1 levels was, however ,not observed in the MMTT (Fig. 8D). The MMTT drink also contained lipids and proteins that can also promote GLP-1 secretion, resulting in twofold-higher plasma GLP-1 and BA levels compared with the OGTT. Lipids and proteins seem to promote a stronger
A
d = 0.2 Permanova test p−value:0.001● ●
●
●
●
●
●
●
●
●
●
●
●
●
●
●
●
●
●
●
●
●
●
●
●
●
●
●
●
●
●
●
●
●
C1 C2●
Male Female 0 20 40 60 80 0 20 40 60 80 0 20 40 60 80 C1(20/20) C2(28/29) C3(11/13) Bacteroidaceae Cluster 1−2 P−value 1−3 Adj. p−value 2−3 0.000 0.014 0.000 0.000 0.014 0.000Wilcoxon Rank Sum Test − pairwise
C1(20/20) C2(29/29) C3(13/13) Lachnospiraceae Cluster 1−3 P−value 2−3 Adj. p−value 0.0002 0.0028 0.0006 0.0042
Wilcoxon Rank Sum Test − pairwise 0 20 40 60 80 C1(10/20) C2(12/29) C3(13/13) Relativ e ab undance (%) Prevotellaceae Cluster 1−3 P−value 2−3 Adj. p−value 0 0 0 0
Wilcoxon Rank Sum Test − pairwise
C1(20/20) C2(29/29) C3(13/13) Ruminococcaceae Cluster 1−3 P−value 2−3 Adj. p−value 0.0008 0.0130 0.0024 0.0195
Wilcoxon Rank Sum Test − pairwise ●
20 40 60
C1(20/20) C2(29/29) C3(13/13)
effective count of species
Shannon.effective Cluster 1−2 P−value 1−3 Adj. p−value 1e−04 1e−04 2e−04 2e−04
Wilcoxon Rank Sum Test − pairwise
B
C3
C
Fig. 7. De novo clustering analysis of fecal microbiota profiles as obtained by high-throughput sequencing of 16S rRNA gene amplicons. Partitioning Around Medoids was performed as described previously. The clustering with best support was visualized with a nonmetric multidimensional-scaling plot (A). Associated changes in␣-diversity (B) and differential abundances of taxonomic groups among the clusters (C) were tested statistically in the R programming environment using Rhea.
GLP-1 output that may overrule the BA modulatory effects on GLP-1 secretion during the MMTT.
One of the most important outcomes of the present study is that genetic variants in the BA transporter OATP1A2 are associated with differences in postprandial BA kinetics, but not the overnight-fasting plasma BA levels. Carriers of the non-synonymous SNP (c.A516C, p.E172D) in the SLCO1A2 gene displayed significantly lower plasma BA concentrations in response to the OGTT and during the first hours of the MMTT, indicating reduced and delayed absorption of BA from intes-tine. Since OATP1A2 is expressed in the duodenum (4, 20), it is the candidate transporter that could mediate the early phase of BA absorption leading to rapid changes in plasma BA levels as observed in response to the OGTT in which peak BA levels can be superimposed on glucose peaks. The A516C variant of
SLCO1A2 was demonstrated to markedly reduce the transport
capacity for different substrates when expressed heterolo-gously (8, 34) although this has not been shown for BA as substrates. Postprandial concentrations of unconjugated BA, which are thought to be taken up into enterocytes via diffusion (not depending on transporters), were not affected in volun-teers with the A516C variant, corroborating the importance of this transporter for duodenal BA transport. Although BA con-centrations could not be measured in portal blood in the present study, BA in systemic circulation are considered as a surrogate of enterohepatic circulation (5), corroborating our hypothesis of a slower intestinal BA uptake in carriers of the deleterious variation in SLCO1A2.
Taken together, our study describes different BA kinetics following an OGTT and a MMTT and identified key determi-nants underlying the large interindividual variability in post-prandial BA profiles. The different patterns of postpost-prandial BA responses, associated with fasting concentrations of BA, al-lowed the classification of the 72 subjects into the 3 major clusters or “metabotypes.” The finding that heterogeneity in 60 preselected genes of BA synthesis and transport explained most of the BA variance argues for these metabotypes as mainly genetically determined and not too much dependent on gut microbiota structure as measured by amplicon sequencing in spite of the known involvement of specific bacterial species in bile acid metabolism in the intestine. Finally, the present study is the first to demonstrate an association between a common genetic variant in the OATP1A2 transporter and postprandial BA kinetics, despite the absence of any effects in the fasting state. Understanding the metabolism of BA in the postprandial state is essential to better understand their roles in human physiology.
ACKNOWLEDGMENTS
We are thankful to all study participants and all members of the NutriTech consortium. The excellent technical work of Alexander Haag, Ronny Scheun-del, and Barbara Gelhaus is highly appreciated.
GRANTS
We are thankful for the funding received through the European Union 7th Framework Programme. The microbiota analysis was funded by The Nether-lands Organisation for Applied Scientific Research Systems Biology program.
A B
C D
Fig. 8. Relationship between plasma bile acids andGLP-1 concentrations in the postprandial state. A and B: plasma concentrations of glycine-conjugated BA (black lines) and GLP-1 (gray lines) in response to the OGTT (A) and MMTT (B; n⫽ 72). C and D: plasma concentration of glycine-conjugated BA (black lines) and GLP-1 (gray lines). Subjects were ranked according to postprandial increase of gly-cine-conjugated BA concentrations during the first hour of the OGTT (C) and MMTT (D; n⫽ 36 in each group). Results are expressed as means⫾ SE of BA fold change from t⫽ 0.
DISCLOSURES
No conflicts of interest, financial or otherwise, are declared by the authors.
AUTHOR CONTRIBUTIONS
S.W., G.F., B.v.O., A.I.B., and H.D. conceived and designed research; J.F., A.M.Y., M.R., S.I.A., and G.R. performed experiments; J.F., A.M.Y., K.G., S.I.A., G.R., T.J.v.d.B., T.C., and I.L. analyzed data; J.F., A.M.Y., T.C., and H.D. interpreted results of experiments; J.F., K.G., T.J.v.d.B., and I.L. pre-pared figures; J.F. and A.M.Y. drafted manuscript; J.F., K.G., M.R., G.R., T.J.v.d.B., T.C., S.W., G.F., B.v.O., and H.D. edited and revised manuscript; J.F., A.M.Y., K.G., M.R., S.I.A., G.R., T.J.v.d.B., T.C., I.L., S.W., G.F., B.v.O., A.I.B., and H.D. approved final version of manuscript.
REFERENCES
1. Adrian TE, Gariballa S, Parekh KA, Thomas SA, Saadi H, Al Kaabi
J, Nagelkerke N, Gedulin B, Young AA. Rectal taurocholate increases L
cell and insulin secretion, and decreases blood glucose and food intake in obese type 2 diabetic volunteers. Diabetologia 55: 2343–2347, 2012. doi:10.1007/s00125-012-2593-2.
2. Adzhubei I, Jordan DM, Sunyaev SR. Predicting functional effect of human missense mutations using PolyPhen-2. Curr Protoc Hum Genet 7: 7.20, 2013. doi:10.1002/0471142905.hg0720s76.
3. Alnouti Y, Csanaky IL, Klaassen CD. Quantitative-profiling of bile acids and their conjugates in mouse liver, bile, plasma, and urine using LC-MS/MS. J Chromatogr B Analyt Technol Biomed Life Sci 873: 209 –217, 2008. doi:10.1016/j.jchromb.2008.08.018.
4. Amelsberg A, Jochims C, Richter CP, Nitsche R, Fölsch UR. Evidence for an anion exchange mechanism for uptake of conjugated bile acid from the rat jejunum. Am J Physiol Gastrointest Liver Physiol 276: G737– G742, 1999.
5. Angelin B, Björkhem I, Einarsson K, Ewerth S. Hepatic uptake of bile acids in man. Fasting and postprandial concentrations of individual bile acids in portal venous and systemic blood serum. J Clin Invest 70: 724 –731, 1982. doi:10.1172/JCI110668.
6. Angelin B, Einarsson K, Hellström K. Evidence for the absorption of bile acids in the proximal small intestine of normo- and hyperlipidaemic subjects. Gut 17: 420 –425, 1976. doi:10.1136/gut.17.6.420.
7. Arumugam M, Raes J, Pelletier E, Le Paslier D, Yamada T, Mende
DR, Fernandes GR, Tap J, Bruls T, Batto J-M, Bertalan M, Borruel N, Casellas F, Fernandez L, Gautier L, Hansen T, Hattori M, Hayashi T, Kleerebezem M, Kurokawa K, Leclerc M, Levenez F, Manichanh C, Nielsen HB, Nielsen T, Pons N, Poulain J, Qin J, Sicheritz-Ponten T, Tims S, Torrents D, Ugarte E, Zoetendal EG, Wang J, Guarner F, Pedersen O, de Vos WM, Brunak S, Doré J, Antolín M, Artiguenave F, Blottiere HM, Almeida M, Brechot C, Cara C, Chervaux C, Cultrone A, Delorme C, Denariaz G, Dervyn R, Foerstner KU, Friss C, van de Guchte M, Guedon E, Haimet F, Huber W, van Hylckama-Vlieg J, Jamet A, Juste C, Kaci G, Knol J, Lakhdari O, Layec S, Le Roux K, Maguin E, Mérieux A, Melo Minardi R, M’rini C, Muller J, Oozeer R, Parkhill J, Renault P, Rescigno M, Sanchez N, Sunagawa S, Torrejon A, Turner K, Vandemeulebrouck G, Varela E, Winogradsky Y, Zeller G, Weissenbach J, Ehrlich SD, Bork P; MetaHIT Consor-tium. Enterotypes of the human gut microbiome. Nature 473: 174 –180,
2011. doi:10.1038/nature09944.
8. Badagnani I, Castro RA, Taylor TR, Brett CM, Huang CC, Stryke D,
Kawamoto M, Johns SJ, Ferrin TE, Carlson EJ, Burchard EG, Giacomini KM. Interaction of methotrexate with organic-anion
transport-ing polypeptide 1A2 and its genetic variants. J Pharmacol Exp Ther 318: 521–529, 2006. doi:10.1124/jpet.106.104364.
8a.Bala V, Rajagopal S, Kumar DP, Nalli AD, Mahavadi S, Sanyal AJ,
Grider JR, Murthy KS. Release of GLP-1 and PYY in response to the
activation of G protein-coupled bile acid receptor TGR5 is mediated by Epac/PLC-ε pathway and modulated by endogenous H2S. Front Physiol 5: 420, 2014. doi:10.3389/fphys.2014.00420.
9. Bathena SPR, Thakare R, Gautam N, Mukherjee S, Olivera M, Meza
J, Alnouti Y. Urinary bile acids as biomarkers for liver diseases I.
Stability of the baseline profile in healthy subjects. Toxicol Sci 143: 296 –307, 2015. doi:10.1093/toxsci/kfu227.
10. Bronger H, König J, Kopplow K, Steiner H-H, Ahmadi R,
Herold-Mende C, Keppler D, Nies AT. ABCC drug efflux pumps and organic
anion uptake transporters in human gliomas and the blood-tumor barrier.
Cancer Res 65: 11419 –11428, 2005. doi: 10.1158/0008-5472.CAN-05-1271.
11. Caporaso JG, Lauber CL, Walters WA, Berg-Lyons D, Huntley J,
Fierer N, Owens SM, Betley J, Fraser L, Bauer M, Gormley N, Gilbert JA, Smith G, Knight R. Ultra-high-throughput microbial community
analysis on the Illumina HiSeq and MiSeq platforms. ISME J 6: 1621– 1624, 2012. doi:10.1038/ismej.2012.8.
12. Chen J, Bittinger K, Charlson ES, Hoffmann C, Lewis J, Wu GD,
Collman RG, Bushman FD, Li H. Associating microbiome composition
with environmental covariates using generalized UniFrac distances.
Bioin-formatics 28: 2106 –2113, 2012. doi:10.1093/bioinformatics/bts342. 13. Dawson PA, Lan T, Rao A. Bile acid transporters. J Lipid Res 50:
2340 –2357, 2009. doi:10.1194/jlr.R900012-JLR200.
14. Duane WC, Levitt DG, Mueller SM, Behrens JC. Regulation of bile acid synthesis in man. Presence of a diurnal rhythm. J Clin Invest 72: 1930 –1936, 1983. doi:10.1172/JCI111157.
15. Edgar RC, Haas BJ, Clemente JC, Quince C, Knight R. UCHIME improves sensitivity and speed of chimera detection. Bioinformatics 27: 2194 –2200, 2011. doi:10.1093/bioinformatics/btr381.
16. Edgar RC. UPARSE: highly accurate OTU sequences from microbial amplicon reads. Nat Methods 10: 996 –998, 2013. doi:10.1038/nmeth. 2604.
17. Fu ZD, Csanaky IL, Klaassen CD. Gender-divergent profile of bile acid homeostasis during aging of mice. PLoS One 7: e32551, 2012. doi:10. 1371/journal.pone.0032551.
18. Gälman C, Angelin B, Rudling M. Bile acid synthesis in humans has a rapid diurnal variation that is asynchronous with cholesterol synthesis.
Gastroenterology 129: 1445–1453, 2005. doi:10.1053/j.gastro.2005.09. 009.
19. Gälman C, Angelin B, Rudling M. Pronounced variation in bile acid synthesis in humans is related to gender, hypertriglyceridaemia and circulating levels of fibroblast growth factor 19. J Intern Med 270: 580 –588, 2011. doi:10.1111/j.1365-2796.2011.02466.x.
20. Glaeser H, Bailey DG, Dresser GK, Gregor JC, Schwarz UI, McGrath
JS, Jolicoeur E, Lee W, Leake BF, Tirona RG, Kim RB. Intestinal drug
transporter expression and the impact of grapefruit juice in humans. Clin
Pharmacol Ther 81: 362–370, 2007. doi:10.1038/sj.clpt.6100056. 21. Hagenbuch B, Stieger B. The SLCO (former SLC21) superfamily of
transporters. Mol Aspects Med 34: 396 –412, 2013. doi:10.1016/j.mam. 2012.10.009.
22. Hansen M, Scheltema MJ, Sonne DP, Hansen JS, Sperling M, Rehfeld
JF, Holst JJ, Vilsbøll T, Knop FK. Effect of chenodeoxycholic acid and
the bile acid sequestrant colesevelam on glucagon-like peptide-1 secretion.
Diabetes Obes Metab 18: 571–580, 2016. doi:10.1111/dom.12648. 23. Ho JE, Larson MG, Vasan RS, Ghorbani A, Cheng S, Rhee EP, Florez
JC, Clish CB, Gerszten RE, Wang TJ. Metabolite profiles during oral
glucose challenge. Diabetes 62: 2689 –2698, 2013. doi:10.2337/db12-0754.
24. Houten SM, Watanabe M, Auwerx J. Endocrine functions of bile acids.
EMBO J 25: 1419 –1425, 2006. doi:10.1038/sj.emboj.7601049. 25. Huang A, Martin ER, Vance JM, Cai X. Detecting genetic interactions
in pathway-based genome-wide association studies. Genet Epidemiol 38: 300 –309, 2014. doi:10.1002/gepi.21803.
26. Jost L. Partitioning diversity into independent alpha and beta components.
Ecology 88: 2427–2439, 2007. doi:10.1890/06-1736.1.
27. Katsuma S, Hirasawa A, Tsujimoto G. Bile acids promote glucagon-like peptide-1 secretion through TGR5 in a murine enteroendocrine cell line STC-1. Biochem Biophys Res Commun 329: 386 –390, 2005. doi:10.1016/ j.bbrc.2005.01.139.
28. Kawamata Y, Fujii R, Hosoya M, Harada M, Yoshida H, Miwa M,
Fukusumi S, Habata Y, Itoh T, Shintani Y, Hinuma S, Fujisawa Y, Fujino M. A G protein-coupled receptor responsive to bile acids. J Biol Chem 278: 9435–9440, 2003. doi:10.1074/jbc.M209706200.
29. Kelder T, Stroeve JHM, Bijlsma S, Radonjic M, Roeselers G. Corre-lation network analysis reveals reCorre-lationships between diet-induced changes in human gut microbiota and metabolic health. Nutr Diabetes 4: e122, 2014. doi:10.1038/nutd.2014.18.
30. Kreymann B, Williams G, Ghatei MA, Bloom SR. Glucagon-like peptide-1 7-36: a physiological incretin in man. Lancet 2: 1300 –1304, 1987. doi:10.1016/S0140-6736(87)91194-9.
31. Kumar P, Henikoff S, Ng PC. Predicting the effects of coding non-synonymous variants on protein function using the SIFT algorithm. Nat
Protoc 4: 1073–1081, 2009. doi:10.1038/nprot.2009.86.
32. Lagkouvardos I, Fischer S, Kumar N, Clavel T. Rhea: a transparent and modular R pipeline for microbial profiling based on 16S rRNA gene amplicons. PeerJ 5: e2836, 2017. doi:10.7717/peerj.2836.
33. Lagkouvardos I, Kläring K, Heinzmann SS, Platz S, Scholz B, Engel
K-H, Schmitt-Kopplin P, Haller D, Rohn S, Skurk T, Clavel T. Gut
metabolites and bacterial community networks during a pilot intervention study with flaxseeds in healthy adult men. Mol Nutr Food Res 59: 1614 –1628, 2015. doi:10.1002/mnfr.201500125.
34. Lee W, Glaeser H, Smith LH, Roberts RL, Moeckel GW, Gervasini G,
Leake BF, Kim RB. Polymorphisms in human organic anion-transporting
polypeptide 1A2 (OATP1A2): implications for altered drug disposition and central nervous system drug entry. J Biol Chem 280: 9610 –9617, 2005. doi:10.1074/jbc.M411092200.
35. Lefebvre P, Cariou B, Lien F, Kuipers F, Staels B. Role of bile acids and bile acid receptors in metabolic regulation. Physiol Rev 89: 147–191, 2009. doi:10.1152/physrev.00010.2008.
36. Li H, Durbin R. Fast and accurate long-read alignment with Burrows-Wheeler transform. Bioinformatics 26: 589 –595, 2010. doi:10.1093/ bioinformatics/btp698.
37. Liddle RA, Goldfine ID, Rosen MS, Taplitz RA, Williams JA. Chole-cystokinin bioactivity in human plasma. Molecular forms, responses to feeding, and relationship to gallbladder contraction. J Clin Invest 75: 1144 –1152, 1985. doi:10.1172/JCI111809.
38. Ma K, Saha PK, Chan L, Moore DD. Farnesoid X receptor is essential for normal glucose homeostasis. J Clin Invest 116: 1102–1109, 2006. doi:10.1172/JCI25604.
39. Maruyama T, Miyamoto Y, Nakamura T, Tamai Y, Okada H,
Sugiyama E, Nakamura T, Itadani H, Tanaka K. Identification of
membrane-type receptor for bile acids (M-BAR). Biochem Biophys Res
Commun 298: 714 –719, 2002. doi:10.1016/S0006-291X(02)02550-0. 40. Matysik S, Martin J, Bala M, Scherer M, Schäffler A, Schmitz G. Bile
acid signaling after an oral glucose tolerance test. Chem Phys Lipids 164: 525–529, 2011. doi:10.1016/j.chemphyslip.2011.05.003.
41. McKenna A, Hanna M, Banks E, Sivachenko A, Cibulskis K,
Kerny-tsky A, Garimella K, Altshuler D, Gabriel S, Daly M, DePristo MA.
The Genome Analysis Toolkit: a MapReduce framework for analyzing next-generation DNA sequencing data. Genome Res 20: 1297–1303, 2010. doi:10.1101/gr.107524.110.
42. Nies AT, Niemi M, Burk O, Winter S, Zanger UM, Stieger B, Schwab
M, Schaeffeler E. Genetics is a major determinant of expression of the
human hepatic uptake transporter OATP1B1, but not of OATP1B3 and OATP2B1. Genome Med 5: 1, 2013. doi:10.1186/gm405.
43. Parks DJ, Blanchard SG, Bledsoe RK, Chandra G, Consler TG,
Kliewer SA, Stimmel JB, Willson TM, Zavacki AM, Moore DD, Lehmann JM. Bile acids: natural ligands for an orphan nuclear receptor. Science 284: 1365–1368, 1999. doi:10.1126/science.284.5418.1365. 44. Popescu IR, Helleboid-Chapman A, Lucas A, Vandewalle B, Dumont
J, Bouchaert E, Derudas B, Kerr-Conte J, Caron S, Pattou F, Staels B. The nuclear receptor FXR is expressed in pancreatic beta-cells and
protects human islets from lipotoxicity. FEBS Lett 584: 2845–2851, 2010. doi:10.1016/j.febslet.2010.04.068.
45. Renga B, Mencarelli A, Vavassori P, Brancaleone V, Fiorucci S. The bile acid sensor FXR regulates insulin transcription and secretion. Biochim
Biophys Acta 1802: 363–372, 2010. doi:10.1016/j.bbadis.2010.01.002. 46. Ridlon JM, Kang D-J, Hylemon PB. Bile salt biotransformations by
human intestinal bacteria. J Lipid Res 47: 241–259, 2006. doi:10.1194/ jlr.R500013-JLR200.
47. Rossi SS, Converse JL, Hofmann AF. High pressure liquid chromato-graphic analysis of conjugated bile acids in human bile: simultaneous resolution of sulfated and unsulfated lithocholyl amidates and the common conjugated bile acids. J Lipid Res 28: 589 –595, 1987.
48. Schmid A, Neumann H, Karrasch T, Liebisch G, Schäffler A. Bile acid metabolome after an oral lipid tolerance test by liquid chromatography-tandem mass spectrometry (LC-MS/MS). PLoS One 11: e0148869, 2016. doi:10.1371/journal.pone.0148869.
49. Shaham O, Wei R, Wang TJ, Ricciardi C, Lewis GD, Vasan RS, Carr
SA, Thadhani R, Gerszten RE, Mootha VK. Metabolic profiling of the
human response to a glucose challenge reveals distinct axes of insulin sensitivity. Mol Syst Biol 4: 214, 2008. doi:10.1038/msb.2008.50.
50. Sonne DP, Rehfeld JF, Holst JJ, Vilsbøll T, Knop FK. Postprandial gallbladder emptying in patients with type 2 diabetes: potential implica-tions for bile-induced secretion of glucagon-like peptide 1. Eur J
Endo-crinol 171: 407–419, 2014. doi:10.1530/EJE-14-0309.
51. Sonne DP, van Nierop FS, Kulik W, Soeters MR, Vilsbøll T, Knop FK. Postprandial plasma concentrations of individual bile acids and FGF-19 in patients with type 2 diabetes. J Clin Endocrinol Metab 101: 3002–3009, 2016. doi:10.1210/jc.2016-1607.
52. Steiner C, Othman A, Saely CH, Rein P, Drexel H, von Eckardstein A,
Rentsch KM. Bile acid metabolites in serum: intraindividual variation and
associations with coronary heart disease, metabolic syndrome and diabetes mellitus. PLoS One 6: e25006, 2011. doi:10.1371/journal.pone.0025006. 53. Tagliacozzi D, Mozzi AF, Casetta B, Bertucci P, Bernardini S, Di Ilio
C, Urbani A, Federici G. Quantitative analysis of bile acids in human
plasma by liquid chromatography-electrospray tandem mass spectrometry: a simple and rapid one-step method. Clin Chem Lab Med 41: 1633–1641, 2003. doi:10.1515/CCLM.2003.247.
54. Trauner M, Boyer JL. Bile salt transporters: molecular characterization, function, and regulation. Physiol Rev 83: 633–671, 2003. doi:10.1152/ physrev.00027.2002.
55. Turley SD, Schwarz M, Spady DK, Dietschy JM. Gender-related differences in bile acid and sterol metabolism in outbred CD-1 mice fed low- and high-cholesterol diets. Hepatology 28: 1088 –1094, 1998. doi: 10.1002/hep.510280425.
57. Wang H, Chen J, Hollister K, Sowers LC, Forman BM. Endogenous bile acids are ligands for the nuclear receptor FXR/BAR. Mol Cell 3: 543–553, 1999. doi:10.1016/S1097-2765(00)80348-2.
58. Wang K, Li M, Hakonarson H. ANNOVAR: functional annotation of genetic variants from high-throughput sequencing data. Nucleic Acids Res 38: e164, 2010. doi:10.1093/nar/gkq603.
59. Wang Q, Garrity GM, Tiedje JM, Cole JR. Naive Bayesian classifier for rapid assignment of rRNA sequences into the new bacterial taxon-omy. Appl Environ Microbiol 73: 5261–5267, 2007. doi:10.1128/AEM. 00062-07.
60. Watanabe M, Houten SM, Mataki C, Christoffolete MA, Kim BW,
Sato H, Messaddeq N, Harney JW, Ezaki O, Kodama T, Schoonjans K, Bianco AC, Auwerx J. Bile acids induce energy expenditure by
promoting intracellular thyroid hormone activation. Nature 439: 484 –489, 2006. doi:10.1038/nature04330.
61. Watanabe M, Houten SM, Wang L, Moschetta A, Mangelsdorf DJ,
Heyman RA, Moore DD, Auwerx J. Bile acids lower triglyceride levels
via a pathway involving FXR, SHP, and SREBP-1c. J Clin Invest 113: 1408 –1418, 2004. doi:10.1172/JCI21025.
62. Wegner K, Just S, Gau L, Mueller H, Gérard P, Lepage P, Clavel T,
Rohn S. Rapid analysis of bile acids in different biological matrices using
LC-ESI-MS/MS for the investigation of bile acid transformation by mammalian gut bacteria. Anal Bioanal Chem 409: 1231–1245, 2017. doi:10.1007/s00216-016-0048-1.
63. Xiang X, Backman JT, Neuvonen PJ, Niemi M. Gender, but not CYP7A1 or SLCO1B1 polymorphism, affects the fasting plasma concen-trations of bile acids in human beings. Basic Clin Pharmacol Toxicol 110: 245–252, 2012. doi:10.1111/j.1742-7843.2011.00792.x.
64. Yamagata K, Daitoku H, Shimamoto Y, Matsuzaki H, Hirota K,
Ishida J, Fukamizu A. Bile acids regulate gluconeogenic gene expression
via small heterodimer partner-mediated repression of hepatocyte nuclear factor 4 and Foxo1. J Biol Chem 279: 23158 –23165, 2004. doi:10.1074/ jbc.M314322200.
65. Zhao X, Peter A, Fritsche J, Elcnerova M, Fritsche A, Häring HU,
Schleicher ED, Xu G, Lehmann R. Changes of the plasma metabolome
during an oral glucose tolerance test: is there more than glucose to look at?
Am J Physiol Endocrinol Metab 296: E384 –E393, 2009. doi:10.1152/ ajpendo.90748.2008.
66. Zietak M, Kozak LP. Bile acids induce uncoupling protein 1-dependent thermogenesis and stimulate energy expenditure at thermoneutrality in mice. Am J Physiol Endocrinol Metab 310: E346 –E354, 2016. doi:10. 1152/ajpendo.00485.2015.