Publisher’s version / Version de l'éditeur:
Vous avez des questions? Nous pouvons vous aider. Pour communiquer directement avec un auteur, consultez la
première page de la revue dans laquelle son article a été publié afin de trouver ses coordonnées. Si vous n’arrivez pas à les repérer, communiquez avec nous à PublicationsArchive-ArchivesPublications@nrc-cnrc.gc.ca.
Questions? Contact the NRC Publications Archive team at
PublicationsArchive-ArchivesPublications@nrc-cnrc.gc.ca. If you wish to email the authors directly, please see the first page of the publication for their contact information.
https://publications-cnrc.canada.ca/fra/droits
L’accès à ce site Web et l’utilisation de son contenu sont assujettis aux conditions présentées dans le site LISEZ CES CONDITIONS ATTENTIVEMENT AVANT D’UTILISER CE SITE WEB.
Internal Report (National Research Council of Canada. Division of Building Research), 1963-01-01
READ THESE TERMS AND CONDITIONS CAREFULLY BEFORE USING THIS WEBSITE.
https://nrc-publications.canada.ca/eng/copyright
NRC Publications Archive Record / Notice des Archives des publications du CNRC :
https://nrc-publications.canada.ca/eng/view/object/?id=1833d214-06dd-4344-94af-e8ba3a2d694e https://publications-cnrc.canada.ca/fra/voir/objet/?id=1833d214-06dd-4344-94af-e8ba3a2d694e
NRC Publications Archive
Archives des publications du CNRC
For the publisher’s version, please access the DOI link below./ Pour consulter la version de l’éditeur, utilisez le lien DOI ci-dessous.
https://doi.org/10.4224/20386760
Access and use of this website and the material on it are subject to the Terms and Conditions set forth at Snow loads on roofs 1961-62: sixth progress report
NATIONAL RESEAROH OOUNCIL OANADA
DIVISION OF BUILDING RESEAROH
SNOW LOADS ON ROOFS 1961-62 SIXTH PROGRESS REPORT
by
P. A. Hebert and B. G. W. Peter
ANALYZED
Internal Report No. 260 of the
Division of BUilding Research
OTTAWA January 1963
PREFACE
Although snow depths on the ground are relatively well known and have been used widely to estimate roof design loads, the actual loads on roofs are still difficult to
predict. Many buildings have been designed for snow loads
much greater than those which actually occur while others have been under-designed and have therefore been damaged by
heavy drift loads. Roof failures due to snow loads are,
unfortunately, not uncommon.
This variability of, and uncertainty about roof loads have been the main reasons for the extensive investi-gations of snow loads, primarily for the National BUilding
Code, by the Division of Building Research. The Division
has been conducting a countrywide survey of actual roof
loads for the past six winters. Although the information
gathered is not yet sufficient to lead to conclusive reSUlts, definite trends of snow accumulations have been established and on a basis of this some changes have already been made
in the National Building Code. These changes, however, have
not yet refined the snow loads to the degree aimed for by the survey.
This report presents the observations made during the 1961-62 winter and serves as an addition to the five
previous annual reports on snow loads. The Division of
Building Research wishes to express again its appreciation to the many observers whose active participation made the survey of the 1961-62 winter possible, particularly to A-Station observers of the Meteorological Branch of the Department of Transport at Goose Bay and Gander, the Department of National Defence at Fort Churchill, the
Department of Public Works at Revelstoke, Ecole Polytechnique (Montreal), Macdonald College (Ste. Anne de Bellevue), Queen's University (Kingston), University of Toronto, University of Manitoba (Winnipeg), University of Alberta (Edmonton),
University of Waterloo, Aluminum Company of Canada at
Arvida, the Federal Day School at Inuvik, and the Atlantic,
Prairie and B.C. Regional Stations of the Division. Thanks
is also expressed to the bUilding inspectors and individuals who made B-Station observations, and to the RCAF personnel
at the C Stations and their colleagues in Ottawa. Without
all this Willing co-operation, this report could not have been prepared.
This report was prepared by P. A. Hebert, of the University of New Brunswick, a summer worker with the
Building Structures Section, and B. G. W. Peter, Research
Officer with the Section, under the direction of W. R. Schriever. Appendix A which deals with the statistics of the roof to
ground load ratio, was prepared jointly by D. W. Boyd, D.O.T. Meteorologist with DBR/NRC, and P. A. Hebert.
Ottawa
SNOW LOADS ON ROOFS 1961-62 Sixth Progress Report
by
P. A. Hebert and
B.
G. W. PeterThis progress report presents the results of the 1961-62 survey of snow loads on roofs as well as an analysis
of the observations taken during that winter. Unusual
features are analyzed and discussed, and the results are compared with the results of the previous progress reports
(2-1) in order to summarize the 5 years of the survey. Appendix A presents a statistical analysis of the observa-tions of the past 5 years of the survey.
Through the years, engineers and building code authorities in Canada as well as in other countries have
been faced with the problem of choosing an appropriate design
snow load for roofs. Extreme deviations in either direction
will result either in セセ・」・ウウ。イケ construction costs or in
collapse of numerous structures.
Some years ago the design snow load was generally
assumed to be 40 psf practically all across Canada. Although
many of the structures built at that time have withstood the test of time, some failures have occurred in roofs because
of snow loads. Although complete statistics of structural
failures do not exist, the major failures are well indicated by the many newspaper clippings received by the Division every winter.
Some of the factors which influence the magnitude and distribution of the actual roof loads are annual snowfall, the shape of the roof, wind direction and intensity, heat
loss, and daily temperatures. All these factors, acting in
a somewhat complex way, determine the maximum amount of snow which will build up on the roof during a winter and,
consequently, must be considered by the designer, if the accuracy of the load assumption is to be in keeping with the accuracy of structural analysis developed today.
The 1953 National BUilding Code of Canada (9) used the snow load on the ground as the minimum design snow load
for roofs. The snow load on the ground was the maximum
reported ground depth from 1941 to 50 plus the maximum 24-hour rainfall expected in the 2- or 3-month period when
maximum snow depths are likely to occur (8). An assumed
specific gravity of 0.2 was used to determine this. The
assumption that the load on the roof is the same as that on the ground was, however, obviously rather crude.
2
-In 1956, the Associate Committee on the National Building Code asked the Division of Building Research to
study the problem in greater detail. Accordingly, a pilot
survey (1,2) was carried out during the winter of 1956-57; the full-scale survey began in the winter of 1957-58.
Stations were chosen across Canada so that the results would represent as many climatic areas of the country as possible. Direct measurements of snow depth and density were taken on roofs chosen at these different stations.
The prime objective of the survey is to allow a more accurate prediction of snow loads on roofs from snow loads on the ground for the region where the structure is
built. It also is designed to accumulate information on the
different factors affecting this roof load. SURVEY PROCEDURES OF 1961-62 OBSERVATIONS
The survey procedures used this year at A, Band C Stations were similar to those used in previous years (11). In addition, a more intensive survey was carried out in
Ottawa to obtain more information on the effect of the shape of roofs in an area sUbject to the same climatic conditions. In all, reports were received on 90 roofs.
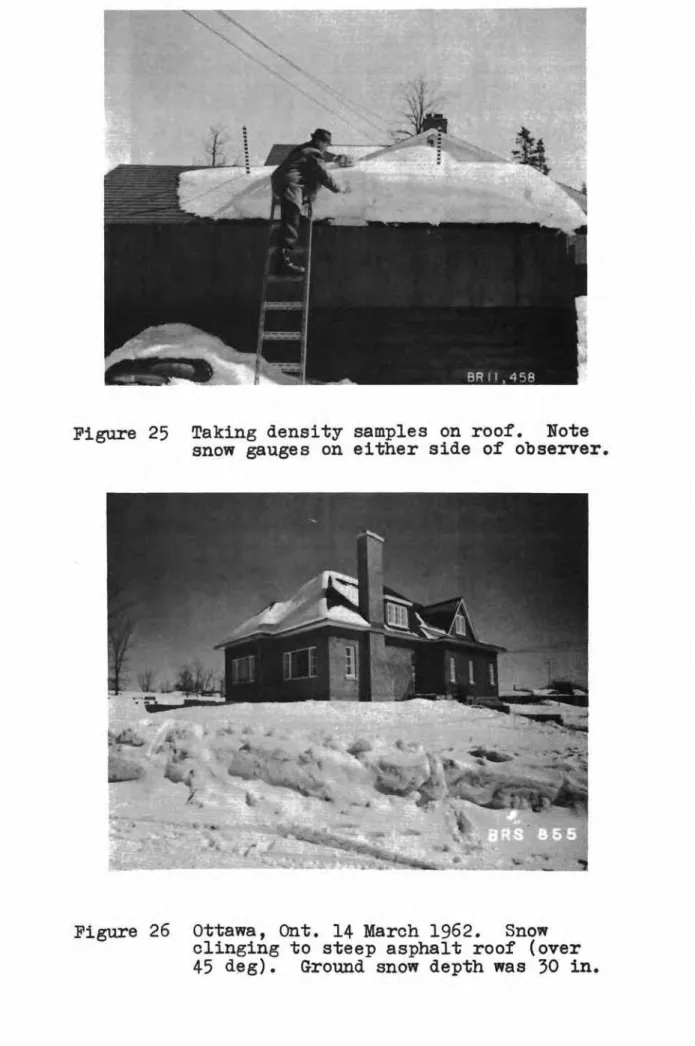
A Stations - Detailed observations of snow depth and density were recorded every week and after every
snow-fall (Figure 25). Depth observations were made of average
snow cover on the ground and at locations on the roofs
indicated by snow depth gauges
(7).
At each station atleast one flat and one gable roof were observed. A total of
45
roofs were observed at the 17 A Stations (Table I).B Stations - Observations at B Stations were taken mainly by bUilding inspectors who assist the Division in
this work on a voluntary basis. These B Stations are
intended to observe cases of unusual snow loads and failures. The observers are asked to take measurements of snow depths only when a snow load occurs that is considered to be large
for the community or causes failure. The Division heard
from 10 B Stations,
6
of which gave details of loads onroofs observed; the remaining 4 had little or no snow during the winter.
C Stations - Observations at these stations are similar to those at A Stations and were carried out by RCAF
personnel on airport bUildings across Canada. The buildings
used were: arch hangars, mechanical equipment garages,
cantilever hangars and unit supply depots, the last two
3
-buildings were all of standard size and shape. Eight C Stations
were observed in Canada reporting on 23 roofs.
Local Survey - This year, a group of houses in the
Ottawa area as well as some flat roofs on the Morrt.reaL Road
NRC buildings were added to the survey. Most of the 17 roofs
selected were observed only twice during the winter. WEATHER
In many parts of Canada the 1961-62 winter deviated considerably from the normal pattern.
The total snowfall for stations west of Toronto was generally higher than normal, except for Inuvik and Vancouver, while central Canada experienced below normal snowfall.
February brought very heavy snowfall to Newfoundland, and a considerable amount to the rest of Canada, except British Columbia.
In December, the Prairie Provinces experienced mean monthly temperatures as much as 16 deg below normal. February brought extremely cold temperatures to most of Canada.
セセjor CHARACTERISTICS OF 1961-62 OBSERVATIONS
About one half of the stations observed had a total
winter snowfall above the normal value. Three of these
(Halifax, Fort Churchill and Revelstoke) experienced high loading conditions on the roofs with maximum roof loads
(drift loads) exceeding the design value
(12).
At Revelstoke,however, the average roof load exceeded the design load. The results of the observations of the winter of 1961-62 confirmed the major conclusions of previous seasons
of the survey in that they showed qualitatively that snow loads are greatly affected by the shape and size of the surroundings as well as by the orientation of the roofs on
which they accumulate. This is particularly well shown by
the observations made at Fort Churchill, Halifax, Gander, Ottawa, Waterloo and Edmonton.
The observed average roof loads ranged from 0 to
80 psi. Revelstoke, in the Rocky Mourrteins, accumulated a
high average load of 80 psi because of its sheltered condition.
The maximum drift load observed was 140 psf, in Ottawa,
measured on a lean-to roo:C adjacent to a Large curved
4
-PRESENTATION OF RESULTS
The results of observations for the winter of 1961-62 are presented in a form similar to those of the
preceding years in order to assure uniformity for future
reference and analysis.
Tables I to IV present relevant information on the A, Band C Stations and the local survey, respectively.
These are supplemented by two maps of Canada (Figures 1 and 2) on which the maximum roof and ground loads of all stations
of A, Band C type are shown as bar graphs. Table V is
provided to compare the roof load/ground load ratio for flat
roofs. Some variations of snow loads as a result of roof
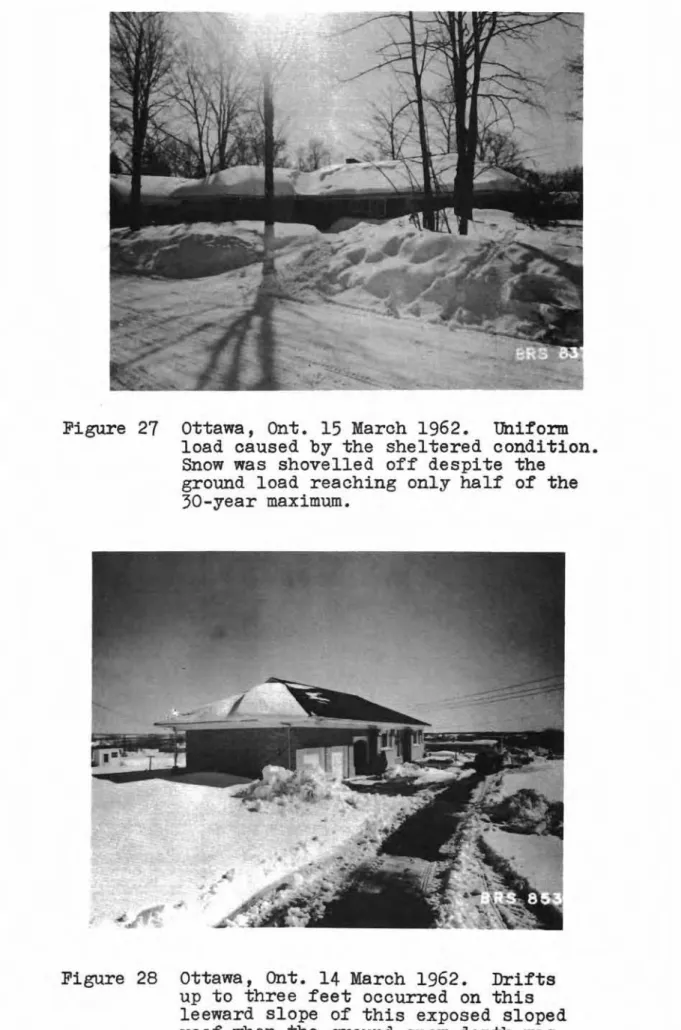
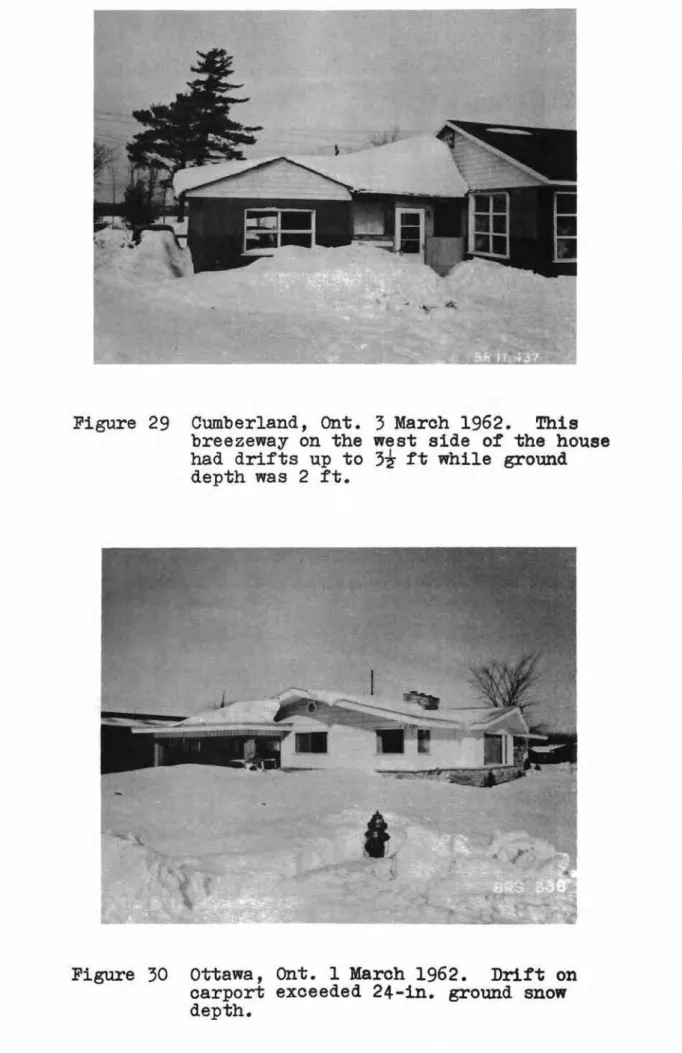
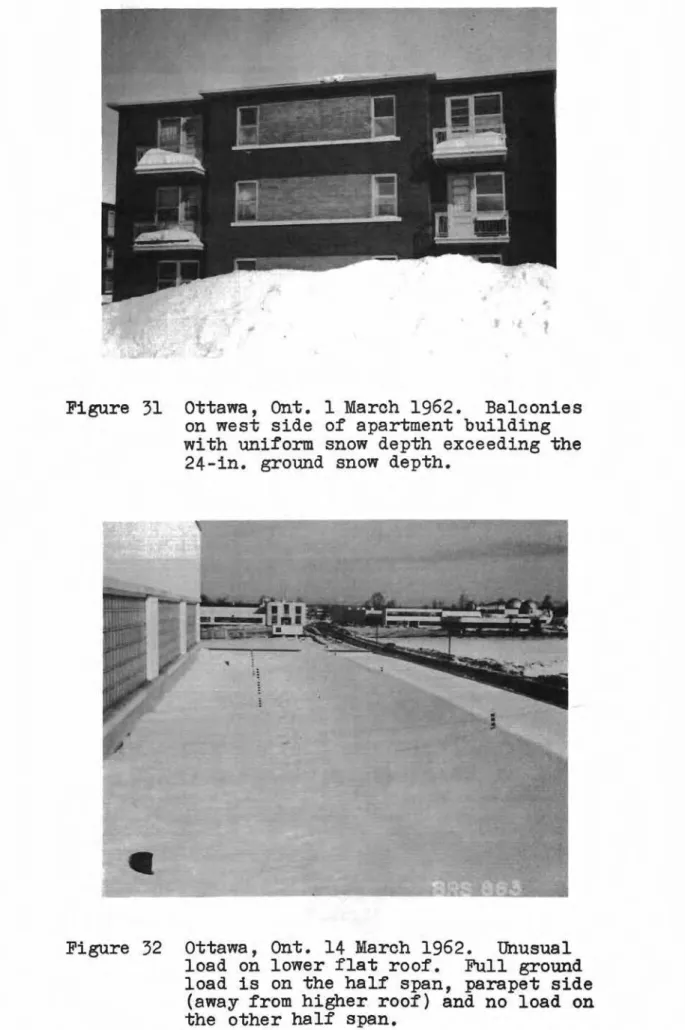
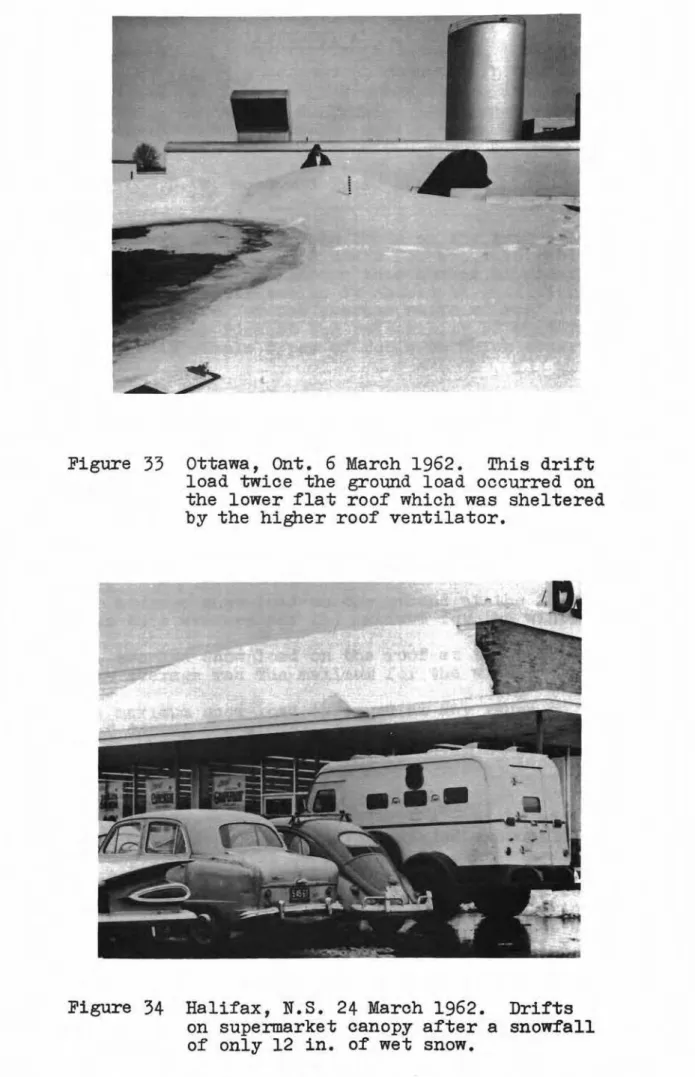
shapes in Ottawa and Halifax are also included Hfゥァオイセウ 26
to
34).
Observations at each station will be discussed.A and C Stations contain greater details of
observation and are analyzed accordingly. Figures
3
to 24describe each roof of the A and C type giving their shape,
size, thermal conditions and surroundings. Graphs are
plotted showing the maximum daily wind speed (mph), daily mean temperatures (OF), and the accumulated snowfall (in.)
thrOUghout the winter. The loading pattern on each roof for
the whole winter is displayed by a graph showing the ground load near the building observed as well as the maximum, average and minimum loads on the roof itself.
RESULTS OF 1961-62 OBSERVATIONS
Although several stations had a rather heavy winter snowfall, only Revelstoke had an average roof load exceeding the 1960 National Building Code minimum design snow load for
roofs. Maximum roof loads (concentration caused by drifts)
exceeding the Code values were observed at Revelstoke, Fort Churchill and Halifax.
All roofs, except one at Fort Churchill, had
average loads less than the ground load. Eight stations,
however, had maximum roof loads exceeding the ground load: Revelstoke, Toronto, Kingston, Ottawa, Waterloo, Ste. Anne de Bellevue, Halifax and Fort Churchill, the last-mentioned
exceeding it by 150 per cent. These relatively high maxima
seem to be caused by factors that differed with stations,
some of which are: low wind speeds during the Winter, well
sheltered roofs, high parapets and extending wall (penthouse,
or high building near the roof observed). These high loads
are further discussed below.
Montreal, Goose Bay, Inuvik and Gander had ground
5
-in each case the average roof load did not exceed 12 psf. These low roof loads may be caused by relatively high winds during the winter, roofs with little shelter in the very near surroundings and no parapet along the flat roofs.
The following is a more detailed discussion of the results of each individual station with regard to any unusual loading pattern or other characteristics observed during the last winter.
A Stations
Vancouver - Snow loads at Vancouver have always been
very low because of the moderate climate. Again this year
snow loads on roofs were negligible. The gauges were removed
from the roof because very little snow remained after a
snow-ヲ。ャャセ Nevertheless, observations will be continued whenever any measurable loading occurs.
Revelstoke - This station in the mountains of eastern British Columbia at an elevation of 1800 ft with an annual
precipitation of 143 in. produced high roof loads. The maximum
roof load was 92 psf on a sheltered flat roof; this exceeded
the design roof load by 22 psf. The maximum average load on
each roof was slightly less than the ground load but the loads
exceeded the NBC roof load value. It is surprising that such
high loads occurred as the winter's snowfall was 160 in.,
only 20 in. above normal. The ground snow depth was Les s than
that on which the NBC load is based, but high densities
occurred during the winter. The similarity of roof and
ground loads here as at Glacier, indicate the extremely calm conditions which can be found in some mountainous regions. The unusual feature of an average roof load exceeding the ground load, which was observed on the Bark shelter in the
winter of 1960-61, did not occur again. Another feature
worth mentioning is that despite the 1000-ft difference in elevation between the Bark and the town the loads were rather similar.
These high values are the highest roof loads
observed in the DBR survey since the winter of 1958-59 when the A Station at Glacier reported a maximum average roof load of 160 psf.
Edmonton - The 1961-62 snowfall in Edmonton
exceeded the 51-in. normal value by 38 per cent. In spite
of this, the average as well as the maximum roof load remained well below the ground load at all times, mainly because of the prevailing high winds.
Fort Churchill - This station experienced an exceptionally "good" winter; the total snowfall exceeding
6
-the normal value by 80 per cent. This had a considerable
effect on the roof loads that developed. The roof of the
corridor J-54 had to be shovelled free from snow to avoid possible damage when the load reached about 50 psf.
Fortunately (for the survey) J-165, a corridor roof of the same type and orientation was not cleared until a month
later and the maximum load reached a peak of 90 psf (250 per cent ground load) with an average of 42 psf, the second
highest load observed in the DBR survey in this winter. The Fort Churchill observations showed again that roof orientation is an important factor, as indicated by the heavy loading on J-54 and J-165, compared to the smaller loads (average 18 psf, maximum 31 psf) on corridor E-31 which is the same shape and size as the other 2 corridors but is turned 90 deg.
The canopy on bUilding F-2 also accumulated high
loads up to 50 psf or 15 ,psf over ground load. The rest of
this roof was blown clear of snow throughout the whole winter.
From 5 November to 1 May the mean daily temperature remained below 30°F, a condition favourable for the
accumula-tion of snow. The ground snow depth valttes (no density) for
this ウエ。エゥッセ are taken from the local meteorological station
records.
Waterloo - Observations at this new station showed
very common loading patterns. The maximum roof load on the
two exposed roofs did not reach the ground load. Bart of
the roof of the Engineering Building, however, which is sheltered on the south side, had loads slightly higher than the ground load.
kゥョセウエッョ - Snowfall was near normal in Kingston.
At no time di the maximum roof load exceed the NBC minimum
design roof load.
As in previous years, the flat roof showed higher loading than the gable roof, with maximum loads occurring at
gauges No.1 and No.7, i.e. at the two south corners of
the building. This is mainly beoause No. 1 and No. 7 gauges
are the closest to the 2.5-ft parapet along the bUilding. Ottawa - Ottawa's snowfall was considerably below
normal. The loading patterns were similar to those of the
3 preceding years, even though the winter snowfall for the past 4 years has varied from 58 to 110 in.
For the past 3 winters the winds appear to have come mainly from either the 'east or the west.
7
-,
The winter of 1958-59, however, did not follow this rule; the maximum roof loads on the Davidson Orescent roof were very near ground loads all winter.
The sheltered flat roof on Fairhavenway again accumulated relatively high maximum snow loads, exceeding
the ground load. This was also the case for the DBR bUilding
which has a 2-ft parapet along the edges.
The Mark III experimental house, at 40A Barker?
was added to this year's observations. Snow loads on this
low sloped roof were quite small; this can be attributed to the exposure of this roof to winds from the east which
accompanied the snowfalls.
Ste. Anne de Bellevue - At this station the ground
load did not exceed
35
psf even though the total snowfall was30 in. greater than last year or 110 in.
The average roof load reached only 8 psf throughout the winter and the maximum roof load exceeded the ground load
by only 2 psf. This may have been caused by heat loss even
though the building is insulated.
Montreal - Although the snowfall was 13 per cent above normal, the roof loads observed at this station were rather low because of the action of wind and frequent thaws. In the past reports the normal snowfall for Montreal was
quoted as 89 in. After further investigation it was found
to be 97 which is used in this report.
Arvida - Observations at this station were made
from 11 December to 5 March. During this period the snowfall
was 49 in.; the highest load recorded on the ground was
13 psf and the maximum roof load was 11 psf. The large
industrial flat roof observed has never had any critical
loads.
Halifax - Again this year the flat roofs of the
NRO building and the Nova Scotia Technical Oollege experienced high maximum loads, undoubtedly caused by winds around the
penthouses on these two bUildings. Because of the proximity
of the Atlantic coast the winds were generally higher here
than at other stations. Temperatures during the winter
frequently reached the 30's causing most of the snow to melt after snowfalls, except for the last part of February when temperatures remained below 30 degj as a result the peak loads of the winter were formed after considerable snowfall during the month.
Gander - Roof loads at this station were very small,
8
-load came to a high of 75 psf during the last part of the
winter. Since during this period the observed snow depth
was only 27 in., the density was exceptionally high (over
0.5 gm/cc). セャゥウ can be explained by the fact that in the
latter part of March when mean temperatures were in the 30's, the top snow melted and increased the density of the lower
layer. The maximum density recorded was 0.63 gm/cc.
Other Stations - The A Stations not mentioned above (Inuvik, Saskatoon, Winnipeg, Toronto, Goose Bay) had no unusual characteristics (Table I, Fieures 3, 6a, 6b, 7, 10 and 17).
B Stations
Although not many B Stations reported to the Division, those that did helped support the results of the A Stations
with specific case histories. Average snow loads on the roofs
were usually less than the ground loads. Accumulations of
snow occurred, as expected, on leeward slopes, on lean-tots such as carports or porches, on the lower part of split-level roofs and on canopies.
C Stations
All C Stations had average roof loads less than the ground loads with the maximum load concentrated near walls
and other obstructions on the roofs. High load concentration
occurred at some locations, such as on the Mechanical
Equipment Garage at North Bay where a load of 118 psf, i.e.
125 per cent above the ground load, was observed. High loads
also occurred on some of the lean-to roofs of the cantilever hangars, especially at Lancaster where the load was 105 psf. Other C-Station roofs had no unusual snow loads.
Local Survey
Twelve houses in Cardinal Heights, a typical sub-division of average-size one-storey bungalows on the eastern
outskirts of Ottawa, were observed on two occasions. All
the roofs, with one exception, were either hip or gable roofs. The generally flat topography and the lack of trees in the area provide conditions such that the houses would be called "exposed."
Most of the roofs accumulated loads that were
about equal to the ground load. These were usually confined
to small areas on the leeward slopes or near chimneys and would therefore not have been too serious because of "load
sharing." The average roof loads ranged from nearly 0 to
9
-roofs under "exposed" conditions, the design load might be reduced below the present NBC value of 80 per cent of the ground load.
Also included in this local survey were a number of flat roofs of multi-storey office buildings located on
the NRC property on Montreal Road. Average loads on the flat
roofs were slightly less than the ground loads.
The snow depths observed on the arch proper of the
Hull Arena were very small. On the flat canopies below the
arch, however, average loads of 70 psf occurred as a result
of snow melting on the arch. The maximum observed was 140 psf.
GENERAL DISCUSSION AND CONCLUSIONS
This survey of snow loads on roofs which has been carried on for 6 years, has already provided considerable information on snow loads and should provide even further information in a few more years when the observations for
all the years are analyzed together. To date the survey has
provided the following information:
1. Snow loads vary considerably from roof to roof in the
same area and also from year to year on the same roof because of changes in total snowfall or even because of changes in wind conditions alone.
2. The type of snow accumulation varies with geographical
location, (e.g. severe drifting at Fort Churchill, uniform loads at Revelstoke).
3.
Although the average roof loads are considerably belowthe ground loads, the maximum roof loads (i.e. drifts) significantly exceed the ground loads.
4.
In sheltered locations the roof slope has littleinfluence on the snow load.
5.
Concentrated loads occur most frequently near verticalprojections from the roof.
6. Wind is the major factor affecting snow loads.
In view of these findings some changes have been made by the Associate Committee on the National Building
Code in the 1960 Code (10) and the Housing Standards. The
basic roof load has been first reduced to 80 per cent of the
10
-the roof, this basic load has been increased by 50 per cent for a strip which is 3 times as wide as the projection is
high but not exceeding 15 ft. For sloped roofs, reductions
have been allowed for slopes over 30 deg (previously it had
been 20 deg). For curved or peaked roofs an unbalanced load
25 per cent greater than the specified uniform design load
is required on one side and no load on the other. Finally
roofs onto which snow is likely to slide from another roof are required to be designed for the full weight of snow from the contributing slide area in addition to the regular snow
load. Further refinements will undoubtedly be made but this
cannot be done on the basis of the present results.
Snow loads perhaps even more than other loads,
are "probable loads. h There are, unfortunately, so many
variables and factors affecting the magnitude and distri-bution of snow loads that to take all of them into account and yet arrive at a design load that is not too conservative
is a difficult problem indeed. To avoid all danger of
over-loading by making extremely conservative assumptions about
wind and shape effects, would mean penalizing
999
out of1000 roofs to save the one. The problem in essence is to
choose an acceptable probability of overloading which, in
turn, will determine the probability of failure. For example,
a residence in an extremely sheltered location might accumulate
an average roof load equal to the ground load. But the
majority of houses are not located in such areas and do not
accumulate such heavy loads. It would therefore seem .
unreasonable to require all residences to be designed for an average load equal to the full maximum ground load.· A rational design load for residences can only be arrived at by observing a great number of residences under various sheltered conditions; a probable design load could then be selected from this
statistical sample, with due regard to the safety factor provided for all contingencies besides overloading, i.e. variability of material, workmanship and deterioration.
At present A and C Stations are providing only
two or three roofs in each area. Considerable additional
information for even an approximate statistical analysis is
required. Such information can be obtained by observations
of many roofs, irrespective of their roof load, at a time
when the ground depth is near maximum for the winter. These
local surveys must be done on residential, office- and
industrial-size roofs as well as on specific cases, such as unbalanced loads on sloped roofs.
11 -REFERENCES
1. Allen, D. E. Snow loads on roofs. The present requirements
and a proposal for a survey of snow loads on roofs. National Research Council, Division of Building Research, Internal Report No. 106, September 1956. 19 p.
2. Allen, D. E. Snow loads on roofs, 1956-57 - A progress
イ・セッイエN National Research Council, Division of
Building Research, Internal Report
No.
134, January1958. 7 p.
3.
Allen, D. E. and C. J. Turkstra. Snow loads on roofs,1957-58 - Second progress report. National Research
Council, Division of Building Research, Internal
Report No. 163, November 1958. 6 p.
4.
tィッイ「オャセL H. J. and B. G. W. Peter. Snow loads on roofs,1958-59 - Third progress report. National Research
Council, Division of Building Research, Internal
Report No. 184, November 1959. 16 p.
5.
Peter, B. G. W. and H. J. Thorburn. Snow load observationsat B Stations, 1958-59. National Research Council,
Division of BUilding Research, Internal Report
No. 189, December 1959. 13 p.
6.
Watt, W. E. and H. J. Thorburn. Snow loads on roofs,1959-60 - Fourth progress report. National Research
Council, Division of BUilding Research, Internal
Report No. 204, November 1960. 10 p.
7.
Scott, J. F. and B. G. W. Peter. Snow loads on roofs,1960-61 - Fifth progress report. National Research
Council, Division of Building Research, Internal
Report No. 228, November 1961. 14 p.
8. Thomas, M. K. A method of computing snow load.
Engineering Journal, Vol. 38,
No.2.
February1955. p. 120-123.
9. National Building Code of Canada (1953). Associate
Committee on the National Building Code. National
Research Council, Ottawa.
10. National BUilding Code of Canada (1960). Associate
Committee on the National Building Code. National
Research Council, Ottawa.
11. Allen, D. E. Field instructions for observers at A Stations
of snow loads on roofs. National Research Council,
Division of BUilding Research, Technical Note No. 233,
12
-12. Climatic information for building design in Canada 1961.
Supplement No. 1 to the National BUilding Code of
Canada. Associate Committee on the National
Building Code, National Research Council, Ottawa. NRC 6483.
TABf,l\ I
SNOW LOADS FOR A STATIONS 1961-62
NRC Max Max Avg Max
Station Roof Roof (psf) Ground Roof Observed
/53 /60 (psf) (psf) Roof (psf) Inllvik, N.W.T. Gable: Not heated, sheltered from
south 30 37 46 2 4
Gable: Heated, insulated, exposed 30 37 35 10 25 Flat: Heated, insulated, exposed 35 37 41 4 9
Vancouver, B.C. 30 27 Practically no snow
Revelstoke Gable: Heated, insulated, exposed - 70 85 80 81 B.C. Gable: Not heated, sheltered -
-
84 80 92 Flat: Heated, insulated, exposed - 70 85 70 84 Edmonton, Alta. Gable: Unheated, sheltered 25 22 27 5 7 Flat: Heated, insulated, exposed 25 22 28 2 6 Saskatoon, Gable: Heated, insulated, exposed 33 28 23 7 9Sask. Gable: Heated, insulated, exposed 35 28 21 8 15 Flat: Heated, insulated, exposed 35 28 17 4 14 Flat: Heated, insulated, exposed 35 28 20 6 15 Flat: Heated, insulated, exposed 35 28 17 5 6 Winnipeg, Man. Gable: Heated, insulated, sheltered 32 36 11 6 9 Flat: Heated, insulated, exposed 35 36 11 10 13 Fort Churchill, Gable: Heated, insulated, exposed 55 53 36 12 20 Man. Flat: Heated, insulated, exposed 55 53 36 5 50 Flat: Heated, insulated, (corridor) 55 53 36 20 48 Flat: Heated, insulated, (corridor) 55 53 36 42 90 Flat: Heated, insulated, (corridor) 55 53 36 18 31 Toronto, Onto Gable: Insulated, sheltered 24 26 12 1 3 Flat: Heated, insulated, sheltered 35 32 16 8 16 Kingston, Onto Gable: Heated, insulated, sheltered 47 40 16 6 11 Flat: Heated, exnused, 2.5' parapet 55 40 18 14 32 Ottawa, Onto Gable: Heated, insulated, shelt. (north) 43 48 27 3 5 Gable: Heated, insulated, exposed 43 48 27 3 8 Gable: Heated, insulated, exposed 43 48 27 3 8 Flat: Heated, insulated, sheltered 50 48 38 14 38 Flat: Heated, insulated, exposed 50 48 35 8 15 Flat: Heated, insulated, sheltered 50 48 27 15 35 Waterloo, Onto Gable: Heated, insulated, exposed - 50 22 2 8 Flat: Heated, insulated, exposed - 50 22 8 9 Flat: Heated, insulated, sheltered - 50 22 13 30 Ste. Anne de Gable: Heated, insulated, exposed 34 35 28 5 19 Bellevue,P.Q. Flat: Heated, insulated, exposed 50 44 28 8 30
I
Montreal, P.Q. Gable: Heated, insulated, exposed 43 43 35 4 19 Flat: Heated, not insulated, exposed 50 43 46 7 11Arvida, P.Q. Flat: Heated, insulated, exposed 55 60 13 6 11 Halifax, N.S. Gable: Heated, not insulated, sheltered 34 36 31 5 8 Flat: Heated, insulated, exposed 40 36 22 7 36 *Flat: Heated, sheltered 40 36 19 20 59 Gander, Nfld. Gable: Heated, insulated, sheltered 42 50 76 7 8 Flat: Not heated, insulated, exposed 45 50 70 4 6 Goose Bay, Lab. Gable: Heated, insulated, exposed 78 82 39 11 16 Plat: Heated, insulated, no parapet 90 82 39 12 15
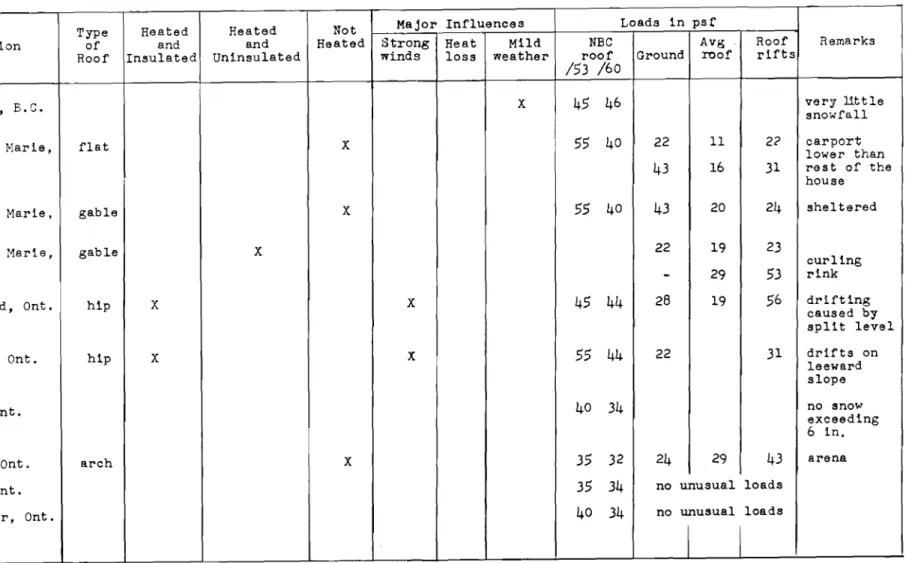
TABLE II
SNOW LOADS AT B STATIONS 1961-52
Type Heated Heated Not Major Influences Loads in pst:
Location of and and Heated Strong Heat Mild NBC Avg Roof Remarks Roof Insulated Uninsu1ated winds loss weather roof Ground roof r1.fts
/53 /60
Court1.nay, B.C. X 45 46 very little
I
snowfall
Sault St. Nar1.e, flat X 55 40 22 11 2<' carport
Onto lower than
43 16 31 rest of the house
Sault St. Mar-Le , gable X 55 40 43 20 24 sheltered
Onto
Sault st. Harie, gable X 22 19 23
Onto curling
-
29 53 rinkChelmsford, Onto hip X X 45 44 28 19 56 dr1.fting
caused by split level
Cormvall, Ont. hip X X 55 44 22 31 drifts on
leeward slope
London, Onto 40 34 no sno...exceedingr
6 in.
Toronto, Onto arch X 35 32 24 29 43 arena
;"hi tby, Ont. 35 34 no unusual loads
Dorchester, Onto 40 34 no unusual loads
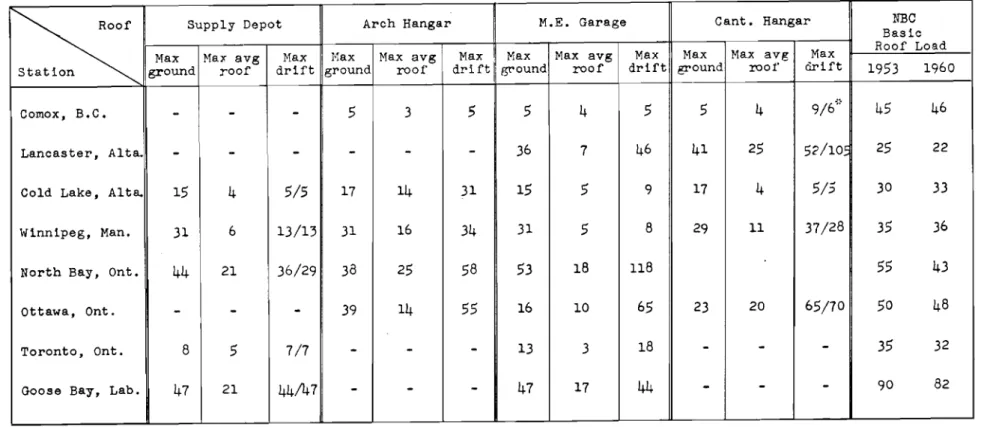
TABLE III
SNOW LOADS FOR C STATIONS 1961-62 (in pst)
セ
Supply Depot Arch Hangar M.E. Garage Cant. Hangar NBCBasic Max Max avg Max Max Max avg Max Max Max avg Max }fax Max avg Max Roof Load Station ground roof drift ground roof drift セッオョ、 roof drift ground roof c'irift 1953 1960
Comox, B.C.
-
-
-i
5 3 5 5 4 5 5 4 9/6':- 45 46
I
Lancaster, Alta.
-
-
-
I
-
-
-
36 7 46 41 25 52/10c 25 22Cold Lake, Alta. 15 4 5/5 17 14 31 15 ;5 9 17 4 5/5 30 33
Winnipeg, Man. 31 6 13/13 31 16 34 31 5 8 29 11 37/28 35 36
North Bay, Onto 44 21 36/29 38 25 58 53 18 118 55 43
ottawa, Onto
-
-
-
39 14 55 16 10 65 23 20 65/70 50 48Toronto, Onto 8 5 7/7
-
-
-
13 3 18-
-
-
35 32Goose Bay, Lab. 47 21 44/47
-
-
-
47 17 44-
-
-
90 82NOTE: - indicates roof not available.
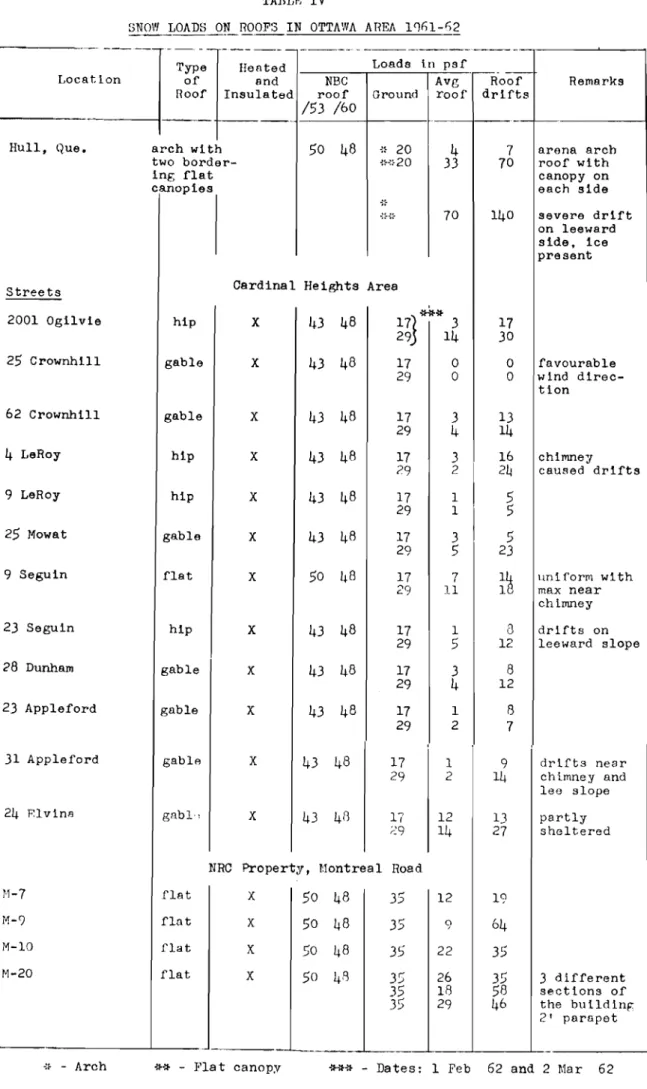
TABLE IV
SNOW LOADS ON ROOFS IN OTTAWA AREA ICJf)I-62
セMMMMMMセM
_._-ᄋセᄋMᄋQセMMMM
---⦅ N ⦅ M M M M M M M M M M ⦅ N ⦅ セ M M MType Heated Loads in psf
-Location of and NBC Avg Roof Remarks
Roof Insulated roof Ground roof drifts
/53 /60
----
---Hull, Que. arch with 50 48 .:} 20 4 7 arena arch two border- GセᄋZGRP 33 70 roof with
ing flat canopy on
canopies each side
セZM
G[hZセ 70 140 severe drift
on leeward side, ice present Streets Cardinal Heights Area
***
2001 Ogilvie hip X I.j.3 48 17J ) 17 29 14 )0
25 Crownh1l1 gable X 4) 48 17 0 0 favourable 29 0 0 wind
direc-tion 62 Crownhill gable X 4) 48 17 3 1)
29 4 14
4 LeRoy hip X 4 3 48 17 ) 16 chimney
?9 2 Rセ caulled drifts 9 LeRoy hip X 4 3 48 17 1 5 29 1 5 25 Mowat gable X 4 3 48 17 ) 5 29 5 23 9 Seguin flat X 50 48 17 7
エセ
un l form wi th 29 11 max near chimney23 Seguin hip X 43 48 17 1 a drifts on
29 5 12 leeward slope
28 Dunham gable X 43 48 17 3 8
29 4 12
23 Appleford gable X 4 3 48 17 1 8
29 2 7
31 Appleford gable X 43 48 17 1 9 drl.fts near 29 2 14 chimney and
lee slope 24 RlvinB gabL: X 43 48 17 12 13 partly
;':9 14 27 sheltered
NRC Property, r:lontreal Road
H-7 flat X 50 48 35 12 1° M-') flat X 50 48 35 9 64 M-lO flat X 50 48 35 22 35 M-20 flat X 50 4,Q 35 26 35 3 different 35 113 58 sections of 35 29 46 the buLl.dLng 2' parapet
TABLE V
SNOW LOADS ON LARGE FLAT ROOFS
Average Roof Load x 100 Location Roof Roof Load Ground Load
(%)
Inuvik, N.W.T. Post Office 4 10
Comox, B.C. Arch Hangar 3 60
M.E. Garage 4 80
Cant. Hangar 4 80
Lancaster, Alta. M.E. Garage 7 20
Cant. Hangar 2$ 61
Cold Lake, Alta. U.S. Depot 4 27
Arch. Hangar 14 83
M.E. Garage 5 16
Cant. Hangar 11 37
Saskatoon, Saa k, Gymnasium 4 24
Winnipeg, Man. Library 10 91
U.S. Depot 6 20
Arch. Hangar 16 52
M.E. Garage 5 16
Cant. Hangar 11 35
Fort Churchill, Man. Barracks 0 0
Waterloo, Onto Main Eng. Bldg. 8 36
Eng. Building 13 ')9
North Bay, Onto U.S. Depot 21 50
Arch. Hangar 25 66
M.E. Garage 18 34
Toronto, Onto U.S. Depot 5 62
M.E. Garage 3 23
ottawa, Onto Office 15 55
Arch. Hangar 14 48
M.E. Garage 10 62
Cant. Hangar 20 87
Arvida, P.Q. Rolling Mill 6 46
Goose Bay, Nf1d. D-26 12 31
U.S. Depot 21 45
No C STATIONS 18 COMOX 19 LANCASTER 20 COLD LAKE 21 WINNIPEG 22 NORTH BAY 23 TORONTO 24 GOOSE BAY No A STATIONS I INUVIK 2 VANCOUVER 3 REVELSTOKE 4 EDMONTON 5 SASKATOON 6 WINNIPEG 7 FORT CHURCHILL 8 TORONTO 9 KINGSTON 10 OTTAWA II WATERLOO
12 STE ANNE DE BELLEVUE 13 MONTREAL. 14 ARVIDA 15 HALIFAX 16 GANDER 17 GOOSE BAY
[)
Oセ
. / 1 A / ./ ./ /セL
"',
" . ' . " , / "セイ
o {)セ Nセセ セMjセ
.-
セ{セ
! . _ - lセN
/ .MMセMM
"
. / j / r- ii
7-Aセ⦅
24.C 17.AO
\v..._r.'}... ( \v - IG·A,."
J!
/
-\
h=
K7 ,...
<, \) / 5-A,F
(
d
セTMaセ
Zセス
; , ;?/セN
-- . :'3f
3..E Iセ
_/1'(:"/'70'F
-- -'-.-....121-CGAZNNセ k.,,:;-
.
r \
15-A セB[[Z^ANイM \. 13-A " " "セセ」
".;,1,
, 1 2 - A 401
3 5c'(""
<,セi]SQZョZZ
: ;30 25 GROUNO ,JE6-A .::I!::=.
eoro sis , .."
CO"
r( "..
L
If{;
="H
b LOAD IN LB / SO FT (1961-1962 ) AVG ROOF LOAD (MAX)h-V
セ FIGURE IABC STATiON LOCATIONS AND THEIR AVERAGE
ROOF 8 GROUND LOADS,( MAXIMUM OBSERVED 1961-1962)
, --' "'Tl G> C :::0 rn I"\) 3: 1> X 3: c 3: INUVIK REVELSTOKE EDMONTON SASKATOON WINNIPEG CHURCHILL TORONTO LOAD IN LB/ FTz
セ
__ .J---.I
セMMイ&ii&B;;:J-
Jirt
I
I
Lセセ
セ
Z Zj
N'Be, ROOFloadセB
iセ
セセM GROUND 0 __ , , FLAT ROOFMZセ GAB1LE ROOF
I "I
0セ J_J j セ セ
PI
:11セ
iii
11 - I , セQQAゥゥャャャャャAAQQi ; :.-.:;-==:'-J' , イMMセ i セM[ I' Iセ
"I
'" o 5 1> o U> セ KINGSTON OTTAWAセ
[ B - . - - - - '-',---' セ , II ---J..I -,--J 1> U> -l » :::! o z U> <.D en I en I"\) WAH_RL00 STE ANNE DE BELLEVUE MONTREAL ARVIDA HALIFAX GANDER GOOSE BAYセL
M M --',--' , BMセMMG :セセ]S
:I::J
セイMMセ I " -MMセA I::Jセlエ]ゥ
:,
bbi
I,J
Ifセ}ャセセセZGQ
II
I
..,. -"ROOF DESCRIPTION " r
-i :
..,'-,
: Mセ 2 .3 I .---.l ".
120' nセ 30' FEDERAL BUILDING(EXPOSED, HEATED, INSULATED}
E-3 RESIDENCE
I£)(POS£O, HUr£O. INSULAr£o 4')
HOME ECONOMICS ANNEx (SHELTERED FROU SOUTH, LOW HEAT)
APRIL '- ,_-,,,., , ..._---... I', セ --, 1 ' / セ / -,..l I ' " I I / , " / I / 6 セ セ
JANUARY FEBRUARY MARCH
I I I i ...-r-- ...-r-- ...-r-- + ...-r-- ...-r-- ...-r-- ...-r-- t ...-r-- ...-r-- ...-r-- ...-r-- ...-r-- ...-r-- ...-r-- t ...-r-- ...-r-- ...-r-- ...-r-- ...-r-- t ...-r-- ...-r-- ...-r-- ...-r-- ...-r-- t ...-r-- ...-r-- ...-r-- ...-r-- ...-r-- ...-r-- j HOME ECONOMICS ANNEX ... --...
---"" <:::'-r---::--= ]MMセM⦅ャ⦅BNNRoar NOT ACCESSl8LE fROM DEC 24 TH TO JAN 6 TH
RESIOENCE MAXIMA AT #2 MINIMA AT.#5 FEDERAL BUILOING MAXlhlA AT Mg MINIMA AT·5 VPQMMMMMMセ I 20 - - - I I /--... " .,.-1"'-_/ .... c; 6 6 0
OCTOBER NOVEMBER DECEMBER
.,: 120 セ I セ i セ I セ 0 80 I z I if) 0 w j-, <I .. _--J 40 I => セ u
----U <I 0 / 40 20 0 N 40 .... セ 0 <I 20 s 0 - - - - NO INfQRIiIATION AVAilABLE I ... " t / I 0 z izc, 40 セZZe <to ow ll:' 20 x if) N <I-t,
'" s 0 +50 >- +32 -=' ... ;5" o, 0 Z'" <lW w .... '" -40NORMA L 1961) 62INOV - APR'
55' 50 7 "
FIGURE 3
SNOW LOAD OBSERVATIONS ON ROOFS YEAR: 1961/62
i;
セ ROOF DESCRIPTION".
80セセ
A
, 2.' MT. REVELSTOKE »,> r--I NATIONAL PARK セ.
LOセN 60 - PICNIC SHELTERh
'[7 .,セZh
MINIMA AT #1セ
"----
D](::
, 'i
--40W
MT. REvELSTOKE NAT. PARK SHELTER(SHELTERED, NDT HEATED 20 ELEV 28DD FT V GARAGE ROOF 0 ,
r-
'0' i •'V
MセM1/""
"-]
t,BセイZZZj}
-2 3-80iセBB
"
--208, 9 th ST. EAST .a ..-UNIFORM COVERAGE I ,,' 1'0'I セ セ 60/7
"\ RESIDENCE. 208 9T HST. E u,(SHELTERED. HEATED. INSULATED)
li' ELEV 18SD FT c 40 3
//
v
r-
.,' '1 20--t-
r
.,..
.,
V
ᄋセi ., ., ., 0イセ
l
1
..
..
": , 80 '...-1
OェェセセM
, MOUNTAIN VIEW 1 ,MOUNTAIN VIEW ELEMENTARY SCHOOL
,,
ELEMENTARY SCHOOL " (EXPOSED. HEATED, INSULATED)
\ ELEV 18SD FT 60
OゥvHヲ|セ
r-, 40kZセ
j;/-J, Iセ
I i ' r--20 セ, z 0NOVEMBER DECEMBER JANUARY FEBRUARY MARCH
160 セ V>
J
w ox: 120 ujV
;;;: . -' ...J 80 セ/
'"0z U> c 40 wiセ
>-<t ...J :::> '" :::> u 0 U <t SNOWFALL 0 40 z iiIセセ NORMAL 1961 I 62{NOV. -.A.J
c, ,..::E ... 143' 166" ...J セセ 20 N
i.:
セ
uセ
セャ
wWi,
x"" <tV> '" 0 s ::; +32---セ
セMイ
---r----
<ill-""- ...0
0 " " z'" 0 lェセ V"' FIGURE 4 '" -40SNOW LOAD OBSERVATIONS ON ROOFS YEAR: 1961/62
ROOF DESCRIPTION ADMINISTRATION BLDG '" I エセGa " 1
tl::
.,]
,. 0' cXPO$cO HEATED INSULATED \ \ _ _ --- ---....
ADMINISTRATION BLDG. ALL MINIMA AT *9 40l---+---t----f----+---t---i---l I-・MエMMMNRNPMャMMMNZNセTMMNNN[Bセセ⦅ォZZZZZZZZZセMMMNNアsMセ]セセ[ZLLLNMtMMMQ -e o -J 4 0 1 - - - + - - - t - - - t - - - 4 - - - - t - - - - t - - - j SECTION .. A-A"MINING STORE SHED
セL
1 ,
MINING STORE SHED
_ _ _ _ J
--- '\
.,J:. WMMGM[MM[セG [セ 3 3 3 3 セ 2
( SHELTERED, UNHEATED BLDG,)
OCTOBER NOVEMBER DECEMBER JANUARY FEBRUARY MARCH APRIL
セ 120 3 -J ;:;: セ 0 80 z V> セ 8 I l - I
->:
er ..J 40 セ => '" セ => u »> U -« 0 40 20 , ++
セ
N ie"lNo 0"EC1IO'A
...
セ " E " \ + +t r .. ih Iii ...s セ \Ii...
j.f
...
セh Iセ + iI n ..."l \/\
40 SNOWFALL (QCTOBfR APRil) NORMAL 1961/62 51 7" 69·5' FIGURE 5ROOF OESCRIPT ION N MMセM
B
'
',.-;0.• _2 4 _ ,.
.
セ _6 8. __1 セ _ .45:6- . .セI EXPOSED. HEATED, INSULATED)
133 - I07!!! ST r:":":< , -I - ----133 -107 TH. ST. 40セMMMMMKMMMMKMMMエMMMTMMMMMG 314 LAKE CRESCENT
qa-.
•1 _3t:=:J:
c? - ..;:;r. .,.._5 7. :; ---=....'.6 8_ セ _ 54' J(EXPOSED. HEATeD. INSULATED)
,-- ---, _ 3 ,,/ -- -- " , ; / 314 LAKE CRES. lMMMMMMKMMMMKMMMMMャWセMoBGGvエ⦅]BNMNGGセ 40L - - - l - - - - + - - - - t - - - - i - -I N.- 20 u, i ' iMMセ 0 0 -' 40 o
OUTDOOR TEST STATION
-",----
---
----,...,
"'---,," '"
OUTDOOR TEST STATION
N
dMZtエMセセNセ
___1: セMMゥ
L セoG J
NOVEMBER DECEMBER JANUARY FEBRUARY MARCH
I I
oL----.L::.+==----+---t---t----セ :f 8 0 L - - - + - - - + - - - j - - - - t - - - - i..
u, 3' o Z if> <:> ur .-..
-' :::> セ :::> u u..
FIGURE 6(a) SNOWFALL (NOVEMBER - MARCH)!
セ
40iセ
r
NOoirセtQPセ RMセ セ セ セセ
セ
セセ
20Aviセ|
\N|ヲセ
Vセ
\YiU ,
rv
uセ
セ 0I
NORMAL 40' 1961/62 48'0' "It.Z771-.SNOW LOAD OBSERVATIONS ON ROO FS YEAR: 1961/62
ROOF DESCRIPTION N.R.C. LAB. MAXIMA AT#184 MINIMA AT #S ',. NR.C LAB Q , 1961/62 47" .5
..
I·'
· 2.
, SNOWFALL (NOVEMBER - MARCH I FIGURE 6(b) MセM -"-' セM.1
H'":1
i ---I NORMAL 40· EXPOSED. HEATED.VENTIlATEO 2' PARAPETS DETAIL A(EXPOSED, HEATED. INSULATEDJ
-iI
GYMNASIUM ,..
"'---.4
,-
Nセ ! ; , • i I Hl'3;'-"It iᄋセi
..
..
..
-I
! セ 5.-.J MARCH ャセM 225' I I I II I I 1\ I I I , i I JANUARY IFEBRUARY"
...-
.._---
---
... MMMMOMZZ_セイ⦅⦅N I i i I ! GYMNASIUM MAXIMA AT.,. 5 MINIMA AT #3 20iMMMMMMセMM <- I- "-セ セ 401---'---+---r---o -' I I I--.. o 1 I I 1 i , NOVEMBER DECEMBER I I i セ 1 ..J , -' 80 i セ I セ 0 z U> 0 40 .... I-<{ -' :::> ,../ '" :::> 0 u u <{ lilt.'Z7'17-7SNOW LOAD OBSERVATIONS ON ROOFS YEAR: 1961/62
401----J---+----r - - - i - - 1
SOUTH WING OF LIBRARY
ROOF DESCRIPTION LIBRARY 5 WING o //// 12' ABOvE ROOf' 'c.!
..
--;:-I [Nl.
.
セ ., • > ,. セ .7 .6 " .1 f- 7?'-t}- - -'"g
601---j---f---t---r----, 401----+----+---t----i---,AGRICULTURAL ENG. BLOG.
EXPOSEO, INSULATED. Nor VENTILATED, UNHEATeo AIR SPACE
AGRICULTURAL ENG. BLDG. 201---+---I---r--o / - - MMMMセM セMMMMMMYMMM 10--- 9 Oセ RPGセ
セ
セェ
."..
NOVEMBER DECEMBER JANUARY FEBRUARY MARCH
SHELTERED, ATTIC UNHEATED,VEN TIL A rEO. INSULATED
FIGURE 7 SNOWFALL (OCTOBER - APRil) -' -' セ セo z U) 801----t---+----r---i--1 NORMAL 54' 1961 162 66" II. 7777-4
SNOW LOAD OBSERVATIONS ON ROOFS YEAR: 1961/62
ROOF DESCRIPTION 6 0 1 - - - + - - - + - - - - + - - - + - - - 1 - - - - + - - - 1
--- ..._--_...- ---... -, 7 8 s G - 22 l i P MイZMセ0
---- T --r,··<\'
21 . J ! > ' . ---'L:d:,;,m,:J
, '0HEATED, {r,;SULATEO. NOT セG{ャャOイilaイeo
,
LセLMM
s , ' 7.J.. ,JlL 10 40 G- 22 20 ... -.---4 , 7 0 6 6 0 1 - - - + - - - + - - - - + - - - + - - - 1 - - - - + - - - 1HFATED. INSULATED, VENTILATED
\--'1
\
----MMセ⦅ ... -F- 2 ALL MAXIMA AT "10 ALL MINIMA AT ·1·9 20 /_ __ __ _ • CO> '" '3 401---+---+---I---b""'-'=---1---F=--,,---I oNOVEMBER DECEMBER JANUARY FEBRUARY MARCH APRIL MAY
--' --'
i
6 0 1 - - - + - - - + - - - 1 - - - + - - - 1 - - - 1 - - - 1 B5 8 >--セ 40ヲMMMMKM]]セMMMセK]]]]]エ]]MMMM⦅⦅⦅ャMMMMK⦅MMM⦅⦅Q§
セMMイ -a: o (NOVEMBER セ MAY) SNOWFALL WINu OIRECTION BLMセ 4 0 1 * - - - - + - - - + - - - 1 - - - + - - - + - - - - + - - . . - - - - 1LLセ
Qセ[[ゥZ
ArT
セセ
"4セ
_ ) '" "wf',.
2:
V"fAJ /'
セvvQ|ケカ|イャセサwGィイセ|nセGjvyカケャv|mA|
NORMAL 40" 1961 /62 73" FIGURE 8(0)SNOW LOAD OBSERVATIONS ON ROOFS YEAR: 1961/62
LOCATION: FORT CHURCHILL MAN.
I ROOF J-54 DESCRIPTION ALL MAXIMA AT #1 / \ 40
.>:
-v --- -
".----..., ,--- - - - - -::-SNOW REMovED - I,,_\
/ --".", イroセ ROOF 20:?
--- ---/セ
t
2 2 2セN
2 ' \ 3 IDENTICAl.ROOFS 3 a .,.-; 3 3 3 "3 , -, 100 J - 165 I All MAXIMA AT "IIn
I[KI
MOST MINIMA AT1:12 80j
I '0· I '0· I セ 60.:
N ,--/ SNOW REMOVED t .---J FROM ROOf . / \ <, 'It 40 MセMr:
\
'" ,---.-/-}
---セW
<t , 0 Mセ , --' --- -- セ _.--1 20 -_... -,Jv
セ
r:
. /\t
セ (HEATEO, INSULATED, VENTILATED),
QMMMMTセ
-E - 31 --- ---.;: ---...-,
ALL MAXIMA AT "'"I ,,..---- ,
r -
Gセ ,, -20iMMBBM」セMLL セMM MMセBGMZNセ]-i.:
セ I--....
セL
... セ 4 4 4"<, 1:1 I 2 2 2 2 2 J- 54 0 2 4..
4 3 ---, 2 '-,NOVEMBER DECEMBER JANUARY FEBRUARY MARCH APRIL MAY ...
"= I I J-165 l:l --' i I --' I セ I I セ I §E 80 I ! i I E -:3,1 D '" I iセj :3
..
セ i j 40 , z>セ
, '" I , ::> I 8 <r a 60,
-
W'jND rECTlDN '" z 40 ;<I
I N SNOWFALL セu.f
W-t-- E ( NOVEMBER- MAY)iセセ セ セa ...
:1
"
セ..
1961/62 ;g"':
... ,- AセW セ + s ... NORMAL40' 73" x 20VyvJ
If'V\AJI
v»
Nセv|セGwカカ
セvカ
G|ェijjGセ
VvwA
-a. '" a +50rcJY'if>"
+32 セ[|j|M --- - - - -----A-7\j
Ii A 1\ AI " r a 'IVVVA/V\
セ
セ セ 'V \y/ FIGURE 8(b)セ
-40SNOW LOAD OBSERVATIONS ON ROOFS YEAR: 1961/62
LOCATION: FORT CHURCHILL MAN.
ROOF DESCRIPTION
(HOTEO, ISOLATED, EXPOSED) 401---+----+---1---, 254 SUNVIEW 2 0 1 - - - - + - - - - I - - - - b - r ' - - - - . 254 SIJNVIEW
GセャN
L....--J 10 セQtEE
, .
.2 4. .セ . • " tJ. セ 401---+---f---+---i MAl N ENG. BLDG. o t 20 MMMMセMMMMMKMMMMZttセMM⦅⦅Q 'if' 401---+---f---+----i ENGINEERING BLDG エセ _-:= _ 2 0 t - - - I - - - -r
t3
Iセ
.-2. MAIN ENG. BLDG.1--_:-1
; ; iz¢
•,
4 144t
I}i
? セ ;J
.1I
I I '44 71-c; I ( HEATED, ISOLATED, EXPOSED)Ii
Nセ 1 .4 : .7 1.
,
• B 01.'"
• j セ セゥ 8 -- Zセ 131'-0 : " Nセ "rr
セMMMMセ
ENGINEERING BLDG..i..'.
IT
MセoセセU[Gサ
f-:_:
_-+----1 セ⦅セMセ B A - A I· i I IDECEMBER JANUARY FEBRUARY MARCH
B-B
I
WINO SPEED NOT AVAILABLE
I
Ii
(HEATED, ISOLATED, EXPOSED)
SNOWFALL (NOVEMBER - APRIL) FIGURE 9 NORMAL 57 1961 I 62 52" -40 6A2777-11
SNOW LOAD OBSERVATIONS ON ROOFS YEAR: 1961/62
60 40 20
{;:;
II DOUGLAS CRES. ,セ
I ' セ 0 Oセ R::,,-- A..
r->- t 5 lL セ 0 <[ 0 セ⦅NLMMGB ...J 40 20 21 DOUGLAS CRES. r .... I .... -...., OセM B .J/... , 0DECEMBER JANUARY FEBRUARY MARCH APRIL
120 z ..s ...J 80 Lr' セ 0 z Vl I r----' 0 40
V
'" >-<[ セ ...J ;;;;) '" ;;;;) 0 セ u u < ROOF DESCRIPTION II DOUGLAS CRES'U"
I r B 9 ',I· . . セゥN セ t. 6 ! ! 3 i L:l セ . 1 i u' _ ... _---=---- ---(SHELTERED HEATED INSULATED) 21 DOUGLAS CRESGdセ
1 0 . 3IE:'
セVセ
.7 _1 -4 -8 1 37'--6 • SHfLTE'l-<fD BLDG. HEATED ATTIC UNHEATED CEILING INSuLATED 40 o t50 :::; t32 - lL < [ . o 0-z'" 0 <['" ",>-'" -40 WIND DIRECTIONセセ ゥNLaセGi:
j
V YW セセvv セiu|ェvvjv-_._---
ヲvv|セイMMMMMM
SNOW LOAD OBSERVATIONS ON ROOFS
SNOWFALL (OCTOBER - APRIL1 NORMAL 1961 /62 55" 53" FIGURE 10 YEAR: 1961/62
I
ROOF DESCRIPTION
4 0 1 - - - + - - - + - - - + ----1---,
26 EOGEHILL AVE.
SHEL TERED
ATTIC NOT HEATED
BLDG HEATED INSULATED I • 26 EOGEHILL AVE. 1 I o c , « 40 I 0 r---' Me NEIL HOUSE 20 0 l-r-r ----i I Me NE IL HOUSE T- .,
..
'---;-:-I J(,' ., ·5 e' I H·40'L
.,..
9 ' I ,r']"
e-I. -< N EXPOSED /NSUL A TEDATTIC NOT VENTILATED ATTIC NOT HEA TED BLDG HEATED PARAPET 2'6" T j -! 80 .--40 r--o
JANUARY FEBRUARY MARCH
SNOWFALL FIGURE II r-+50 ,... +32 - - =,,,-«0 0,,-z:>' Or «.., ..,1-:>' -40 NORMAL 57' 1961 I 62INOV - "AR) 55" NセN 2777-14
SNOW LOAD OBSERVATIONS ON ROOFS YEAR: 1961/62
40
-I
I セMセMMMェMMMMMGMMMMMMKMMMMiMMMi ROOF DESCRIPTION 72 BISHOP blvdセ ... "---oイMMMセM - --- ....,,"'o..---t--...-t"""""'=--i---i _... -- ---20c--- -セ - --- セカ 40 bセrkeセ」LblvoNセ ..Q
T セLI.E 3Nセ' e - 7-セGセI
Zセ::
(EXPOSED. HEATED, INSULATED 2")".----セ セMセ MセMセMMMQMMMMMMMエMMMMMMMMML / ... . . - - - - - - - - ....11
--セ 40 BARKER blvdセ 40 セ 0 a ...J r;4,-;;O'- --DB.R 20 セNセ ---.t
i 1---".---I ,J_ llJLI'cT ., ; ,.
,IC
"I"; ,.
. ---L.r • s . I .m(EXPOSED. HEATED, INSULATEO)
APRIL MARCH I
t - - ' - - ,
FEBRUARY セMKMMMMMエMMMMMセ JANUARY ᄋセMMMKMMMMMMᄆ]セfGMiMMMイMᄋᄋセM DECEMBER FI GURE 12(0) SNOWFALL (OCTOBER - APRIL) -NORMAL 87" 1961/62 69" -40SNOW LOAD OBSERVATIONS ON ROOFS YEAR. 1961/62
DAVIDSON CRES. 0 80 60
..
t: 40 セ FAIRHAVEN WAY 0 MINIMA AT1,364 <[ 0 20 ...J I セMM⦅N 0 60 --"'...-"
I"''''''' I /... "" ....,_1 9 : - - - . , " / _ 9 :::::.NZZZセ
ROOF DESCRIPTIONセ
B 12. l"DAVIDSON CRES INOT: EXPOSED.. . I UNHEATED AIR SPACE • T 8 9 10 ! CEIL ING INSULA TED (4)
6 54 HEATED BLDG I 2 s· I FLAT: 10' TO EAVES セャ セコ セMMMUAGMセ FAIRHAVEN H<9' セ 12. ".
40I- ---1 (SHELTERED, HEATED. INSULA TEO)
40A 8ARKER BLVD. 404 BARKER BLVO.
: _9 3-_12 I -6 i _10 ...
W
J
ャMセGM a' -FIGURE 12 (b) SNOWFALL (OCTOBER APRIL I NORMAL 1961 / 62 B7" 69" -Mセ MARCH FEBRUARY " ----< :/ JANUARY.--.>
DECEMBER NOVEMBERiセ
---+---+--==="----J---MセMMMセカMイM
I 1MMMKMMMMMMMM]NMセ⦅
J
MᄋMiセMM
r
.I-WINO DIRECTION I,II
セ..
A
TMイBセ -"t
\tヲセセjwカ
vv
ケvvセ
---f---I-L.--"l\--t.-1----==--
N⦅セセ
Nv
vセ
A".lY!VV·
o ;;; ...J ...J BO <[ セ 0 iii 0 40 - - - -UJ I--<[ ...J => :>' => u ot---' u <[ ----40 0 z セセ >-...J 20 セgS OUJ a. xV> <[ :>' 0 +50 >- +32 - '""--< [ " 0 a . z:>' 0-<[UJ UJI--:>' -40SNOW LOAD OBSERVATIONS ON ROOFS YEAR: 1961/62
ROOF DESCRIPTION
eXPOSED, INSULATED. VENTILATED,
HEATED
POULTRY BLDG (WEST WING)
SECTIONA- A
N
POULTRY BLDG (EAST WING) M⦅セセ
I
セ
N
Dセ^ MLZセZZGセZZセセNL[Z
_ -:! .1_.1 I-a 12- 16-\:20"" ... ! ,-9 -13 1:"-\-1. EAVES21.'1 Gセセ I 122 I- -MMセ ---!\ ) I/A'
POULTRY BLDG. (WEST WING
I I I ' - / ' 1
-ZGセヲ|Wv
\
=-==", . / ' - 0
o
POULTRY BLDG. (EAST WING)
40l----f---+----t----j----i 4 0 1 - - - 1 - - - , f - - - + - - - - + - - - i GMMMMセMセMKセセMMMセMM セ >-u,
'-
Q^GMセッlセセセセセセセMM]ZZZセセNNZZZZ]]]ZZZアZZZZZZZZZZNLMM⦅ヲZZlセMMゥ o '" o -JNOVEMBER DECEMBER JANUARY FEBRUARY MARCH
EXPOSED, INSULATED AlTIC VENTILATEO
ATTIC NOT HEATED BLDG HEATED o ..-J
セ
イセ
セ XPQMMセMMMMMKセセMセ⦅KセMM II
U>oセセ
'" セ-J 40iMMMセMMMMMKセセMMセ⦅K⦅イ]]MMM⦅⦅エM MセセKMMMセセMMMエ ::> ::E ::> u u '" o イ|イャセ\
u
セセVV'VV
'VIlYV
SNOWFALL (NOV-APR) NORMAL 1961/62 97' 110" oi
iE:;; TッlMMMMMKMMMMMKMMMN[GBMセM⦅KMMMWエMMMMQ >--J ᆱセ 0 " , x Bi 20 er ::E +50 MMMGaQセWG|Nセ ゥセ +32 MMMnセMMセMイ[LMカV.
--z ::E oャMMセセセMKMMM V セセ ::::;; FIGURE 13 -40SNOW LOAD OBSERVATIONS ON ROOFS YEAR: 1961/62
LOCATION: STE. ANNE DE BELLEVUE P.O.
II r - - - -..セKMセセセM|MセセセセKMセMMMセ⦅⦅イ⦅セセセi ROOF OEseRI prl ON f---- MMMMKMMMMMMMセMMMK⦅セセセセKセセセ⦅⦅Kセセセセi MセHGi ,. 2' 11-25': I -'=,1
..
,.r
h'25'"!(EXPOSED, HEATer. "'OT '.v:JI-ATED)
8439 8ERRI ST
イMMMイ]]イセGMMG セMMQ
r.:-:-' & • I· 2' PARAPET
4'
.-!
PARAPET.
\ I \ I \ I \"
\ I \ ,... --, "a 8 8\ I Il\ Nセ ;A' / セjy LLセ 8439 BERR I Sf. t-U. r-i'MMMNゥPTMMMセセセKセセセセセセ ...MMセセᆪNNNNセ⦅⦅⦅ヲセセセQ o « o ..J 11771 O'BRIEN BLVD 4 0 1 - - - ! - - - - + - - - t - - - r : - - - - i o 11771 O'BRIEN BLVD. I \\ I \ I \ I \ri
/12\iZ:-/
613
' 2 12\, I \ I \ /Lv--.\Itil
!
exeosro " HEATFO..
LZL[[セN
.I
INSULATEDNOVEMBER DECEMBER JANUARY FEBRUARY MARCH
..J ..J it ;;0 oz (J) o W t-:3 :::> '":::> '-' '-'« o
L---r'V
j SNOWFALL NOVEMBER - APRIL WIND DIRECTION--... NORMAL 97' 1961/62 110" 0 +50 セ +32 <ill-0 a . z'" 0 «w wt-'" -40 FIGURE 14 SNOW LOAD OBSERVATIONS ON ROOFS YEAR: 1961/62セ . . . . ROOF DESCRIPTION BLDG. NO. 60 MセセM セ -0 1
H"
.---.
" ". セ _3 _6 .,0 ,.. セ セヲM _2 セゥMU 0 lL • •9 IS • • ... 40 .1 i .4.
, 12• alGG 34J 1 0 ALCAN BLDG. NO.60lセl
セGi
et I 253' 0 ---...J..
.
.. 20 1 ",. 6 4 QPMセ セl<
0 'iio:.___セ-
セ セ{Qt==nI
SECTION A-AI EXPOSED, HEATED, INSULATED
NOVEMBER DECEMBER JANUARY FEBRUARY MARCH
:Z -'...J 80 ._..__.. _._._-et u, セ 0 "" v> ,...,.-.,J 0 40_ ...._.._.. w
セ
f-et ...JJ
::::> セ ::::> 0 u u et \ ---- NO INFORMATION AVAILABLE I 40 Nセ
',\
セ
I 0W+E.
""r
WIND DIRECTION -:r: セ。Z イセ 5 ...J 20"
'"
- 0\A./\/?-'
L|セ/L)
セl\_{"V
エセ
etw SNOWFALL Ow .a. Xv>NORMAL 1961/62 (DEC - FEB.)
et :=; 0 49' -+5U r + 32f - - - ----,'TM M M セ M M M - - - -...J - l L V', ..tV r-V\ (J et. 0 a . 0 <r: r\
t/\
",,::0 <J 'ILI) \ / --- FIGURE et W 15 wf-::0 -40SNOW LOAD OBSERVATIONS ON ROOFS YEAR: 1961/62
N.S. TECH. COLLEGE
All MINIMA AT ·2 AND "3 ROOF DESCRIPTION
40iMMMMMjMMMMMェMMMMMMNMャヲMMMエャイMMM⦅⦅エMMセ N.S TECH COLLEGE o 8 セN 1.\.'A&Ovt .2 •セN ,:A.:S SHELTERED HeATED INSULATED PARAPEr1'2" GRADE "1 I
0 "'·-
,. ....l (EXrOSEI. HEATED. IN!:ULA retNO PARAPET) """I., I' 4 r/\
1\
I Gセ I ,k;:"---_
/' I , / ' I 6 " iBBBBセ .../,;' セセLLO-
--- ,-ENGINEERING BLDG. N.R.C. LAB ALL MAXIMA AT -12 o TPQMMMMMセMMMiMMM⦅KMMM⦅⦅エMMMQ セiM 20QMMMMMKMMMMヲMMMMMMMャtGイセMM⦅エMMMQ セ*'
DECEMBER JANUARY FEBRUARY MARCH APRIL z- 120 .: ...J « r: u, ;E BO セ 0 z
J
V> 0 .., I-« 40 ...J/
::> '" ::> r": ur:
u « 0 WIND DIRECTION ...,o:rd"
N I ' . ,. 0 ,.
". 40 ,."LJ
,
, ,. 7.-
,. ISO セ(SHE( T£"£O Nor INSUL A rEDI
HEATED) SNOWFALL \OCTOBER - APRIL) o z . - : r ; ;Eae
r""
...J - 0 «.., 0 . . , .ae xV> « :E o t NORMAL 71" 196/ /62 97" FIGURE 16 t50 セ LL t32 «-°ae セセ ッャMMMMMKMMMMMヲGAMMMMMMエMMMMMゥMMMMMセ WI-'" -40SNOW LOAD OBSERVATIONS ON ROOFS YEAR: 1961 /62
ROOF DESCRIPTION 40 /r--,-,,.1--________, / \ I , \ 0- 26 / \ I \ I \ \ / \ I \ 20iMMMMセMM -- +---I \
セ
\ I \ 1 " \ - -,-«
6 " V \ I / セ \ I 0 \:lo,. ⦅iOセ セ I '0" I セ IT
., ' 4 r FLAr ROOF I HEATED I 4' " " ,. INSULATED I1
NO PARAPET セ.
'.
.
9 • H : 12' ... u, i ' f-0 "'" 0 -' j--iセ ., セ 40f-- ..セ I', '.4V / ""- -', ,...-
...\ ,,"\ セLセ 0-24 I ... \ /' \8
1 I \ I \ \ / '0\
I .2 .4 1': 20セ
I \ -5 . , \ I セMMM •f; •8 セ / 4 5 " " j ./セa
v;;.a
-s iia.. / ⦅UNlセ 3 ,,vS:I• .4TEO. 9 -' EXPOSED. HEATED, , ! I ! I I I I -i I,I ! I ,JANUARY !FEBRUARY MARCH APRIL MAY
:Z 120 .: -' セ "'" セ r--- - MMセMM 0 80 +--f z
セ
V) 0 w ... "'"-' 401.."../ , , => ::E i => ! I u...'
! u "'" I 0 I __.0- +-'60 N.
IW+,
(WINO DIRECTION 0 z-
S -ゥセTᄚiセイj|セセ
iセ セa
-::>!セ
SNOWFALL>-1
セlr
-' - 0 ""'w エMセMMMMM 1961 I 62 INOV.• MARl Ow セセM NORMAL c, RPョセ Ivwセセ|
セv セ
.\
144" 94" x V ) "'" ::E , I---Jl - --- --- - - - -- - -- - - _ .._- MセMM t--+50セ
- - - セ M セ M --->- +32 -=! .... AA .
'"
I
""'. 0 l l . FIGURE 17 z::E oIVJl'V' II1r
f:lWV
VV "",w w'" ::E -40 8R 77772&1SNOW LOAD OBSERVATIONS ON ROOFS YEAR: 1961/62
ROOF OESCRIPTION I
I
セ ",
/ \,
I' " I' I',S
·:
'.:::0
7· I • I8.'
3" - -42 _MECH EQUIP ROOM
HAwKER CRESCENT
(SHELTERED HEATED INSULATEDI
I
...-Iセセ-
.,., -I --- - +----_. 29 HAWKER CRES. 1---20 ,\ J \ I ,... J --f- !---"---+---/---I--_/
セZ^MMMMャセ
! ' 'I II
60 --MMMMiZZMMMMMiMMMセMMMMMM
,--Cl et o .J 20DECEMBER ! JANUARY FEBRUARY MARCH APRIL
1961/62 174" SNOWFALL {NOVEMBER - MARCH 1 FIGURE 18 NORMAL 119" . . . WIND DIRECTION 80