Impact des politiques climatiques sur
les industries énergie-intensives
Impact of climate policies on energy-intensive industries
Thèse présentée par
Frédéric Branger
pour obtenir le grade de Docteur
de l’Ecole des Hautes Etudes en Sciences Sociales
Discipline : Economie
Soutenue le 9 Juillet 2015 devant un jury composé de
Joachim Schleich: rapporteur
Professeur à Grenoble Ecole de Management
Matthieu Glachant: rapporteur
Professeur à Mines Paristech (CERNA), Paris
Roger Guesnerie: examinateur
Professeur émérite au Collège de France, Paris
Thomas Sterner: examinateur
Professor at University of Gothenburg, Suède
Stéphanie Monjon: examinateur
Maitre de Conférences à l’Université Dauphine, Paris
Philippe Quirion: directeur de thèse
© 2015 - Frédéric Branger Some Rights Reserved.
This work is licensed under a Creative Commons Attribution License-ShareAlike 3.0 Unported (CC BY-SA 3.0)
Directeur de thèse: Philippe Quirion Frédéric Branger
Impact des politiques climatiques sur les industries
énergie-intensives
Résumé
Cette thèse étudie les fuites de carbone et les pertes de compétitivité dans les in-dustries énergie-intensives générées par des politiques climatiques inégales. Après une méta-analyse des études de modélisations évaluant les fuites de carbone en cas de politique climatique unilatérale avec ou sans Ajustements Carbone aux Fron-tières, nous utilisons de l’économétrie des séries temporelles pour établir l’absence de preuves de fuites de carbone opérationnelles liés à des pertes de compétitivité dues du Système Communautaire d’Echanges de Quotas d’Emissions (SCEQE) pour le ciment et l’acier. Ensuite, nous décomposons les émissions du secteur ci-mentier Européen en sept effets avec la méthode Log Mean Divisia Index, et mon-trons que les variations peuvent être attribuées principalement à l’effet d’activité. Les réductions d’émissions apportées par le SCEQE sont estimées à 2% entre 2005 et 2012 tandis que le montant des “profits de rente” est évalué à 3.5 milliards d’euros. D’autre part, nous démontrons que l’industrie cimentière a réagi stratégiquement à l’introduction d’une nouvelle règle censée diminuer le nombre d’allocations gra-tuites pour les installations en sous-production. Les entreprises ont augmenté ar-tificiellement la production dans certaines usines, générant des distorsions allant à l’encontre de la transformation bas-carbone du secteur. Enfin, nous discutons de réformes possibles pour le SCEQE et plaidons pour des allocations proportion-nelles à la production pour le court terme.
Thesis advisor: Philippe Quirion Frédéric Branger
Impact of climate policies on energy-intensive industries
AbstractThis thesis contributes to the literature on carbon leakage and competitiveness losses in energy-intensive industries generated by uneven climate policies. After a meta-analysis of modelling studies assessing carbon leakage with or without Bor-der Carbon Adjustments; we use time series econometrics and find no evidence of competitiveness-driven operational leakage due to the European Union Emis-sions Trading System (EU ETS) for steel and cement. Next, we decompose emis-sions the European cement sector into seven effects with a Log Mean Divisia In-dex method, and show that most of the variations can be attributed to the activity effect. Abatement due to the EU ETS is estimated at around 2% between 2005 and 2012 while the amount of “overallocation profits” is assessed at 3.5 billion eu-ros. Further, we demonstrate that the cement industry strategically reacted to the introduction of a new rule supposed to reduce free allocation in low-producing installations. Companies artificially increased production in some plants, gener-ating distortions going against the low carbon transformation in this sector. We finally discuss possible reforms in the EU ETS and advocate for output-based al-location in the short term.
Mots-Clés
Fuites de Carbone Compétitivité SCEQE Marché de permis d’émissions Industries lourdes Politiques climatiques Ajustements carbone aux frontières Méta-analyse Méta-régression Industrie cimentière ARIMA Prais-Winsten LMDI Abatement Surallocation Efficacité énergétique Seuil de niveau d’activité
Keywords
Carbon leakage Competitiveness EU ETS Emissions Trading EITE in-dustries Climate Policy Border Carbon Adjustments Meta-analysis Meta-regression analysis Cement industry ARIMA Prais-Winsten LMDI Abate-ment Overallocation Energy efficiency Activity Level Threshold
Contents
Remerciements iii
Introduction 1
1 Climate policy and the “carbon haven” effect 13
1.1 Definitions . . . 15
1.2 Evaluation of carbon leakage . . . 21
1.3 Policies to address leakage and competitiveness concerns . . . . 25
1.4 Border Carbon Adjustments and the World Trade Organization 31 1.5 Conclusion . . . 35
2 Would border carbon adjustments prevent carbon leakage and heavy industry competitiveness losses? Insights from a meta-analysis of re-cent economic studies 53 2.1 Database description . . . 54
2.2 Descriptive Statistics . . . 55
2.3 Meta-regression analysis . . . 61
2.4 Discussion of the results . . . 68
2.5 Conclusion . . . 73
2.6 Appendix . . . 80
3 Carbon leakage and competitiveness of cement and steel industries un-der the EU ETS: much ado about nothing 87 3.1 Literature review . . . 88
3.3 Methodology and data . . . 93
3.4 Results . . . 102
3.5 Discussion . . . 115
3.6 Appendix . . . 125
4 Reaping the carbon rent: Abatement and overallocation profits in the European cement industry, insights from an LMDI decomposition anal-ysis 127 4.1 Mitigation options in the cement industry . . . 130
4.2 Methodology . . . 144
4.3 Changes in carbon emissions in the European cement industry . 152 4.4 Impact of the EU ETS on the cement industry . . . 159
4.5 Conclusion . . . 175
4.6 Appendix . . . 184
5 EU ETS, Free Allocations and Activity Level Thresholds: The devil lies in the details 191 5.1 ETS free allocation rules and gaming of ALTs . . . 195
5.2 Methodology and data . . . 199
5.3 Results . . . 210
5.4 Conclusions and policy options . . . 221
5.5 Appendix . . . 227
Liste des articles tirés de la thèse
Chapter 1: Branger, F., P. Quirion (2014). Climate policy and the “carbon haven” effect. WIREs Climate Change 5(1), 53-71.
Chapter 2: Branger, F., P. Quirion (2014). Would border carbon adjustments prevent carbon leakage and heavy industry competitiveness losses? Insights from a meta-analysis of recent economic studies. Ecological Economics 99, 29-39.
Chapter 3: Branger, F., P. Quirion and J. Chevallier (Forthcoming). Carbon leakage and competitiveness of cement and steel industries under the EU ETS: much ado about nothing. The Energy Journal.
Chapter 4: Branger, F., P. Quirion (2015). Reaping the carbon rent: Abate-ment and overallocation profits in the European ceAbate-ment industry, insights from an LMDI decomposition analysis. Energy Economics 47, 189-205.
Chapter 5: Branger, F., J-P. Ponssard, O. Sartor and M. Misato (Forthcoming). EU ETS, Free Allocations and Activity Level Thresholds. The devil lies in the de-tails. Journal of the Association of Environmental and Resources Economics.
List of Figures
1.1 Sectors classified “at risk of carbon leakage” in Europe (source: Grubb and Counsell (2010)). The size of the circles is propor-tional to the sector emissions. . . 19 1.2 Policy packages for sectors at risk of carbon leakage (source: Hood
(2010); Spencer et al. (2012)). . . 27 2.1 Leakage ratio in selected studies (mean, minimum and maximal
values with or without BCAs), ranked by mean value without BCAs . . . 56 2.2 Leakage ratio reduction in case of Border Carbon Adjustment
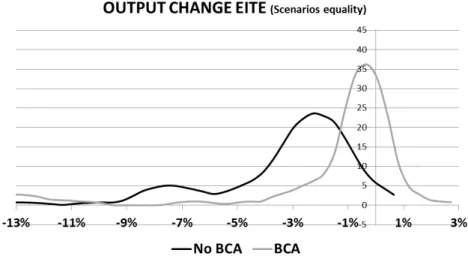
(same ranking as in figure 2.1) . . . 57 2.3 Output change of EITE industries in selected studies (ranked by
mean value without BCAs) . . . 58 2.4 Welfare variation in abating coalition (ranked by mean value
with-out BCAs) . . . 59 2.5 Leakage Ratio. “scenarios equality” merging . . . 60 2.6 Leakage Ratio. (Kernel density estimates) . . . 60 2.7 Output change of EITE industries (Kernel density estimates).
“scenarios equality” merging . . . 61 2.8 Output change of EITE industries (Kernel density estimates).
“articles equality” merging . . . 62 2.9 Welfare variation (Kernel density estimates). “scenarios
2.10 Welfare variation (Kernel density estimates). “articles equality” merging . . . 63 2.11 BCAs leakage reduction (in percentage points) . . . 63 3.1 CO2allowance price used in the regression . . . 102
3.2 Net Imports (Imports minus Exports) of Cement in the EU27 . 104 3.3 Net Imports (Imports minus Exports) of Steel in the EU27 . . . 105 3.4 Demand indicator variables used in the regression . . . 106 3.5 CUSUM test for cement and steel . . . 115 4.1 Clinker-to-cement ratio for the EU 28 and main European
coun-tries. Source: WBCSD GNR Database, variable 3213 . . . 136 4.2 Net imports (imports minus exports) of clinker relative to local
clinker production. Sources: Eurostat for net imports, EUTL and WBCSD GNR Database for production . . . 137 4.3 Origin of the EU 27 net imports. West Mediterranean comprises
Morocco, Algeria, Tunisia and Libya. Source: Eurostat . . . 137 4.4 Carbon intensity of the fuel mix (in kgCO2/GJ) for the EU 28
and main European countries. Source: WBCSD GNR Database, variable 3221 . . . 139 4.5 Thermal energy intensity in GJ per ton of clinker for the EU 28
and main European countries. Source: WBCSD GNR Database, variable 329. . . 141 4.6 Electrical energy intensity in kWh per ton of cement for the EU
28 and main European countries. Source: WBCSD GNR Database, variable 3212. . . 141 4.7 Electricity emission factor (in kgCO2/MWh) for the EU 27 and
main European countries. Source: Enerdata database . . . 143 4.8 Cement production in million tons for the EU 27 (right vertical
axis) and the main European countries (left vertical axis). Source: Computation from WBCSD GNR Database, EUTL database and Eurostat International Database . . . 149 4.9 LMDI decomposition analysis of cement emissions compared to
4.10 LMDI decomposition analysis of cement emissions compared to 1990. Germany . . . 155 4.11 LMDI decomposition analysis of cement emissions compared to
1990. France . . . 156 4.12 LMDI decomposition analysis of cement emissions compared to
1990. Spain . . . 157 4.13 LMDI decomposition analysis of cement emissions compared to
1990. the UK . . . 158 4.14 LMDI decomposition analysis of cement emissions compared to
1990. Italy . . . 158 4.15 LMDI decomposition analysis of cement emissions compared to
1990. Poland . . . 159 4.16 LMDI decomposition analysis of cement emission variations in
the EU 27, before and after the beginning of the EU ETS (2000-2005 and (2000-2005-2012) . . . 160 4.17 “Technological” abatement between 2005 and 2012. The bars
correspond to the “Freeze” scenario estimates (the top bar except for France) and the “Trend” scenario estimates (the bottom bar except for France). . . 163 4.18 Technological abatement in the EU ETS perimeter. The curves
on the left side show the abatement due to the different effects under the “Freeze” scenario (dotted line) and the “Trend” sce-nario (dashed line). The histogram on the right gives the sum of abatements over the years, in full color for the “Trend” scenario, and in full color plus faded color for the “Freeze” scenario. . . 164 4.19 Overallocation over time in the EU ETS perimeter. . . 169 4.20 Decomposition of the allowances surplus . . . 171 4.21 Overallocation profits and offset savings in the EU ETS
4.22 Technological abatement in Germany. The curves on the left side show the abatement due to the different effects under the “Freeze” scenario (dotted line) and the “Trend” scenario (dashed line). The histogram on the right gives the sum of abatements over the years, in full color for the “Trend” scenario, and in full
color plus faded color for the “Freeze” scenario. . . 186
4.23 Technological abatement in France. . . 186
4.24 Technological abatement in Spain. . . 186
4.25 Technological abatement in the UK. . . 187
4.26 Technological abatement in Italy. . . 187
4.27 Technological abatement in Poland. . . 187
4.28 Overallocation in Germany. . . 188 4.29 Overallocation in France . . . 188 4.30 Overallocation in Spain . . . 188 4.31 Overallocation in the UK . . . 189 4.32 Overallocation in Italy . . . 189 4.33 Overallocation in Poland . . . 189
5.1 The value of gaming. The installation engages in gaming when ΔX < ΔX0. I refers to the carbon intensity of the plant. Benefits are increased free allocations minus extra emissions. . . 197
5.2 Distribution of installations according to their activity level (ap-proximated by E/HEL) in 2012 for observed and counterfactual production. 2012CF stands for counterfactual of 2012. Red bars indicate categories just above thresholds . . . 211
List of Tables
2.1 Selected studies . . . 64 2.2 Meta-regression variables . . . 69 2.3 Meta-regression results. REML estimation . . . 70 2.4 Benefit transfer: leakage ratio estimations by the meta-regression
model . . . 81 2.5 Sensitivity analysis. Effect of the removal of outliers in the REML
estimation . . . 82 2.6 Sensitivity analysis. REML versus OLS cluster-robust estimation 83 2.7 Summary statistics for studies. Leakage Ratio . . . 84 2.8 Summary statistics for studies. Output change for EITE industries 85 2.9 Summary statistics for studies. Welfare variation for the abating
coalition . . . 86 3.1 Summary characteristics of the two sectors. Sources: (WCA,
2011; WSA, 2012; ICR, 2012; CWR, 2011; Carbon Trust, 2011a; Holmes et al., 2011) . . . 93 3.2 Summary statistics of the regression variables . . . 102 3.3 Regression estimations. Cement Net Import. ARIMA regressions 109 3.4 Regression estimations. Cement Net Import. Prais-Winsten
re-gressions . . . 110 3.5 Regression estimations. Steel Net Imports. ARIMA regression . 111 3.6 Regression estimations. Steel Net Import. Prais-Winsten
regres-sions . . . 112 3.7 Sensitivity Analysis (Cement) . . . 113
3.8 Sensitivity Analysis (Steel) . . . 114
3.9 Augmented Dickey-Fuller (ADF) tests for unit root . . . 125
4.1 Cement EUTL database. Country level (Sandbag database used for offset credits) . . . 135
4.2 Definition of variables . . . 146
4.3 Verification. Do the “Freeze” and “Trend” scenarios provide a good interval for changes in variables over time? Application on year 2005 for the EU 28 using 1990 and 2000 values. In this case, 2005 “Freeze” values are equal to 2000 values, and the trend rate is the one between 1990 and 2000. . . 162
4.4 Impact of different technological options on technological abate-ment . . . 165
4.5 Decomposition of phase II allowances surplus . . . 172
4.6 The major European cement producers were present in many different countries in 2012 . . . 175
5.1 Moderate (MD) and low demand (LD) countries in terms of ce-ment consumption in 2012 relative to 2007 levels . . . 200
5.2 Scenarios . . . 205
5.3 Data Sources . . . 206
5.4 Regression results of corrections at the plant level . . . 208
5.5 Production and Emissions for the observed (EXALTG) and coun-terfactual (EX, OBA, EXALTNG) scenarios . . . 212
5.6 The Free Allowances (MEUAs) under the four scenarios . . . . 213
5.7 Quantification of the monetary value of excess free allocations for the various scenarios. . . 214
5.8 Evidence of within-firm-country production shifting to meet thresh-olds. . . 216
5.9 Clinker net exports in 2010, 2011 and 2012 in LD and MD coun-tries in millions of tonnes. . . 216
5.10 Clinker-to-Cement Ratio in selected areas (source: authors’ anal-ysis). . . 217
Acronyms
ADF Augmented Dickey-Fuller ALCF Activity Level Correction Factor ALTs Activity Level Thresholds ARE Abatement Resource Effect
ARIMA AutoRegressive Integrated Moving Average BAT Best Available Technology
BCAs Border Carbon Adjustments BOF Basic Oxygen Furnace CCS Carbon Capture and Storage CDM Clean Development Mechanism CER Certified Emission Reduction CGE Computable General Equilibrium CSCF Cross Sectoral Correction Factor CSI Cement Sustainability Initiative CSR Corporate Social Responsibility EAF Electric Arc Furnace
EITE Energy-Intensive Trade Exposed ERU Emission Reduction Unit ETR Environmental Tax Reform EUA European Union Allowance
EU ETS European Union Emissions Trading System EUTL European Union Transaction Log
GATT General Agreement on Tariffs and Trade GDP Gross Domestic Product
GHG Greenhouse Gases
GNR Getting the Numbers Right GTAP Global Trade Analysis Project HAL Historical Activity Level
HEL Historical Emissions Level
ICAO International Civil Aviation Organisation
LD Low Demand
INDC Intended National Determined Contribution LMDI Log-Mean Divisia Index
MD Moderate Demand
MFN Most Favoured Nation
Mt Million tons
NT National Treatment
OBA Output-Based Allocation
OPEC Organization of Petroleum Exporting Countries PE Partial equilibrium
PPM Product and Production Method
PV Photovoltaics
REML Random Effect Multi-Level
SCM Subsidies and Countervailing Measures ULCOS Ultra Low Carbon Steel Making
UNEP United Nations Environmental Program
UNFCCC United Nations Framework Convention on Climate Change WBCSD World Business Council on Sustainable Development WTO World Trade Organization
Introduction
International negotiations have failed to achieve what standard economic theory recommended: imposing a globally uniform price on greenhouse gas emissions that approximate their social costs (Tirole, 2009), thereby achieving climate change mitigation in the most cost-effective way. Paris agreements in 2015 are expected to shape the post-2020 global climate architecture in a bottom-up approach, each country submitting an Intended National Determined Contribution1or INDC,
including goals and policies to achieve them. Climate policies have been and will continue to be uneven across the world, setting a challenge to move forward a low-carbon economy.
Indeed, one of the main reasons of the worldwide lack of ambitious climate poli-cies is the possible threat to the competitiveness of heavy industries and the result-ing carbon leakage. The asymmetry of carbon costs between regions may induce immediate losses of market share to the benefit of foreign competitors (opera-tional leakage) or in the longer run location of energy-intensive industries in re-gions with more favorable climate policies (investment leakage)(Reinaud, 2008). As a result, emissions would rise in non-constrained countries, causing so-called carbon leakage. As carbon dioxide is a global pollutant (i.e. the geographic loca-tion of emissions has no influence on its environmental impacts) it would weaken or nullify climate policy efficiency. Moreover, the additional cost generated by cli-mate policies may reduce the domestic industry’s market share, destroy jobs and reduce profits. Such adverse effects are grouped together under the heading of a 1What is included in INDC is at the discretion of the States. It may include short or long term
targets in terms of emissions or renewable capacites, policies to achieve these targets and other elements like need for international support or intended provision of finance (Ecofys, 2014).
loss in “competitiveness,” a term the popularity of which is inversely proportional to its clarity.
The risk of carbon leakage is not uniformally distributed across sectors, but is complex to assess as it depends on various mechanisms (Ecofys and Oko Insti-tut, 2013). First, the sector has to face a high carbon cost, which depends on its carbon intensity and its abatement potential. Second, imports and exports must be sensitive to domestic price, which depends on international trade barriers, bar-gaining power of the sector, products homogeneity and transportability. Finally, there must not be relevant substitutes with low carbon intensity. Because exports of electricity are very limited, the power sector is not exposed to carbon leakage, but it is different for the so-called energy-intensive trade exposed (EITE) sectors which include cement, iron and steel, aluminium, chemicals, pulp and paper, oil refining, glass or ceramics.
Political debates essentially focus on negative outcomes of unilateral climate policies related to global emissions and competitiveness, but positive aspects, mostly due to technological change and innovation, can also be highlighted. Porter and Van der Linde (1995) contested the established paradigm that strict environmen-tal regulation was necessarily harmful for business, and claimed that “properly crafted” regulation could enhance competitiveness through innovation. Jaffe and Palmer (1997) further distinguished the “weak” version (properly designed en-vironmental regulation fosters innovation) from the “strong” version (benefits of innovation can outweigh compliance costs so the overall impact on competitive-ness is positive) of the Porter Hypothesis. After twenty years of studies, a general consensus prevails to support the “weak” version while results are more mixed for the “strong” version (Ambec et al., 2013). Pioneering climate policies can also en-courage the development of new eco-industries. Domestic firms could then ben-efit from a First Mover Advantage (Lieberman and Montgomery, 1988) and seize export opportunities in new emerging markets. For example, the world leader in the wind power industry is the Danish company Vestas, which benefitted in its early stages of development from the ambitious national wind policy. At the same time, the competitive advantage of climate pioneers is not guaranteed, and dom-inant positions in industries featuring fast technical progress are fragile. Finally, the diffusion of low carbon technologies outside the carbon constrained region,
called climate spillovers (Golombek and Hoel, 2004), generates negative leakage. Renewable installed capacities in China (which has become the world leader in wind installed capacities since 20102and is soon to become the leader in
photo-voltaics installed capacities) would certainly not be as high had feed-in tariffs not been implemented in Europe and in the United States.
Because of the EITE industries’ influence over the policy process, specific mea-sures to protect these sectors are systematically integrated in climate policy pack-ages. Broadly defined, the main two options are Border Carbon Adjustments (BCAs), which consist in reducing the carbon price differentials of the goods traded be-tween countries, and free allocation of allowances or tax exemptions. More specif-ically, free allocation can be based on ex ante rules only (being computed with historical emissions, or historical production multiplied by a benchmark) or fea-ture ex post adjustments (based on actual production, such as output-based al-location (OBA)). BCAs, which have been intensively discussed but never been implemented, will be discussed in Chapters 1 and 2. OBA, which have been im-plemented in the California carbon market since 2012, will serve as reference in Chapters 4 and 5.
In the major part of this thesis, the impact of climate policies on energy-intensive industries will be tackled through the example of the cement sector in the Euro-pean Union Emissions Trading System (EU ETS). The unique age and size of the EU ETS, implemented in 2005, offers a natural field experiment. In addition, as the cement sector is highly carbon-intensive, the issues of carbon leakage, com-petiveness and free allocation rules are magnified. Before detailing the plan of the thesis, we will then provide some insights on the EU ETS and on the cement sec-tor.
The cement sector represents 5% of global anthropogenic emissions and about 9% of emissions covered by the EU ETS. After reaching a peak in 2008 with 260 Mt, European cement production was severely impacted by the economic reces-sion and never recovered (we estimate the production in 2013 at 180 Mt). Ce-ment manufacture can be divided into two main steps: clinker production (90% to 95% of emissions, virtually all from direct emissions), and blending and grinding clinker with other material to produce cement (indirect emissions due to
ity use). The two broad options to decrease cement carbon intensity are then to either decrease clinker carbon intensity or reduce the clinker-to-cement ratio. In-deed, clinker substitutes such as blast furnace slag, fly ash or pozzolanas (volcanic rocks), being by-product of other industries or natural resources, have a much lower carbon intensity than clinker. Options to reduce clinker carbon intensity are limited by the fact that two third of emissions are process emissions that cannot be reduced. Only breakthrough technologies such as carbon capture and sequestra-tion (CCS), or innovative cements not based on clinker, could significantly lower cement carbon intensity in the long run. Cement is very carbon-intensive and is a homogenous product. However, the industry presents other characteristics po-tentially limiting the risk of carbon leakage. It is poorly traded internationally, be-cause of its bulkiness and bebe-cause the raw material, limestone, is present virtually everywhere in the world. Besides, the cement sector is very oligopolistic and has regularly faced sanctions from national competition authorities. Producers have relatively high market power, especially inland compared to near the coasts be-cause of transportation costs.
The EU ETS, presented as the “flagship” or “cornerstone” of the European cli-mate policy, has celebrated its tenth anniversary in 2015. It covers approxicli-mately 45% of European emissions with a global cap of around 2 GtCO2spread across
approximately 11,000 installations.3Beside domestic aviation, added in 2012, the
covered sectors can be broadly distinguished between power and heat on the one hand, and manufacturing sectors on the other hand. The functioning of a cap-and-trade system goes as follows. First, allowances are auctioned or distributed to installations, the total amount of them being fixed by a global cap. Then, entities can buy or sell allowances to cover their emissions, and a carbon price emerges through supply and demand. The flexibility that trading brings is supposed to en-sure that emissions are cut in the most cost-effective way. Direct sale of allowances by auctioning has significant economic advantages over free allocation (Hepburn et al., 2006). For example, the value of the auction revenues can be used to re-duce other distortionary taxes and improve macroeconomic efficiency. Mean-while, auctioning avoids windfall profits to polluters, incumbent and new firms are treated on an equal basis, and many other distortions that arise with free
cation are avoided. However, in a world of uneven climate policies, free allocation is seen as necessary to mitigate carbon leakage.
After a first test phase (2005-2007) and a second phase corresponding to the period of compliance to the Kyoto protocol (2008-2012), the third phase started in 2013 and will last until 2020. Each phase is characterized by different rules, the most critical being whether allowances are auctioned or freely allocated to installa-tions, and in the latter case the way they are distributed. Rules of the fourth phase (2020-2030) are currently under discussion, while those of the third phase will hardly be modified. For phase III, a list of sectors “deemed to be exposed to carbon leakage” was established using two quantitative indicators: the share of carbon costs relative to value added (using a CO2price of 30 euros per ton) and the trade
intensity (imports plus exports in value divided by market size). These sectors, which represent the overwhelming majority of manufacturing emissions, receive free allocation based on historical production multiplied by sectoral benchmarks.4 The EU ETS has been the largest implemented carbon market and the world-wide reference in terms of cap-and-trade policy, setting an example for other car-bon pricing initiatives (World Bank & Ecofys, 2014). However, this leadership position is increasingly being challenged. First, China should surpass the EU in terms of carbon market size in the following years, as the largest emitter on the planet will most likely implement a nationwide emissions trading system (Zhang, 2015). Second, a severe crisis and the inability of European authorities to engage meaningful structural reforms have undermined the system (Branger et al., 2015). A massive surplus of allowances, corresponding to more than a year of emissions, combined with the uncertainty in the stringency of long term targets, have driven down the carbon price. The latter has stayed below eight euros since 2012, pared to around 25 euros in mid-2008. The surplus of allowances is due to a com-bination of factors (Koch et al., 2014): the economic downturn, the effectiveness of renewable energy policies and the inflow of a significant number of cheap inter-national credits. However, concerns about carbon leakage and competitiveness have aggravated the price drop by: (i) first reducing the environmental ambition 4In addition, a cross-sectoral correction factor (CSCF) is applied, equal to 0.9427, then
declin-ing at 1.74% per year. It ensures that the total amount of free allocation relative to the cap does not overcome a certain value. Finally, the activity level threshold (ALTs) rules reduce free allocation in case of important activity reduction (see Chapter 5).
of the EU ETS, and (ii) delaying market reforms intended to strengthen the car-bon price signal.
We now turn to the plan of this thesis, which is structured around five indepen-dent chapters, corresponding to five published articles. Except for Chapters 1 and 2 which are advanced literature reviews essentially on ex ante studies, we adopt an ex post empirical approach in this thesis. Slight cuts have been made in the original articles in order to avoid redundancies, as well as minor updates related to policy issues and references.
Chapter 1 provides an in-depth literature review on carbon leakage and issues of competitiveness linked to uneven climate policies, and can be seen as an exten-sion of this introduction. After a definition of key concepts, studies assessing the risk of carbon leakage are reviewed. We point out a discrepancy between ex ante (mostly CGEs models) and ex post studies (one of which being the chapter 3). Ex ante studies forecast a carbon leakage ratio (which corresponds to the emissions increase in the rest of the world related to home abatement) of 5-25% while ex post studies find no empirical evidence of carbon leakage. Policy packages address-ing leakage and competitiveness issues are discussed, with an emphasis on BCAs. Models show that BCAs restore competitiveness of domestic energy-intensive in-dustries and partially reduce carbon leakage, but have important distributional ef-fects, shifting a part of the burden from the abating coalition to third countries. To implement BCAs, a series of technical choices have to be made, such as sectoral coverage, geographical coverage, inclusion of indirect emissions or exports, car-bon content, or use of revenues. These choices would be crucial for the compati-bility of BCAs with the World Trade Organization (WTO), which remain highly contentious among legal experts. Two past events, the WTO Shrimp-Turtle dis-pute and the attempt of inclusion of aviation in the EU ETS, shed some light on possible outcomes of unilateral imposition of BCAs. We argue that factors of suc-cess for their implementation include in-depth discussions with third countries on BCAs features prior to their implementation, flexibility provided to impacted countries to achieve comparable policies, relatively conservative values of carbon content and the altruistic use of revenues (handed back or routed to the Green Climate Fund).
perspec-tive, by investigating ex ante studies in energy-economy modelling assessing car-bon leakage and competitiveness losses in energy-intensive industries. Following best practice guidelines of Nelson and Kennedy (2009), the meta-analysis aggre-gates 25 studies dating from 2004 to 2012 which included BCAs in one of their scenarios, altogether providing 310 estimates of carbon leakage ratios. First, de-scriptive statistics are presented. Kernel density estimations showing probabil-ity distributions of estimates are used to merge results across studies. A meta-regression analysis is then performed to explore the impact of different assump-tions on the leakage ratio estimates, such as the size of the coalition, the abatement target, Armington elasticities (modelling international trade) and BCAs features. We find that, all other parameters being constant, BCAs reduce the leakage ratio by six percentage points. We also give statistical evidence that augmenting the size of the abating coalition reduces the leakage ratio while increasing the abatement target augments the leakage ratio. Finally, in the meta-regression, the inclusion of all sectors and the presence of export rebates appear to be the two most efficient features to reduce leakage, followed by the adjustment level based on foreign car-bon content.
Following the previous quantitative survey of ex ante literature on carbon leak-age, we contribute to the literature on ex post studies in Chapter 3 by investigating a potential competitiveness-driven operational carbon leakage due to the Euro-pean Union Emissions Trading scheme (EU ETS). We focus on the two largest CO2emitters among European manufacturing sectors, cement and steel, and the
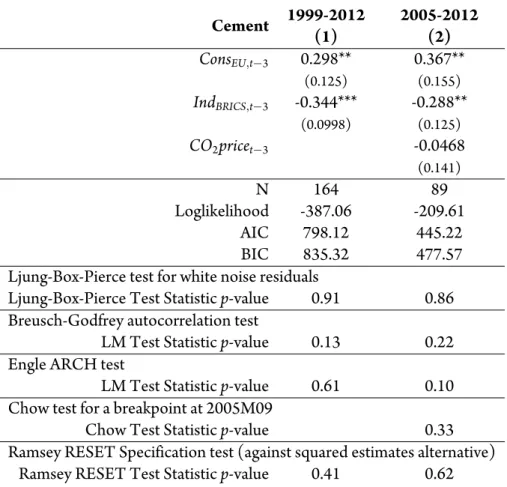
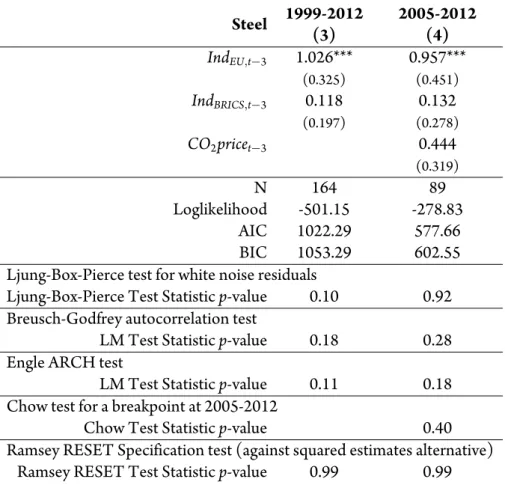
first two phases of the EU ETS (2005 to 2012). From a simple analytical model, an equation is obtained linking net imports (imports minus exports) of cement and steel to local and foreign demand along with carbon price. The model plies that there should be a positive correlation between carbon price and net im-ports. The econometric estimation of this relation is made with two different econometric techniques, ARIMA and Prais-Winsten, which provide consistent re-sults. Local and foreign demand are robust drivers of trade flows, but no signifi-cant effect of the carbon price on net imports of steel and cement is found. We conclude that there is no evidence of carbon leakage in these sectors, at least in the short run. These industries have benefitted from a large overallocation of
al-lowances during this period, but free alal-lowances bear an opportunity cost.5
There-fore, provided one considers standard economic theory valid (companies behav-ing as profit-maximizers), the overallocation of allowances should not have had an influence on operational leakage. Our results would then suggest that within the historical price range for CO2(below 30 euros per ton), operational carbon
leakage is not a serious threat for the energy-intensive industries.
Chapter 4 presents a detailed study on the European cement sector, made by cross-referencing the Getting the Numbers Right (GNR), database developped by the Cement Sustainability Initiative and the registry of the EU ETS, the Euro-pean Union Transaction Log (where we collected plant-by-plant information on 276 cement plants). The variations of emissions from 1990 to 2012 are broken down using the Log-Mean Divisia Index (LMDI) method (Ang, 2004), both at the EU level and at the national level for six major producers (Germany, France, Spain, the United Kingdom, Italy and Poland). This method allows measuring the impact of seven effects on emission variations, which correspond to different mit-igation levers that were previously discussed: activity, clinker trade, clinker share, alternative fuel use, thermal and electrical energy efficiency, and decarbonisation of electricity. We demonstrate that most of the emission changes in the EU 27 can be attributed to the activity effect though since the 1990s, there has been a slow trend of emission reductions mostly due to the clinker share effect (decrease in the clinker-to-cement ratio), the fuel mix effect and the electricity emission factor ef-fect. Making assumptions on counterfactual scenarios, the abatement induced by the EU ETS is estimated at 2.2%± 1.3% from 2005 to 2012, mostly because of a small acceleration in clinker reduction and alternative fuel use. However, we can-not exclude that these effects were due to the rise in energy prices rather than the EU ETS. Decomposing the allowance surplus allows assessing overallocation and thus overallocation profits. We estimate that the cement industry reaped 3.5 bil-lion euros of overallocation profits during phases I and II, mainly because of the slowdown in production, while allowance caps were unchanged. This figure re-5As long as they are allocated independently of current output (which is the case except
par-tially for 2012, see Chapter 5), the operator of an installation may reduce emissions in order to sell allowances even though he has received more allowances than its emissions (Montgomery, 1972). Free allocation would be inefficient at preventing leakage in the short term and would only provide a disincentive to plant relocation (Wooders et al., 2009).
lated to production represents a very significant amount of the margins observed in the sector (Boyer and Ponssard 2013). Presented at first as a threat to com-petitiveness, the EU ETS has paradoxically boosted European cement industry profitability.
European authorities modified the allocation rules with the intention to reduce excess free allocation in low-activity plants. After 2012, whenever the activity level of an installation falls below some threshold (50%, 25%, 10%) relative to its his-torical activity level, the allocation would be reduced accordingly (50%, 25%, 0%). For installations operating below the threshold, the financial gain from “artificially” increasing output to reach the threshold may outweigh the costs, particularly in carbon intensive sectors. We show in Chapter 5, exploiting the constituted EUTL cement installation-level database, that cement companies strategically reacted to this activity level thresholds (ALTs) rule in order to maintain a high amount of free allocation. The quantification of distortions due to the thresholds necessi-tates the elaboration of a counterfactual scenario for 2012, which is developed by using a panel data model combining historical data at the country and plant level. We estimate that in 2012, ALTs induced 6.4Mt of excess clinker production (5% of total EU output), which corresponds to 5.8Mt of excess CO2 emissions (over 5% of total sector emissions). The distortion effects are magnified in crisis-hit countries with low demand, especially in Spain and Greece. As intended, ALTs do reduce overallocation (by 6.4 million allowances) relative to a scenario with-out ALTs, but this gain is small compared to an with-output based allocation method, which would further reduce overallocation by 40 million allowances (29% of to-tal cement sector free allocation). We then show, revisiting preliminary evidence from Neuhoff et al. (2014), that in order to avoid distubing local markets while increasing production, cement companies (i) shifted production among nearby plants, (ii) exported clinker or cement to other markets (iii) increased the clinker-to-cement ratio. As the decrease of the latter was the main levy of emissions re-duction in the sector (see Chapter 4), the operational distortions due to the intro-duction of ALTs are particularly detrimental. These considerations suggest that the ALTs rule may need to be reconsidered for sectors such as cement for which carbon costs represent a significant share of production costs. A relatively easy-to-implement solution for the short term would be to easy-to-implement full output-based
allocation.
The main argument of this thesis is that competitiveness, which was called a “dangerous obsession” for macroeconomic policy by Krugman (1994), may be so for climate policy as well. The pursuit of carbon leakage mitigation has con-tributed to make the EU ETS an administrative nightmare which fails to give a clear signal towards low carbon transition. In the conclusion, we will discuss pos-sible reforms and propose directions for future research.
References
Ambec, S., Cohen, M. A., Elgie, S., and Lanoie, P. (2013). The Porter Hypoth-esis at 20: Can Environmental Regulation Enhance Innovation and Compet-itiveness? Review of Environmental Economics and Policy, 7(1):2–22. doi: 10.1093/reep/res016.
Ang, B. W. (2004). Decomposition analysis for policymaking in energy: which is the preferred method? Energy Policy, 32(9):1131–1139. doi: 10.1016/ S0301-4215(03)00076-4.
Branger, F., Lecuyer, O., and Quirion, P. (2015). The European Union Emis-sions Trading Scheme: should we throw the flagship out with the bathwater?: The EU ETS: Throw the Flagship with the Bathwater? Wiley Interdisciplinary Reviews: Climate Change, 6(1):9–16. doi: 10.1002/wcc.326.
Ecofys (2014). Intended Nationally Determined Contributions under the UN-FCCC. Discussion Paper.
Ecofys and Oko Institut (2013). Support to the Commission for the determina-tion of the list of sectors and subsectors deemed to be ex- posed to a significant risk of carbon leakage for the years 2015-2019 (EU Emission Trading System).
Golombek, R. and Hoel, M. (2004). Unilateral Emission Reductions and Cross-Country Technology Spillovers. Advances in Economic Analysis & Policy, 3(2). doi: 10.2202/1538-0637.1318.
Hepburn, C., Grubb, M., Neuhoff, K., Matthes, F., and Tse, M. (2006). Auc-tioning of EU ETS phase II allowances: how and why? Climate Policy, 6(1):137–160. doi: 10.1080/14693062.2006.9685592.
Jaffe, A. B. and Palmer, K. (1997). Environmental Regulation and Innovation: A Panel Data Study. Review of Economics and Statistics, 79(4):610–619. doi: 10.1162/003465397557196.
Koch, N., Fuss, S., Grosjean, G., and Edenhofer, O. (2014). Causes of the EU ETS price drop: Recession, CDM, renewable policies or a bit of everything?—New evidence. Energy Policy, 73:676–685. doi: 10.1016/j.enpol.2014.06.024. Krugman, P. (1994). Competitiveness: A Dangerous Obsession. Foreign Affairs,
73(2):28–44. doi: 10.2307/20045917. ArticleType: research-article / Full publication date: Mar. - Apr., 1994 / Copyright © 1994 Council on Foreign Relations.
Lieberman, M. B. and Montgomery, D. B. (1988). First-mover advantages. Strate-gic Management Journal, 9(S1):41–58. doi: 10.1002/smj.4250090706. Montgomery, W. (1972). Markets in Licences and Efficient Pollution Control
Programs. Journal of Economic Theory, pages 385–418.
Nelson, J. P. and Kennedy, P. E. (2009). The use (and abuse) of meta-analysis in environmental and natural resource economics: an assessment. Environmental and Resource Economics, 42(3):345–377.
Neuhoff, K., Vanderborght, B., Ancygier, A., Atasoy, A. T., Haussner, M., Ismer, R., Mack, B., Martin, R., Ponssard, J.-P., Quirion, P., van Rooij, A., Sabio, N., Sartor, O., Sato, M., and Schopp, A. (2014). Carbon Control and Competi-tiveness post 2020: The Cement Report, Climate Strategies.
Porter, M. E. and Van der Linde, C. (1995). Toward a New Conception of the Environment-Competitiveness Relationship. The Journal of Economic Perspec-tives, 9(4):97–118. doi: 10.2307/2138392. ArticleType: research-article / Full publication date: Autumn, 1995 / Copyright © 1995 American Economic Association.
Reinaud, J. (2008). Issues behind Competitiveness and Carbon Leakage. Focus on Heavy Industrys. IEA Information Paper, International Energy Agency, OECD/IEA Paris.
Tirole, J. (2009). Politique climatique: une nouvelle architecture internationale. Wooders, P., Cosbey, A., and Stephenson, J. (2009). Border Carbon Adjustments and Free Allowances : Responding to Competitiveness and Leakage Concerns, OECD.
World Bank & Ecofys (2014). State and Trends of Carbon Pricing.
Zhang, Z. (2015). Crossing the River by Feeling the Stones: The Case of Carbon Trading in China. FEEM Nota di lavoro 19.2015.
1
Climate policy and the “carbon haven”
effect
The Kyoto Protocol has been an attempt to set a global climate architecture aimed at abating carbon emissions on a global scale. The commitment period of the protocol ended in 2012 with mixed results. While abating technologies have im-proved, in particular renewable energies, the world’s CO2emissions reached a
record in 2011 with 31.6 Gt1, an increase of 50% compared to 1990 emissions, and are likely to keep increasing in the next decade. Despite the growing emer-gency of serious climate change impacts, international negotiations are blocked because of strong free-riding incentives (Carraro and Siniscalco, 1993), lobbying from energy intensive sectors and equity concerns about the North-South burden sharing. Climate policies will remain sub-global in the years to come, and unilat-eral or regional policies, including regulations, subsidies, carbon taxes and carbon
1https://www.iea.org/newsroomandevents/pressreleases/2013/june/
markets, have emerged as some industrialized countries decided unilaterally to re-duce their emissions. The top-down global Kyoto approach is shifting towards a bottom-up architecture with different CO2prices (Rayner, 2010; Weischer et al.,
2012).
In a world with uneven climate policies, the carbon price differentials across re-gions modify production costs and may shift the production of energy-intensive goods from carbon-constrained countries to “carbon havens”, or countries with laxer climate policy. Since a decrease in emissions in one part of the world leads to an increase in emissions in the rest of the world, this phenomenon is referred to as carbon leakage. The Pollution Haven effect, that is, the migration of dirty in-dustries to countries with less stringent regulations, is one of the most contentious debates in international economics (Taylor, 2005). A major difference exists be-tween local pollutants, which constitute the overwhelming part of studies in the pollution haven literature, and CO2. CO2is a global stock pollutant: the
geo-graphic location of emissions does not matter (Siikamäki et al., 2012b). A pro-duction shift would then reduce the environmental benefits of the policy while potentially damaging the economy.
In the context of growing globalisation, environmental policies can also have a strategic role. The fierce competition to attract foreign direct investment or the threat of industrial relocation could lead to a “regulatory chill” or even a “race-to-the bottom”, depending on “race-to-the willingness of countries to downgrade environ-mental standards. Indeed, the fear of carbon leakage and loss of competitiveness in energy-intensive industries are the main arguments against ambitious climate policies in industrialized countries. Modest mitigation targets have gone hand in hand with policy packages intended to protect sectors at risk of carbon leakage (mainly cement, iron and steel, aluminium and oil refineries). In the European Union Emission Trading System (EU ETS), the biggest carbon pricing experi-ment so far, tradable allowances are distributed free of charge for these sectors . In the US, the Waxman-Markey proposal, which was adopted by the House of Rep-resentatives in 2009 but not by the Senate, would have introduced a nationwide carbon market with measures to face these issues: allowances distributed freely on the basis of current output (output-based allocation) and border carbon adjust-ment (BCA). The latter, aimed at “levelling the carbon playing field”, is widely
discussed among politicians, business leaders and academics. However, it is of-ten considered as protectionism disguised as green policy (Evenett and Whalley, 2009) among developing countries, and its World Trade Organisation compati-bility remains contentious. The political outcome of its implementation is highly uncertain. BCA may increase the incentives of third countries to join the abat-ing coalition but may also create international friction and lead to tit-for-tat trade retaliations (Bordoff, 2009; of Foreign Trade, 2010). The recent setbacks of the inclusion of aviation in the EU ETS are a reminder that any attempt to regulate emissions outside a country’s jurisdiction is extremely problematic: foreign air-lines and governments complained aboutthis inclusion, which pushed the EU to delay the inclusion of international flights by one year. Whether this inclusion will take place at the end of the delay period is still unclear.
This chapter provides a literature review on competitiveness and carbon leak-age issues from an economic, political and legal perspective. First, section 1.1 gives the definition of the main terms involved. Section 1.2 provides an evaluation of the carbon leakage risk, distinguishing ex ante Computable General Equilibrium (CGE) modelling from ex post econometric studies. Section 1.3 examines the policies aimed at reducing carbon leakage and competitiveness losses with an em-phasis on Border Carbon Adjustment. Since the consistency of BCA with WTO is a decisive matter, it is discussed in further detail in section 1.4. Section 1.5 con-cludes.
1.1
Definitions
1.1.1 Carbon leakageWhile competitiveness concerns and carbon leakage are often associated, they are two distinct phenomena. Carbon leakage is the increase of emissions in the rest of the world when a region implements a climate policy, compared to a situation where no policy is implemented (Quirion, 2010). It can be measured by the leak-age rate or leakleak-age-to-reduction ratio, which is the rise in emissions in the rest of the world divided by the abated emissions in the region that has adopted a climate policy. A 50% leakage-to-reduction ratio means that half of the mitigation effort
is undermined by the increase of emissions in the rest of the world, and not the misguided interpretation that 50% of emissions have “leaked” in the rest of the world. If this ratio is under 100%, emissions have decreased on a global scale, so the policy is environmentally beneficial. A ratio above 100% is theoretically pos-sible, because the carbon intensity of CO2-intensive products can be higher in the
rest of the world, but has only been found in one outlier model (Babiker, 2005). Estimates of leakage rates are typically in a range of 5%-20% depending on many factors (see below). Carbon leakage occurs through two main channels: the com-petitiveness channel and the international fossil fuel price channel (Dröge, 2009). The root of the competitiveness channel is that the cost of compliance gives a com-parative disadvantage for regulated firms vis-à-vis their competitors. This change of relative prices can lead to a change of the trade balance (less exports and more imports). In the short term, this would correspond to a change of the utilisation rate of existing capacities (operational leakage), while in the long term, it would correspond to a change in production capacities (investment leakage). These changes induce a shift of production, and then of emissions, from the regulated part of the world to the unregulated part of the world. Besides, abating countries almost necessarily have to cut their fossil fuel consumption, which drives down the international prices of carbon-intensive fossil fuels: coal, oil and, perhaps even more, non-conventional fossil fuels (Persson et al., 2007). This decrease in prices reduces the net cost of climate policies in fuel-importing abating countries since a part of abatement is borne by fossil fuel exporters who lose a part of their rents. However it leads to a rise of their consumption in countries with less stringent policies. Because of international energy markets, the shrink in consumption in one region involves an increase in consumption in the rest of the world, caus-ing carbon leakage through the international fossil fuel price channel. Yet two caveats are in order. First, CO2capture and storage (CCS) does not reduce fuel
consumption. Quirion et al. (2011) show that for this reason, CCS brings down carbon leakage compared to a climate policy providing the same abatement with-out CCS. Second, the world oil market is dominated by OPEC, and alternative assumptions about OPEC’s behaviour lead to opposite results regarding leakage through the oil market, which can even become negative (Bohringer et al., 2014). The same reasoning applied to the whole world but with two temporal periods is
known as the Green Paradox (Sinn, 2008; Eisenack et al., 2012) which could be considered inter-temporal leakage: a rising CO2price would be seen as a future
resource expropriation by fossil fuel owners who would then increase resource ex-traction. Yet, although the mechanism of the Green Paradox is well understood, its quantitative importance decreases when realistic features are included in the models (Gerlagh, 2010). Despite the overwhelming importance of the competi-tiveness channel in the climate policy debate, in virtually all models including the two channels, the international fossil fuel price channel predominates (Gerlagh and Kuik, 2007; Fischer and Fox, 2012; Boeters and Bollen, 2012; Weitzel et al., 2012).
1.1.2 Competitiveness
The term “competitiveness” has been used in numerous studies, reports and arti-cles and underlies economic policies. However, this concept is difficult to define and susceptible to ambiguities. At a firm or sectoral level, competitiveness can refer to “ability to sell” or “ability to earn”. Competiveness as “ability to sell” is the capacity to increase market share, and can be measured through indicators in-volving exports, imports and domestic sales (Alexeeva-Talebi et al., 2007). Com-petitiveness as “ability to earn” is the capacity to increase margins of profitabil-ity, and can be measured with indicators involving some measures of profit or stock values. Distinguishing these two notions is useful since the same climate policy can have different impacts on both. For instance, distributing free emis-sion allowances based on historic data only, as is the case in the US SO2 ETS (Schmalensee and Stavins, 2013), increases the ability to earn but not the ability to sell, since an operator can close a plant and continue to receive the same amount of allowances. Hence, only competitiveness as ability to sell may generate leakage. The notion of competitiveness at the national level is controversial, and is con-sidered meaningless by some economists, such as (Krugman, 1994). The main in-dicator is the balance of trade, that is, the difference between the monetary value of exports and imports, but an increase in the balance of trade may result from many factors, some of which are completely unrelated to the competitiveness of domestic firms, like a contraction in domestic demand. Whether climate policies
have to protect competitiveness at a national level or at a sectoral level is a legiti-mate question. EU ETS sectors contribute 40% of EU emissions, but less than 5% of its Gross Domestic Product (GDP) and an even smaller share of its jobs (Eller-man et al., 2010). The sectors at risk of carbon leakage (see below) account for slightly more than 1% of GDP in the UK (Hourcade et al., 2007) and 2% in Ger-many (Graichen et al., 2008). However, they account for a much higher share of Greenhouse Gas (GHG) emissions so protecting their competitiveness in order to limit leakage cannot be discarded prima facie.
1.1.3 Sectors at risk
All sectors do not face the same risk of carbon leakage. The risk is higher if the carbon cost is high and the international competition is fierce. Hence, in the at-tempt to classify sectors exposed to carbon leakage, two indicators are generally used, one measuring the carbon cost and the other the trade intensity. For the EU ETS, the carbon cost is measured by the value at stake, defined as the carbon costs relative to the gross value added of a given industrial sector. The trade inten-sity is measured by the ratio in values between imports plus exports and the EU total market size. A sector is considered at risk if one or both of these indicators is above a certain threshold (see Figure 1.1). Table 1 shows the different indica-tors and thresholds to identify secindica-tors at risk in the EU, the US and Australia. The most vulnerable sectors, usually gathered around the common denomination of Energy Intensive Trade Exposed (EITE) sectors, include iron and steel, cement, refineries and aluminium. The EITE sectors are well-organized and constitute a strong lobby that has managed so far to influence climate policies. Indeed, all cli-mate policies have provided more favourable rules for these sectors compared to others. In addition, these “specific rules” are generally more favourable in the final amendments than in first drafts (CEO, 2010). The classification of sectors in itself (which sectors are at risk and which are not), because of its economic impacts, is subject to political and academic controversy and face strong industrial lobbying (Clò, 2010; Martin et al., 2014).
Figure 1.1: Sectors classified “at risk of carbon leakage” in Europe (source:
Grubb and Counsell (2010)). The size of the circles is proportional to the sector emissions.
1.1.4 Positive impacts of climate policies on competitiveness and abatement in foreign countries
Though the political debate has focused on the negative impacts of climate poli-cies, some authors argue that at least in some sectors or firms, stringent environ-mental regulations can force firms to be more efficient in their processes, and then more competitive. This is referred to as the Porter hypothesis (Porter and Linde, 1995), which is highly controversial but has been corroborated in Europe by a re-cent econometric study (Costantini and Mazzanti, 2012). Further, it is possible to highlight two mechanisms symmetrical of carbon leakage and competitiveness losses: climate spillovers and first mover advantage.
Environmental regulations foster innovation and generate technological progress in GHG savings technologies (Newell et al., 1999; Jaffe et al., 2002; Dechezleprêtre et al., 2008). Diffusion of these technologies reduces emissions in non-abating countries and then creates negative leakage, or positive climate spillover (Ger-lagh and Kuik, 2007; Maria and Werf, 2008; Golombek and Hoel, 2004; Bosetti et al., 2008). There is empirical evidence of climate spillovers, especially in energy-saving technologies (Popp, 2002), but also in renewables. Feed-in tariffs in Den-mark, Germany and Spain generated a massive induced technical change in wind and solar technologies (Peters et al., 2012) and are thus in part responsible for the spectacular development of windpower capacities in China, which became the world leader in terms of windpower installed capacities, shifting from 2.6 GW in 2006 to 75 GW in 2012 (Roney, 2013). Another, yet even more difficult to quan-tify source of negative leakage is the international diffusion of climate policies: im-plementing any new policy involves some risks, and observing climate policies in other countries allows reducing these risks and possibly avoiding some mistakes. Just as the EU has closely observed the US SO2 cap-and-trade to set up the EU ETS, subsequent ETS developments have benefited from the EU ETS experience. The same stands for other climate policies such as renewable subsidies (especially feed-in-tariffs pioneered by Denmark and then Germany) and energy efficiency regulations.
Finally, Baylis et al. (2014) have recently identified a new mechanism gener-ating negative leakage, which they label the Abatement Resource Effect (ARE).
The intuition is that when a climate policy reduces emissions in one part of the economy, it may draw factors of production away from other, carbon-intensive activities. The authors show that if this effect is strong enough, an economy may exhibit negative net leakage in response to the policy change. While the possibility of negative leakage through this mechanism is not disputed, (Carbone, 2013) as well as (Winchester and Rausch, 2013) have recently assessed the ARE in more complex models and conclude that the negative leakage due to the ARE is more than offset by positive leakage mechanisms.
Technological knowhow in climate-related technologies gained by domestic firms could be used to capture market share in emerging markets (first-mover ad-vantage). If other countries join the abating coalition, these firms have a compar-ative advantage vis-à-vis their competitors. This ability to gain market share by being the first to develop a technology is the first mover advantage. Emerging in models (Pollitt et al., 2015), it could be considered a long-term competitiveness factor. The clearest case concerns the EU wind industry, which is the dominant supplier in all word markets except China, due to the already mentioned feed-in-tariffs implemented in the 1990s. However, while Germany benefited from a first-mover advantage the Photovoltaic (PV) industry until 2011, the German PV in-dustry has since been largely surpassed by China, showing how fragile a dominant position can be in industries featuring fast technical progress (Kazmerski, 2011).
1.2
Evaluation of carbon leakage
1.2.1 Ex ante studiesClimate change mitigation policies are diverse and include various forms of regu-lations, subsidies, carbon taxes and emission trading systems (ETS). Yet carbon leakage has mostly been assessed for ETS and carbon taxes. There is extensive lit-erature assessing ex ante carbon leakage from hypothetical carbon taxes or ETS that can be traced back to Felder and Rutherford (1993). The majority of these studies rely on Computable General Equilibrium (CGE) models (Böhringer et al., 2012a; Mattoo et al., 2009; Fischer and Fox, 2012; Dissou and Eyland, 2011; Lanzi et al., 2012; Balistreri and Rutherford, 2012; Peterson and Schleich, 2007), but
some use partial equilibrium models (Gielen and Moriguchi, 2002; Mathiesen and Maestad, 2004; Monjon and Quirion, 2011; Demailly and Quirion, 2006, 2008). CGE models, which simulate the behaviour of entire economies, are pertinent to study the effect of policies on trade in different sectors (Kehoe et al., 2005) but they generally rely on more aggregated data (almost exclusively the Global Trade Analysis Project database) that may hide impacts on more specific sectors (Si-ikamäki et al., 2012a; Alexeeva-Talebi et al., 2012). Moreover, most CGE models feature a zero-profit condition so cannot assess competitiveness as ability to earn. An exception is Goulder et al. (2010) whose model features capital adjustment costs, which implies that capital is imperfectly mobile across sectors and allows the model to capture the different impacts of policy interventions on the profits of various industries. Assessing a hypothetical federal ETS in the US, the authors conclude that freely allocating fewer than 15% of the emissions allowances gen-erally suffices to prevent profit losses in the most vulnerable industries. Freely allocating all of the allowances substantially over-compensates these industries.
These models provide a wide range of estimations for leakage and competitive-ness losses (as ability to sell). First, results depend on scenario hypotheses: the bigger the abating coalition, the smaller the leakage rate while the more ambitious the target, the higher the leakage. Linking carbon markets within the abating coali-tion (Lanzi et al., 2012), authorizing offset credits (Böhringer et al., 2012a) or ex-tending carbon pricing to all GHG (Ghosh et al., 2012) increases economic effi-ciency and then reduces leakage. Second, the models are very sensitive to two sets of parameters: fossil fuel supply elasticities (for the international fossil fuel price channel) and Armington elasticities (for the competitiveness channel) (Monjon and Quirion, 2011; Alexeeva-Talebi et al., 2012; Balistreri and Rutherford, 2012). The former indicate to what extent a decrease in fossil fuel demand reduces the fuel price, while the latter represent the substitutability between domestic and for-eign products.
A recent comparative study of 12 different models gave the most robust results so far (Böhringer et al., 2012a). The estimate of leakage is 5-19% (mean 12%) when Annex I countries (except Russia) abate 20% of their emissions through carbon pricing without taking any measure to protect EITE sectors. The loss of output in these sectors is 0.5%-5% (mean 3%) in the coalition and an output gain
of 1%-6.5% (mean 3%) is observed in the rest of the world. A detailed review of leakage estimates is provided in chapter 2. These aggregate results hide differences among sectors, but even at sectoral levels, leakage estimates contrast sharply with alarmist predictions made by industry-financed studies. For example, according to a (BCG, 2008) study funded by the European cement industry, under carbon pricing at 25 euro /tCO2without climate policy outside the EU ETS or measures
against leakage, importers would supply 80% of the European cement market. A peer-reviewed study that analyses a very similar scenario (except that the CO2
price is at 20 euros per ton) concludes that importers would only supply 8%, versus 3% absent climate policy (Demailly and Quirion, 2006). These contrasted results can be explained by different assumptions about available production capacities abroad and the nature of competition assumed in the cement market.
1.2.2 Ex post studies
The first studies assessing empirically the impacts of environmental regulations on trade dealt with local pollution issues (Kalt, 1988; Tobey, 1990; Grossman and Krueger, 1993; Jaffe et al., 1995). They showed little evidence to support the “pollution haven” effect: their estimates of the impact of environmental reg-ulations on trade flows were either small or insignificant. However, recent stud-ies have shown some evidence of the pollution haven effect in small proportions (Dean et al., 2005; Levinson and Taylor, 2008). Paradoxically, dirty industries seem less vulnerable, because of capital intensity and transport costs (Ederington et al., 2003). The empirical validity of the pollution haven effect continues to be one of the most contentious issues in the debate regarding international trade and environment (Kellenberg, 2009). Nevertheless a massive environmental reloca-tion has never been observed.
Environmental tax reforms (ETR, i.e. carbon taxes whose revenues are used to cut other taxes, mostly on labour income) established in some European coun-tries offer another natural experiment to empirically treat these questions. Kee et al. (2010) analyse the evolution of imports and exports in energy-intensive in-dustries, comparing countries which did and did not implement a carbon tax. The authors find a statistically significant negative impact on exports of a carbon tax
only in the cement sector while, strangely enough, they find a positive impact on exports in the paper as well as iron and steel sectors. No statistically significant impact was found on imports for any sector. (Miltner and Salmons, 2009) found that, out of 56 cases (seven countries and eight sectors studied), the impact of ETR on competitiveness was insignificant in 80% of the cases, positive in 4% and neg-ative for only 16%. However, EITE sectors benefited from exemptions and lower taxation rates, which may explain why more negative impacts were not observed. If ETR didn’t prove harmful for these industries, they had a positive impact on eco-nomic wealth, giving empirical arguments for the double dividend theory (Barker et al., 2009), e.g. a taxation shift from labour to pollution may stimulate economic growth as well as reducing pollution (Goulder, 2002; Bento and Jacobsen, 2007). Aichele and Felbermayr (2012) econometrically assessed the impact of having an emission target under the Kyoto Protocol (i.e. being a developed country and having ratified the Protocol) on CO2emissions, the CO2footprint2and CO2net
imports, using a differences-in-differences approach on a panel of 40 countries. To account for a potential endogeneity bias (the fact that countries with an expected low or negative growth in emissions may be more likely to have ratified the Pro-tocol) they use the International Criminal Court participation as an instrumental variable for Kyoto ratification. They concluded that countries with a Kyoto tar-get reduced domestic emissions by about 7% between 1997-2000 and 2004-2007 compared to the countries without a target, but that their CO2footprint did not
changed (CO2net imports increased by about 14%). These results imply that
do-mestic reductions have been fully offset by carbon leakage. However two caveats are in order. First, China became a member of the WTO in 2002, just when most developed countries ratified the Protocol. Since most CO2net imports are due to
trade with China (Sato, 2013), the rise in net imports may well be due to China WTO membership rather than to Kyoto. Second, apart from those covered by the EU ETS, countries with a Kyoto target haven’t adopted significant policies to reduce emissions in manufacturing industry. Hence, if Kyoto had caused leakage (through the competitiveness channel), it should show up on the CO2net imports
2The CO
2footprint equals domestic emissions plus CO2net imports, i.e. domestic emissions
plus emissions caused by the production of imported products, minus emissions caused by the production of exported products.
of countries covered by the EU ETS rather than of countries covered by a Kyoto target; yet the authors report that EU membership does not increase CO2imports,
when they include both EU membership and the existence of a Kyoto target in the regression. This conclusion invites to look more directly at the impact of the EU ETS.
The studies focusing on the EU ETS, the largest carbon pricing experiment so far, have not revealed any evidence of carbon leakage and loss of competitiveness in sectors considered at risk of carbon leakage, such as cement, aluminium, and iron and steel (Reinaud, 2008; Ellerman et al., 2010; Sartor, 2013; Quirion, 2011). More studies will undoubtedly be conducted in the following years, for the EU ETS and the other carbon markets that have emerged, as more hindsight will be provided. So far, the empirical resultsare in sharp contrast to the “exodus of EU in-dustry” claimed by the European Alliance of Energy Intensive Industries (Oxfam, 2010).
1.2.3 Synthesis
Ex ante modelling studies vary in their results because of policy scenarios (size of the coalition, abatement targets) and some crucial model parameters (Arming-ton elasticities for the competitiveness channel, and oil supply elasticities for the international fossil fuel channel). A meta-analysis of recent studies which details the role of these factors is provided in Chapter 2. In the absence of BCA, most of these studies suggest leakage rates in the range of 5-20%. Conversely, ex post econometric studies have not revealed empirical evidence of these issues. Why such a difference?
First, effects of carbon taxation are always in practice compensated by “policy packages”. Because of carbon leakage and competitiveness concerns, sectors at risk in the EU ETS received allocations free of charge while in every case of CO2
tax, they benefited from lower tax rates or exemptions. In addition, aluminium producers and other electricity-intensive industries, protected by long term elec-tricity contracts, have not always suffered the pass-through of carbon costs to con-sumer by electricity companies (Sijm et al., 2006). Moreover, in the case of the EU ETS, the CO2 price has been below 14 euros for the majority of the time