HAL Id: hal-02621163
https://hal.inrae.fr/hal-02621163
Submitted on 26 May 2020
HAL is a multi-disciplinary open access
archive for the deposit and dissemination of sci-entific research documents, whether they are pub-lished or not. The documents may come from teaching and research institutions in France or abroad, or from public or private research centers.
L’archive ouverte pluridisciplinaire HAL, est destinée au dépôt et à la diffusion de documents scientifiques de niveau recherche, publiés ou non, émanant des établissements d’enseignement et de recherche français ou étrangers, des laboratoires publics ou privés.
Perceived probability of food waste: Influence on
consumer attitudes towards and choice of sales
promotions
Guillaume Le Borgne, Lucie Sirieix, Sandrine Costa
To cite this version:
Guillaume Le Borgne, Lucie Sirieix, Sandrine Costa. Perceived probability of food waste: Influence on consumer attitudes towards and choice of sales promotions. Journal of Retailing and Consumer Services, Elsevier, 2018, 42, pp.11-21. �10.1016/j.jretconser.2018.01.004�. �hal-02621163�
Version postprint
PERCEIVED PROBABILITY OF FOOD WASTE: INFLUENCE ON CONSUMER ATTITUDES TOWARDS AND CHOICE OF SALES PROMOTIONS
ABSTRACT.
Based on a consumer survey including two experiments with more than 400 French respondents each, this research (1), establishes that consumers’ perceived probability of waste has a significant negative effect on consumers’ attitude towards promotions and consumers’ intention to choose perishable food products (cheese and bread) on sale and (2), highlights skepticism towards the “Buy Two Get One Free later” offer. Recommendations are presented for managers and public policies, in order to reduce households’ food waste and prevent consumers from being skeptical towards new promotional mechanisms, a brand and/or, a retailer.
KEYWORDS
Food waste; promotions; consumer concern; experiment; deal proneness; skepticism; BTGOF later
1. Introduction
Retailers regularly employ and spend more and more on sales promotions to increase sales volumes. Prior research has shown that promotions generate an increase in quantities purchased by consumers (Blattberg and Neslin 1989; Nijs et al., 2001; Manning and Sprott, 2007), and an increase in consumption rate of certain products (Ailawadi 1998; Foubert and Gijsbrechts, 2007).
Version postprint
In the meantime, food waste is now becoming a major issue in the definition of a sustainable food system. Approximately a quarter of the world’s food is wasted across the food supply chain (FAO, 2011). In the United States, 31 percent -or 133 billion pounds- of the 430 billion pounds of the available food supply at the retail and consumer levels in 2010 went uneaten. Retail-level losses represented 10 percent (43 billion pounds) and consumer-level losses 21 per cent (90 billion pounds) of the available food supply (Busby et al., 2014). In 2015, the European Commission estimated annual food waste generation in the EU 27 at approximately 220 billion pounds and consumer-level losses represented 30 percent (European Commission, 2015).
While sustainable practices help retailers build a good image among consumers (Lavorata, 2014), promotional offers on food products are conversely often criticized and cited as a major factor of waste for households (Lyndhurst et al., 2007). These offers would tend to disturb consumers’ efforts tempting to plan and manage their food purchases in relation to their needs and stocks (Farr-Wharton et al., 2014). However, different forms of promotions may alter in different ways consumers’ attitudes towards promotions and choice. Indeed, consumers have become increasingly concerned about food waste (Evans, 2011) and may take into account the perceived probability of waste when they buy perishable products with different forms of promotion.
However, to our knowledge, no research has yet studied the potential effects of perceived probability of wasting and consumers’ concern for food waste, on consumers’ attitude towards promotions and consumers’ intention to choose perishable food products. Therefore the present study aims to respond to this need. It seeks to contribute to a better understanding of consumer’s response to different forms of promotions: BOGO50 (buy-one-get-one-50%
Version postprint
off), BTGOF (buy-two-get-one-free) and, BTGOFL (buy-two-get-one-free-later1) by addressing both deal proneness and food waste concern; it offers managerial recommendations for public policies, in order to reduce households’ food waste and for managers, in order to prevent consumers from being skeptical towards promotions, a brand and/or a retailer. This paper is structured as follows. First a conceptual framework regarding (1) consumers and sales promotions and (2) the link between food waste concern and attitudes towards promotions, is provided. This leads to a general model including hypotheses regarding attitudes towards promotions and purchase intentions. Findings from two experiments in France with two perishable food products - grated cheese and bread - are then reported and discussed. Finally, theoretical and managerial implications are exposed.
2. Conceptual framework
2.1. Consumers and sales promotions
Prior research has demonstrated the consequences of promotional offers, on quantities purchased (Blattberg and Neslin 1989; Nijs et al., 2001; Manning and Sprott, 2007) or more generally on purchase behaviour (Ailawadi 1998; Petchl, 2004). The effects of promotions on purchases depend on factors related to the promotion itself, such as the promotional technique adopted or the perceived savings and the perceived complexity of the offer. Thus, the promotional technique influences the attitude towards a promotion. Previous studies make a distinction between monetary (based on price e.g. x% price discount or on quantity, e.g. BOGOs) and non-monetary promotions (e.g. gifts). “Free” offers such as “BOGOs” are described as always effective by Raghubir et al. (2004), who also mention that matching the promotion to the product category is necessary.
1 This last type of discount has been particularly developed in UK, e.g. in Tesco shops since 2009. In France, it is being tested by Auchan since early 2013.
Version postprint
However, these effects also depend on factors related to the consumer, in particular his/her sensitivity to promotions or deal proneness (Lichtenstein et al., 1990; Laroche et al., 2001) and the benefits he/she expects. Lichtenstein et al. (1990) have defined deal proneness as “a general propensity to respond to promotions predominantly because they are in deal form”. It has been suggested to consider the influence of deal proneness, on the effects of multiple unit price promotions (Manning and Sprott, 2007). Deal proneness may also be related to smart shopping, which Mano and Elliott (1997) define as investing considerable time and effort in seeking information about promotions in order to achieve price savings. However, savings are not the only benefit expected from promotions. Both monetary and non-monetary reasons explain why consumers are sensitive to promotions (Chandon et al., 2000). Chandon et al. propose a model that distinguishes the utilitarian benefits derived from promotions - savings, product quality - and hedonic benefits - self-expression, exploration, pleasure - (Chandon et al., 2000). This model, however, focuses only on positive relationships between consumers and promotions.
Besides, consumer involvement and subjective expertise in the category might influence consumers’ attitudes towards a promotional offer (Hunt et al., 1995; Raghubir et al., 2004; Andrews, 2016). Hunt et al. (1995) examined the effects of product involvement on consumers' responses to promotional offers. Their study reports that consumers with high levels of product involvement are more likely to experience satisfaction with their shopping experience involving a promotional offer and, subsequently, are more likely to express intentions to engage in repeat purchase behaviour of the product. Generally involvement and subjective expertise are correlated (Zaichkowsky, 1985), and subjective expertise may have the same positive effect on attitudes towards promotions.
Version postprint
2.2. Values and Food waste concern
There already is an extensive body of research on environment or sustainability-concerned consumers (Grunert et al., 2014). The studies aiming to understand the underlying motivations of these concerned consumers highlight the influence of personal values embedded in these motivations. These values express themselves in the choice of sustainable labels (Grunert et al., 2014), socially conscious or frugal consumer behaviours (Pepper et al., 2009), organic consumption (Aertsens et al., 2009) or, fair trade products consumption (Grankvist et al., 2007). As regarding frugality, it is difficult to ascertain its value antecedents, since a frugal behavior may be a consequence of poverty or a deliberate choice. Hence, this behavior may be associated with security concerns for some consumers and with self-transcendence values for others (Pepper et al., 2009). However, Pepper et al. show in their study that frugality is not primarily an “ethical conscious” choice and that its strongest negative predictors are income and personal materialism.
The same questions arise for food waste concern. Like frugality, food waste concern may be related to these values and may influence attitudes and behavior. However, , there is still a lack of literature investigating food waste concern.
Following the definition of environmental concern, consumers’ concern for food waste has been defined as attaching importance to food waste and its consequences and as being emotionally affected by the experience of food waste or the general issue of food waste (authors, 2016). Like frugality which is characterized by both restraint in acquiring possessions and resourcefulness in using them (Lastovicka et al., 1999), food waste concern may lead to adopt behaviours in order not to waste (e. g. making shopping lists) or affect consumers’ attitudes towards promotions.
Version postprint
2.3 The link between Food waste concern and attitudes towards promotion
The model proposed by Chandon et al. (2000) focuses only on positive relationships between consumers and promotions. Raghubir et al (2004) developed an integrative model that theorizes that sales promotions have three distinct aspects: an economic aspect that provides an immediate monetary economic incentive as well as non-monetary incentives (saving time and effort to make a decision), an informational aspect that consumers use as a cue and an affective aspect that impacts how consumers feel about their shopping transaction, including both positive as well as negative feelings. Food waste concern is not included in Raghubir et al.’s model. Yet, food waste concern might affect both the economic and affective aspects in different ways. First, food waste concern may affect the probability of wasting food and money after purchasing a promotional offer; anticipated probability of wasting recovers both an economic dimension -the financial loss- and an affective dimension --the feeling of being tricked or betrayed (Binkley and Bejnarowicz, 2003). However, in the same way as frugal consumer behaviour depends on income constraints (Pepper et al. 2009), food waste concern is also related to financial concerns (authors, 2016).
Hence, it may also have a positive effect on deal proneness if promotional offers are perceived as a means of saving money (Quested et al., 2013, Graham-Rowe et al., 2014, authors, 2016). 3. Hypotheses
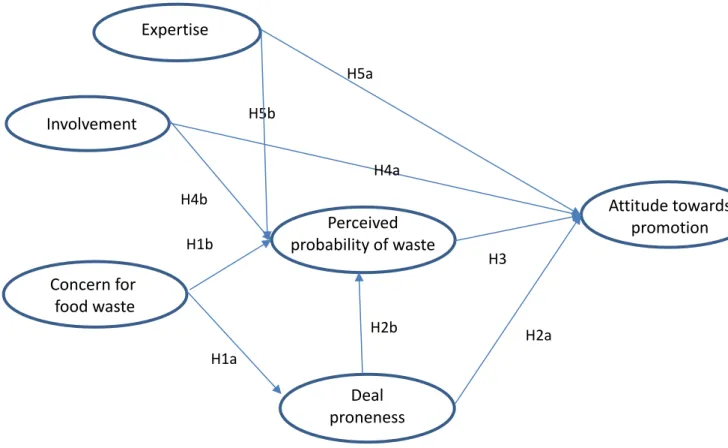
On the basis of the literature review, the following model including five hypotheses is proposed (figure 1).
Version postprint
Figure 1 Conceptual model
Consumers’ routines with regard to planning and shopping for food are important constructs to understand consumers’ food waste (Stefan et al., 2013). Consumer food waste concern leads to more elaborated planning (author, 2016), including the use of shopping lists and the comparison of products, including promotional deals. Besides, consumers are motivated by saving money when it comes to food waste (Quested et al., 2013, Graham-Rowe et al., 2014; authors, 2016). Thus food waste concern may have a positive effect on deal proneness.
At the same time, consumer food waste concern may lead to a lower perceived food waste probability when buying a product on promotion, since concerned consumers intend to fight food waste. This leads to the first hypotheses related to food waste concern:
H1a: Food waste concern has a positive effect on deal proneness
H1b: Food waste concern has a negative effect on perceived food waste probability In line with previous studies, deal prone consumers are expected to develop positive attitudes towards different forms of promotions (Lichtenstein et al., 1995; Pechtl, 2004). More
Involvement Deal proneness Concern for food waste Perceived probability of waste Attitude towards promotion H1a H2a H4b H3 H4a H2b H5b H1b H5a Expertise
Version postprint
precisely, Lichtenstein et al.’s experiment shows that buy-one-get-one-free proneness is positively related to self-reported coupon redemption behaviour (Lichtenstein et al., 1995). Besides, the deal prone consumers are willing to invest time and effort in planning their shopping trips (Pechtl, 2004). Thus they tend to estimate that they control their purchasing and consumption activities and may perceive less food waste probability. Accordingly, hypotheses 2a and 2b regarding deal proneness are formulated as follows:
H2a: Deal proneness has a positive effect on attitude towards a quantity-promotion offer
H2b: Deal proneness has a negative effect on perceived food waste probability
Among the consumer expectations that can influence the promotional response, the reference price is the most studied variable (Winer, 1986). The anticipation of waste as a variable likely to influence the attitude towards promotion has never been studied. Yet, consumers may fear that promotions may lead to overconsumption or food waste. Obermiller and Spangenberg (2000), in their study of the antecedents of skepticism about advertising, note the potential effect of dual learning: indirect learning related to social interactions and direct learning related to personal experience. A personal experience of overconsumption or waste, or an anticipation (a perceived risk) of waste (indirect learning) could similarly constitute an antecedent of the attitude towards a promotion, neglected so far. Indeed, almost no one wants to be wasteful (Arkes, 1996). Hence, if consumers perceive a high probability of food waste, they will have a negative attitude towards quantity-promotion offers.
H3: Perceived food waste probability has a negative effect on attitude towards a quantity-promotion offer
As reported in previous literature, consumer involvement in the category and subjective expertise influence consumers’ attitudes towards a promotional offer (Hunt et al., 1995;
Version postprint
Raghubir et al., 2004; Andrews, 2016). Hunt et al. report that consumers with high levels of product involvement are more likely to experience satisfaction with a shopping experience involving a rebate and, subsequently, are more likely to express intentions to engage in repeat purchase behaviour and word-of-mouth communication about the product. (Hunt et al., 1995). Consumer involvement may also influence consumer choice confidence and affect toward the choice, as shown in Andrews’s experiment about Buy one, get a second for 50% off (BOGO50) promotion (Andrews, 2016).
In the meantime, consumer involvement and a greater subjective expertise lead to a feeling of control (Zaichkowsky, 1985). Even if no previous study explored this link, it is likely that this greater feeling of control reduce perceived probability of waste. This leads to the following hypotheses related to food involvement with the product category and subjective expertise:
H4a/5a: Consumer involvement with the product category / Consumer subjective expertise has a positive effect on attitude towards a quantity-promotion offer
H4b/5b: Consumer involvement with the product category / Consumer subjective expertise has a negative effect on perceived food waste probability
4. Experiments
A survey including two scenarios (leading to two experiments) about purchase of grated cheese and purchase of bread baguettes was conducted in France. By choosing two products with differences in terms of category, perishability, and consumption patterns, we aim at assessing the product-dependency of the results.
The choice of grated cheese and bread baguettes relies on the fact that in France, inhabitants consume around 26 kg of cheese per person and per year (French Ministry of Agriculture) and 96% of French people declare consuming cheese regularly. One of the most consumed cheese is “Emmental”, sold either grated or in bar. Thus, grated cheese (especially grated Emmental)
Version postprint
is familiar to most French consumers. Likewise, bread is still important in French diets (120 grams per person and per day2 in 2016), especially in the form of baguettes.
Since these experiments include a choice of quantities and aim at linking it with anticipated food waste, it is necessary to take into account - as much as possible - the usual consumption volumes of respondents’ households. Here, these volumes are partially taken into account through three variables: number of people in the household, involvement with the product and subjective expertise.
The scenarii focused on the selection of a single product (a bag of 200 grams (7 ounces) of grated cheese in the first experiment and a bread baguette in the second one, no logo nor brand in any of these products) from a set of four propositions: P1: Buy one at regular price, P2: Buy one, get a second for 50% off (BOGO50), P3: Buy two, get a third one free (BTGOF), P3L: Buy two, get a third one free next week (BTGOFL)
4.1. Design and procedure
Two different perishable products were chosen, so that a risk of waste might be reasonably perceived by consumers: grated cheese (around 10 days before Best Before Date3) and bread baguettes (no Best Before Date but a well-known fast degradation of organoleptic qualities). Two online surveys –one for each product- were built, with the same structure. They were sent via Survey Sampling International (SSI) to a diversified panel of 610 and 604 consumers respectively. Responses that were incomplete, too fast to be credible or blatantly “automatic” were rejected: 416 responses were kept in the first survey (grated cheese) and 401 for the second survey (bread).
2 Equivalent to half of a baguette
3 In France, two types of Best Before Dates exist, depending on the microbiological perishability of the product. In the case of grated cheese like other “very perishable” products, it is a “Limit-Date of Consumption”, meaning that the product must be sold and eaten before this date, since it may present a danger if consumed afterwards.
Version postprint
After a filter question on purchase and consumption of the corresponding product (grated cheese or bread), questions on involvement with the product and subjective expertise were asked. The measures were based on previous literature (Verbeke and Vackier, 2004, for involvement and Brucks, 1986 for subjective expertise) and assessed via a 7-point Likert scale items.
The second part puts the respondent in situations of purchase of grated cheese, facing separately or simultaneously various promotional offers on one or several bags of the same type of grated cheese (resp. one or several bread baguettes). First, his attitude towards the three different promotional offers on grated cheese was assessed on three distinct pages. The measure was based on previous literature (De Pechpeyrou and Odou, 2002) and assessed via a 7-point Likert scale items. Then, four offers (the “One-Unit” offer and the three promotional offers) were presented simultaneously (i.e. on a single page) and participants were asked to indicate their selection (including also the possibility of “not buying anything”) and give the reasons for their choice. Finally, the perceived probability of non-consumption 4 was assessed via a 5-point Likert scale items for each promotional offer separately (regardless of the actual choice of the respondent in the previous question).
The last part is the same in the two surveys: it measures deal proneness, concern for food waste, and a set of sociodemographic characteristics. The measures were based on previous literature (Lichtenstein et al., 1990, Chandon et al., 2000 for deal proneness and authors, 2016, for consumer concern for food waste) and assessed via a 7-point Likert scale items. All the scales are presented in Appendix A.
The propositions in the choice task (fig.2) are: - P1: Buy one at regular price
Version postprint
- Promotion P2: (Virtual) pack of two units, the second unit being sold with a 50% discount (meaning 25% discount on the total price for the purchase of two units). - Promotion P3: (Virtual) pack of three units, the third unit is free (meaning 33%
discount on the total price for the purchase of three units).
- Promotion P3L: (Virtual) pack of three units, the third unit is free (meaning 33% discount on the total price for the purchase of three units) and must be taken next week.
In the survey, this configuration leads to the following question: “You are in a supermarket facing these four offers. Would you choose one to purchase it? If so, which one?”.
Version postprint
Translation:
Offer 1(/2/3/4) - Grated Cheese, 1.76€/unit
[On the bag]: French grated Emmental. 200g (7 ounces). Meltingly soft. Resealable bag. Best Before Dec.01 2015.
4.2. Results from Experiment 1 (Grated cheese)
4.2.1. Descriptive results
High levels of concern for food waste were found. Mean scores5 on the seven items of concern range from 5.84 to 6.36 out of 7, standard deviations ranging from 1.08 to 1.38. Mean perceived probability of waste (assuming a purchase of the presented promotion - see scenarios) is, as expected, higher for P3 (2.65) than for P2 (2.10). However, surprisingly, it is not significantly lower for P3L than for P3 (when running a t-test considering paired samples (p-value=.074)), despite the fact that the objective goal of the possibility to take a third bag one week later (with an accordingly delayed expiry date) is aimed at lowering the actual chances to waste this product. Consequently, the attitude towards P3L is less positive (4.27 out of 7) than the attitude towards P2 (4.95) and P3 (4.96).
As for the choices, the 3-Pack and 2-Pack were the most elicited options (table 1). Table 1 : Product 1 - Grated cheese bags
Choices Means of variables per group of choice
Actual Choice Numb. Obs. Deal proneness (scale 1-7) Concern for food waste (scale 1-7) Perceived probability of wasting assuming the purchase of P2 / P3 / P3L (scale 1-5) Attitude towards P2 / P3 / P3L (scale 1-7) No purchase 40 (9.6%) 4.05 6.02 3.43 3.80 3.73 3.78 4.12 3,60
Version postprint One unit 54 (13.0%) 4.59 6.02 2.56 3.00 2.94 4.70 4.54 4,12 2 - Pack (P2) 142 (34.1%) 5.03 6.10 2.00* 2.91 2.89 4.96 4.88 4,05 3 - Pack (P3) 157 (37.7%) 5.06 6.05 1.69 2.06 2.07 5.30 5.34 4,61 3L - Pack (P3L) 23 (5.5%) 5.06 6.39 2.04 2.22 2.13 5.18 5.38 4,82 Mean scores (all respondents) 4,89 6.08 2.10 2.65 2.63 4.95 4.96 4.27
*Numbers in bold are the mean perceived probability of waste (respectively the mean attitude) as regards the actual choice made by the members of the corresponding group.
4.2.2 Explanation of the attitude towards a promotional offer
Structural equation modelling has been run with XLSTAT software, with the PLSPM (Partial Least Square Path Modelling) method. Significance of path coefficients led us to accept or reject the corresponding hypotheses. Confirmatory factor analysis establishes for the variables considered in the model, reliability, convergent validity and, discriminant validity using the HTMT method (Henseler et al., 2015) (see Appendix A). Involvement and subjective expertise are, as expected, strongly correlated (Pearson’s coefficient of correlation = .542). These two variables are thus, from now, grouped into a second-order variable called “Involvement / Subjective expertise”.
To each promotional offer (P2, P3, P3L) corresponds one model (since perceived food waste and attitude were assessed for each promotion). For greater clarity, results are presented for the P2 (BOGO50) promotion only (Figure 2), results for other offers turning out to be similar
Version postprint
as for the validation of hypotheses6. Absolute Goodness of Fit (GoF) of this model is good (.470).
Figure 2 Model for BOGO50 offer on grated cheese
(*: significant at .05 threshold, **: significant at .01 threshold.)
As expected, deal proneness, involvement and, subjective expertise have a positive effect on attitude towards a quantity-promotion offer (H2a and H4a/H5a), while perceived food waste probability impacts negatively the attitude towards a quantity-promotion offer (H3). In the meantime, food waste concern has a positive effect on deal proneness (H1a), while deal proneness and involvement in the product category and subjective expertise have a negative effect on perceived food waste probability (H2b and H4b/H5b). Besides, deal proneness and perceived probability of waste have partial mediation roles.
6 We remind that the choice (qualitative variable) doesn’t appear in the model, and will be treated separately.
Involvement / Expertise Deal proneness Concern for food waste Size of household Probability of waste (of BOGO50) Attitude towards P2 - .087 (p=.068) .096* .158** - .242** .419** .174** - .187** - .171**
Version postprint
Conversely, hypothesis H1b was not supported. Food waste concern has no significant effect (at the 5% threshold) on perceived food waste probability. Besides, it has a positive but not significant total effect on attitude towards a quantity-promotion offer.
4.2.3 Choice
To complement the results of path modelling, it was necessary to go beyond the study of the determinants of attitude towards various promotions by investigating the determinants of the actual choice and, in particular, the corresponding quantity purchased.
A discriminant analysis allowed to study which variables influence significantly the actual choice of consumers among proposed options. For this analysis, only three options (groups) were retained: One Unit, P2, P3. This was due to the very small size of “P3L” group on the one hand, and - on the other hand - to the fact that the “No purchase” choice corresponds to a high variety of motivations. As a result of what, analysis was run on the 353 respondents whose choices were “One Unit”, “P2”, or “P3”.
Promotion P2 is chosen as a reference, since it represents the « median option » in terms of quantities. In order to avoid collinearity, attitude towards P3 and perceived probability of waste for P3 are not included directly in discriminant analysis, and are instead taken into account through their differences with attitude towards P2 and perceived probability of waste for P2 respectively.
Hence, the variables whose influence on consumer’s choice is tested are: - the number of people in the household,
- involvement with/subjective expertise of grated cheese - attitude towards P2 (AP2),
Version postprint
- perceived probability of waste assuming the purchase of P2 (PWP2) - difference of perceived probability of waste “PWP3 - PWP2” - deal proneness
- concern for food waste
As described in table 1, 157 respondents chose P3, 142 chose P2, and 54 chose “One unit”. In order to test the influence of the variables elicited previously on the “choice” variable, a discriminant analysis with an ascending step-by-step method was run7. Analysis ends after four steps, the four retained variables being, by decreasing order of importance: (1) difference “AP3 - AP2”, (2) attitude towards P2, (3) difference “PWP3 - PWP2”, (4) perceived probability of waste assuming the purchase of P2 (PWP2). The first factor of discriminant analysis accounts for 81% of the variance, and the second one accounts for 19%. Factors-Variables plot reveals two orthogonal groups of variables. In the first group, “AP3-AP2” and “PWP3-PWP2”, who have opposite directions as expected, and are mainly linked to axis 1. In the second group, “Attitude P2” and “PWP2” also have opposite directions, and are mainly linked to axis 2. The first group of variables corresponds to the discrimination between P2 and P3, and the second group corresponds to the discrimination between P1 and P2/P3, as confirmed by the scatter plot of individuals (figure 3).
Figure 3 Discriminant Analysis on cheese choice
7 The variables are added one by one, among those who improve the model and present significant differences (5% threshold) between groups. In this discriminant analysis, each group corresponds to one choice option.
Version postprint Household size CCFW Deal Proneness Involvement PWasteP2 PWP3-PWP2 PWP3L-PWP3 AttitudeP2 AttP3-AttP2 AttP3L-AttP3 -1 -0,75 -0,5 -0,25 0 0,25 0,5 0,75 1 -1 -0,75 -0,5 -0,25 0 0,25 0,5 0,75 1 F2 (1 9. 08 % ) F1 (80.92 %)
Variables (axes F1 & F2 : 100 % of var.)
IN OUT 1 P2 P3 -3 -2 -1 0 1 2 3 -3 -2 -1 0 1 2 3 F2 (19.08 % ) F1 (80.92 %)
Scatterplot of individual values (axes F1 & F2 : 100 % of var.)
1 P2 P3 Centroids Legend CCFW = Consumer Concern
for Food Waste
PWasteP2 = Perceived
probability of Waste assuming the purchase of P2
PWP3-PWP2 = PWasteP3
minus PWasteP2
AttP3-AttP2= Attitude
towards P3 minus Attitude towards P2
Version postprint
The percentage of observations correctly classified by ranking functions (stemming from step-by-step analysis) is 57.5%, meaning an improvement of 50% compared to the theoretical percentage of congruence for a random classification (38.3%). The cross-validation rate is poor for “One unit” group (20%), whereas it is correct for P2 (57%) and good for P3 (74%). Detailed results of the ranking are given in appendix B.
Thus, Attitude and Perceived probability of waste are the two main factors influencing final choice. Path modelling shows (4.2.2) that a lower perceived probability of waste (for a given promotion) leads to a more positive attitude towards this promotion; discriminant analysis shows that both a lower perceived probability of waste and a more positive attitude increase the probability of choosing the considered promotion. The “PWP3 minus PWP2” and “AP3 minus AP2” variables allow distinguish between those who choose the P2 promotion and those who choose the P3 promotion. Surprisingly, the number of people in the household has no significant “direct” effect on choice according to discriminant analysis. However, following the structural equations model (SEM), it has a positive and significant (at the 5% threshold but not at the 1% threshold) total effect on attitude (towards P2), meaning that this variable certainly affects choice indirectly.
Deal proneness and involvement / subjective expertise (grated cheese) show no significant effect in discriminant analysis. This does not mean these variables do not affect choice, since they have a significant (negative) effect on perceived probability of waste and significant (positive) effect on attitude, in the model. Thus, deal proneness and involvement/subjective expertise influence indirectly choice following this tendency: higher deal proneness and higher involvement lead to a higher number of units purchased. The same conclusion comes for concern for food waste: it has no significant effect on choice according to discriminant analysis, but its total negative effect (significant at the 5% threshold) in the model on
Version postprint
perceived probability of waste shows an indirect influence on choice: a higher concern for food waste may lead to a higher number of units purchased. Besides, concern for food waste is significantly higher in the group of those who choose P3L than in the other groups, including those who choose P3.
4.3. Additional results from Experiment 2 (Bread Baguettes)
4.3.1 Design and procedure
The same design and procedure were adopted for the second experiment on bread baguettes; After removal of rejected responses, 401 responses were kept.
The scenario about purchase of grated cheese was adapted to bread baguettes. The hypotheses are the same as those previously presented. Freezing bread being a common behaviour in French households and being susceptible to influence significantly the perceived probability of waste, a question about the frequency of this behaviour was added to the survey. This variable is integrated in the model as exposed in figure 4.
4.3.2 Descriptive results
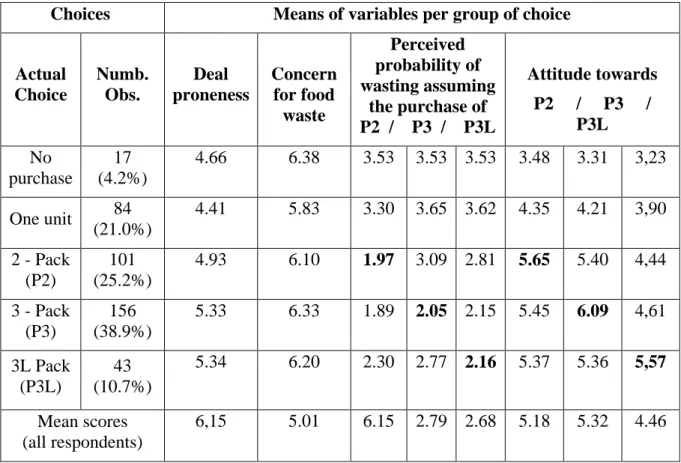
Most results confirm those obtained in study 1 (Table 2). However, the BTGOFL-pack is more often chosen than in study 1, probably due to the fact that bread baguettes perish faster than grated cheese in bags. (the comparison of choices between study one and two is presented in appendix C)
Version postprint
Table 2. Product 2: Bread baguettes
Choices Means of variables per group of choice
Actual Choice Numb. Obs. Deal proneness Concern for food waste Perceived probability of wasting assuming the purchase of P2 / P3 / P3L Attitude towards P2 / P3 / P3L No purchase 17 (4.2%) 4.66 6.38 3.53 3.53 3.53 3.48 3.31 3,23 One unit 84 (21.0%) 4.41 5.83 3.30 3.65 3.62 4.35 4.21 3,90 2 - Pack (P2) 101 (25.2%) 4.93 6.10 1.97 3.09 2.81 5.65 5.40 4,44 3 - Pack (P3) 156 (38.9%) 5.33 6.33 1.89 2.05 2.15 5.45 6.09 4,61 3L Pack (P3L) 43 (10.7%) 5.34 6.20 2.30 2.77 2.16 5.37 5.36 5,57 Mean scores (all respondents) 6,15 5.01 6.15 2.79 2.68 5.18 5.32 4.46
4.3.3 Explanation of the attitude towards a promotional offer
As for study 1, confirmatory factor analysis establishes discriminant validity for the variables considered in the model and all hypotheses are supported except H1b, for the three promotions (figure 4).
Version postprint
Figure 4 Model for BOGO50 offer on bread baguettes
However, the size of the household influences negatively perceived probability of waste, whereas it had no significant effect in study 1 (cheese). The habit of freezing, which was only introduced in study 2, also influences negatively perceived probability of waste. These two effects are accentuated for promotion P3 (BTGOF) compared to P2 (BOGO50).
In addition, freezing has no direct effect on the attitude towards P2 (BOGO50), but has a direct positive effect on the attitude towards P3 (BTGOF).
Involvement / Expertise Deal proneness Concern for food waste Size of household Probability of waste (of BOGO50) Attitude towards P2 .184** .326** - .119* .332** .181** - .188** - .220** Freezing -.099* - .185** n.s. .241**
Version postprint
To the previously variables considered in study one, the frequency of freezing bread is added, as justified earlier. The choice options retained for discriminant analysis are the same as in study one (“One unit”, “P2”, “P3 (BTGOF)”), leaving 344 subjects in the analysis.
As in study 1, perceived probability of waste and attitude(s) towards the various promotions (and the difference of attitudes and perceived probability of waste between P3 and P2) participate significantly to the discrimination between choices, with the same orthogonal groups of variables (Figure 5). However, the new variable considered - frequency of freezing - is the most discriminant variable as regards choice (detailed results available in appendix B), and is the highest contributor on the first axis (which corresponds to 75% of the variance). Moreover, the percentage of observations correctly classified by ranking functions (stemming from step-by-step analysis) is now 70.6% (way higher than in cheese study), meaning an improvement of 97% compared to the theoretical percentage of congruence for a random classification (35.9%). The cross-validation rates are now high for “One unit” (70%) and “P3” (84%) groups, and just correct for “P2” group (50%).
In conclusion, as for the structural equations model, we see differences in discriminant analysis between cheese and bread studies, which we discuss hereafter.
Version postprint Household Size CCFW Freezing Deal Proneness Involvement PWasteP2 PWP3-PWP2 PWP3L-PWP3 AttitudeP2 AttP3-AttP2 AttP3L-AttP3 -1 -0,75 -0,5 -0,25 0 0,25 0,5 0,75 1 -1 -0,75 -0,5 -0,25 0 0,25 0,5 0,75 1 F2 (24.46 % ) F1 (75.54 %)
Variables (axes F1 & F2 : 100 % of var.)
IN OUT 1 P2 P3 -3,5 -2,5 -1,5 -0,5 0,5 1,5 2,5 3,5 -4 -3 -2 -1 0 1 2 3 F2 (24,46 % ) F1 (75,54 %)
Scatterplot of first 60 individual values (axes F1 & F2 : 100 % of var.)
1 P2 P3 Centroids Legend CCFW = Consumer Concern
for Food Waste
PWasteP2 = Perceived
probability of Waste assuming the purchase of P2
PWP3-PWP2 = PWasteP3
minus PWasteP2
AttP3-AttP2= Attitude
towards P3 minus Attitude towards P2
Version postprint
5. Discussion
5.1. Main contributions of experiments 1 and 2
Experiments on two different perishable food products reveal choice differences (see appendix C), justifying the relevance of not focusing on one single product.
Findings from these two experimental studies report that more than approximately 75% of the respondents choose products with promotional offers. These results are congruent with literature that asserts the influence of promotions on consumer choice. As example, a study conducted in France with a consumer panel reports that three out of four respondents declare that they are strongly influenced by promotions, either for the choice of the store (thus determined by promotions) or for the choice of products and brands (Nielsen, LSA, 16/12/14). Confirming previous studies (Blattberg and Neslin 1989; Ailawadi 1998; Petchl, 2004), attitude towards promotions influences consumer’s final choice. Additionnally, the current findings suggest that perceived probability of waste also is a factor influencing final choice. In both models, path modelling shows that a lower perceived probability of waste for a given promotion leads to a more positive attitude towards this promotion. Discriminant analysis shows that both a lower perceived probability of waste and a more positive attitude increase the probability of choosing the considered promotion.
Contrarily to previous literature, deal proneness and involvement /subjective expertise with the products show no significant effect on product choice in discriminant analysis. However, they influence indirectly choice: higher deal proneness and higher involvement lead to a higher number of units purchased via a lower perceived probability of waste. In the same vein, concern for food waste has no significant effect on choice according to discriminant analysis, but its total negative effect in the model on perceived probability of waste shows an
Version postprint
indirect influence on choice: a higher concern for food waste may lead to a higher number of units purchased. This influence may result from a common “savings” dimension in deal proneness and concern for food waste, along with the fact that consumers who are more concerned about food waste generally feel more skillful to avoid food waste, and thus perceive a lower probability of wasting8.
We can also note the importance of the practices of the individuals and their influence on the feeling of control and perceived control over the choices: the fact of being able to freeze the bread reduces the perceived probability of waste and increases the choice of formats P3 and P3L.
Together with the variables included in the models, answers to the open-ended question "Why this choice?" highlight the main reasons for choosing or rejecting the various offers. Specifically, those who choose not to buy or buy non-promotional products are those who have the most negative attitude towards promotions, are the least sensitive to promotions in general, and perceive the highest probability of waste of products. These people explain their choice of P2 by not wanting to buy too much, or to buy fresh bread daily in the case of bread, or by rejecting promotions in general and to a lesser extent by the fact they do not like the product. Some verbatims expressed a strong skepticism or a willingness to resist ("you encourage consumption", "promotion is always a scam", "I do not like my hand to be forced"). People who choose P2 have a positive attitude towards promotion, are moderately sensitive to promotions in general, and perceive the biggest difference between the probability of waste the products for the P3 promotion compared to P2. These people explain their choice by the financial advantage associated with the promotion and the feeling of being able to consume without throwing, contrary to the P3 offer. It is therefore in the interest of distributors that the probability of waste is perceived as very low if they want promotions to
8 It can be seen in the negative coefficient with a p-value of .068 in the SEM between concern and probability of waste.
Version postprint
be effective. This result is in line with those of Bolton and Alba (2012) which show that consumers prefer to choose a more expensive product with a lower probability of waste. Respondents choosing P3 offer logically the most positive attitude towards this promotion, are more sensitive to promotions in general than in previous groups, and perceive the lowest likelihood of non-consumption of products for promotion P2 and promotion P3. However, consumers choosing such type of promotion may end up purchasing an excessive amount of products only to receive a better bargain, and may later realize and regret that they purchased more than they could consume. Finally, they may feel cheated and become skeptical towards promotions, retailers and brands. The new promotional offer BTGOFL is supposed to lower the actual probability of waste and could thus be an answer but the present study highlights that most consumers are not ready to adopt this innovation.
5.2 Exploring consumers’ skepticism towards the BTGOF later offer
For both products, attitude towards P3L is less positive than the attitude towards P2 and P3. This might come from a lack of confidence about this promotion (Am I sure I’ll get the third bag easily? Will the expiry date be the same as today’s?...), or in some cases from a lack of understanding of how this promotion works and/or a mechanism perceived as too complicated. In the same vein, given the expression of concerns related to waste, one would have expected a more frequent choice of promotion P3L, which is not the case (5.5% for cheese, 10.7% for bread). Two main reasons for not choosing this P3L offer, linked to the lack of knowledge of this mechanism, were mentioned by respondents:
- Lack of confidence towards the distributor, and in particular the lack of confidence in the distributor's ability to actually supply this product: "beware! this offer could be a gimmick"," this promotion is not reliable ".
- The fear of not taking advantage of the offer, of forgetting it "I immediately take advantage of the 3rd free without risking forgetting to recover it the following week"
Version postprint
The consumers who choose this promotion are the most sensitive to waste, and convinced by the interest of this mechanism to limit it. The impact of new promotional formats on consumer purchasing behaviour therefore depends on individual purchasers’ characteristics, and in particular on their attitude / confidence in the promotion and the perceived likelihood of waste of the product purchased on promotion. Retailers must then better explain the benefits offered by this promotional offer and take into account the perceived barriers. Buying products on promotion may lead to upward counterfactual thinking: if individuals imagine that a better alternative (upward counterfactual) might have occurred, they will judge the factual outcome to be worse (Yoon and Vargas, 2010). In order to be accepted, this new promotional offer should thus be considered as the best alternative for consumers; this can be achieved by convincing consumers that it is the smartest choice, the financial benefit being the same, the probability of waste being lower and the mechanism being simple and without risk.
Concretely, several recommendations for brands and retailers can be suggested in order to facilitate the adoption of BG-Later offers. First, regarding the mechanism, in order to decrease consumer skepticism or fear of not taking advantage of the offer (1), the deadline for the next purchase must not be too close (in this study some respondents noticed than one week was too short) and (2), measures to reassure consumers must be taken (e.g. printed coupon at the moment of purchase, reminders of the offer via digital tools). Second, regarding the communication, since redemption effort and delayed benefit have a negative effect, they must be compensated by higher savings and distinctive benefits. Hence professionals should (1) associate BG-Later with larger discounts (e.g. propose BOGO30 or BOGOFL) and (2), provide the reason for the promotion and highlight both financial and affective benefits for consumers (e. g. “Be smart: Save money and avoid waste”).
Version postprint
6. Limitations and directions for future research
This study shows that, in addition to the variables usually considered (product involvement and expertise, deal proneness), the perceived probability of waste and concern for waste contribute to explain the attitude towards promotion and the intention of choosing perishable food items on promotion. All these results make it possible to better understand the consumer preference for virtual pack type offers identified by retailers and their importance in the current promotional offer (e. g. 27% in value of the promotional offer in France in 2014, Nielsen, LSA, 16/12/2014).
More precisely, discriminant analysis shows that both a lower perceived probability of waste and a more positive attitude increase the probability of choosing the considered promotion. As Wansink et al. have shown, anchoring effects also intervene in this type of experimental framework, with a quantity that ranged here from 0 to 3 (Wansink et al., 1998). The orthogonality between the ‘P2’ variables and the ‘P3’ variables in discriminant analysis’ plot of variables may lead to hypothesize a ‘two-stage’ process in some consumers’ mind to choose (1) between ‘one unit’ or ‘more’ and then (2) between two or three units (if ‘more’ is chosen initially). Studying this kind of potential mental process might be interesting in association with the study of internal anchors, whose influence on purchase quantity decisions has been shown (Wansink et al., 1998).
Results also show that P2 and P3 promotions proposed in the study are somewhat successful and respondents who choose these promotions explain their choice by the financial advantage associated with the promotion. Therefore, concern for purchasing power is a variable that could be included in a future study as an antecedent of deal proneness and concern for food waste. More broadly, several types of individually held values have been found to affect sustainable consumer behaviour. For example, Pepper et al. show that socially conscious consumer behaviour relates to pro-social values while frugal consumer behaviour depends on
Version postprint
personal materialism and income constraints (Pepper et al. 2009). A future study could examine the links between social values, income constraints, concern for purchasing power, concern for food waste and frugality.
Conversely, the low success of the new BTGOFL promotional format developed with to the objective of reducing food waste is linked to a lack of confidence on the part of consumers. Thus a better understanding of the current barriers to its purchase, including skepticism about promotions and temporal orientation is still needed and will also be included in a future study. This new format could ultimately be strongly supported by consumers, and a longitudinal study could provide additional information about changes in consumers’ perceptions of BG-Later offers and the impact of the independent variables of the model on this choice. Besides, two new studies seem interesting to us to complete the results: the first including both price promotions, quantity promotions and studying their influence on choice in relation to the concern for purchasing power and waste-related variables (concern and perceived probability of non-consumption); the second combining (with a conjoint analysis) different brands and different quantity promotions in order to understand the proposed brand-promotion interaction.
Finally, if consumers buy products on promotion that they finally do not consume, they may experience post-purchase dissonance and increased future perceived probability of waste. This in turn may affect their attitudes towards the brand and the retailer and repurchase intention. Thus, fighting food waste at the household level by taking into account this variable in their promotion strategy could become one of the sustainable practices that help retailers build a good image among consumers (Lavorata, 2014) without negative impact on sales.
Future studies and extensions of this research will contribute to extend the results and provide a better understanding of food waste concern but also types of promotions to be offered and consumers’ perceptions of these promotions.
Version postprint
Appendix A.
Reliability and validity
Construct / Items Loadings J’s rho AVE
Concern for food waste (Authors, 2015)
The first factor accounts for 57% of the variance. Cronbach Alpha: 0.90.
I would feel ashamed if someone saw me getting rid of edible food
0.856
0.92 0.62
I am really affected when I see someone throwing edible food away
0.865 Managing food properly in order to waste as less food as possible is
a real concern for me 0.692
If I were to leave food perish, I would be remiss 0.737
Around me, throwing food away is frowned upon 0.789
Throwing food away poses me an ethical problem as regards those
who are starving 0.779
Throwing food away poses me a moral problem as regards my
relatives 0.806
Deal proneness (from Chandon, Wansink and Laurent, 2000) The first factor accounts for 67% of the variance. Cronbach Alpha: 0.91
Promotions really allow to save money 0.856
0.93 0.70
When I take advantage of promotional deals. I get a good deal
0.870 Taking advantage of promotional deals allows to spend less
0.778 When I take advantage of promotional deals. I am proud of the
good deal I got 0.851
Taking advantage of promotional deals is image-enhancing
0.857 Taking advantage of promotional deals allows to see oneself as a
smart shopper 0.807
Attitude (Promotion « P2 ») (from de Pechpeyrou et al., 2006) The first factor accounts for 82% of the variance. Cronbach Alpha: 0.90
This promotional deal is worth it 0.924
0.97 0.83
I like this promotional deal 0.889
This promotional deal makes me want to buy the product 0.909
This promotional deal is credible 0.910
This promotional deal is sincere 0.911
I trust this promotional deal 0.935
Involvement / subjective expertise (Verbeke and Vackier, 2004, for involvement and Brucks, 1986 for subjective expertise)
The first factor accounts for 60% of the variance. Cronbach Alpha: 0.89
Grated cheese has an important place in the food I eat 0.700
0.91 0.64
I like eating grated cheese 0.700
Grated cheese is a product I know well 0.883
Version postprint
Grated cheese is a product I know how to preserve 0.800
Version postprint
Squared correlations
CONCERNFW DEALPRO INVEXP ATTITUDE AVE
CONCERNFW 1 0.112 0.278 0.015 0.834 DEALPRO 0.112 1 0.072 0.031 0.640 INVEXP 0.278 0.072 1 0.026 0.700 ATTITUDE 0.015 0.031 0.026 1 0.524 AVE 0.834 0.640 0.700 0.624 0 HTMT scores
HTMT CONCERNFW DEALPRO INVEXP ATTITUDE
CONCERNFW
DEALPRO 0.175
INVEXP 0.188 0.293
ATTITUDE 0.129 0.559 0.363
HTMT scores are way below the 0.8 threshold commonly retained for discriminant validity (Henseler et al., 2015). Thus, discriminant validity is established.
Version postprint
Appendix B.
Classification matrix (cross-validation) for the choices - Grated cheese:
from* / to 1 Unit P2 P3 Total % correct
1 Unit 10 23 21 54 19%
P2 10 76 56 142 54%
P3 3 37 117 157 75%
Total 23 136 194 353 58%
from = actual choice; To = choice predicted by model
Classification matrix (cross-validation) for the choices - Bread:
from* / to 1 Unit P2 P3 Total % correct
1 Unit 59 12 13 84 70 %
P2 16 50 35 101 50%
P3 9 16 134 159 84%
Total 84 78 182 344 71%
from = actual choice; To = choice predicted by model
Appendix C. Observed choice of products
Product Grated cheese bags Bread baguette(s)
Choice Observed Percentage Observed Percentage
No purchase 40 9.6% 17 4.2%
One unit 54 13.0% 84 21.0%
2 - Pack (P2) 142 34.1% 101 25.2%
3 - Pack (P3) 157 37.7% 156 38.9%
Version postprint
References
Aertsens J., Wim Verbeke, Koen Mondelaers and Guido Van Huylenbroeck Personal determinants of organic food consumption: a review, British Food Journal, Vol. 111 No. 10, 2009, pp. 1140-1167
Ailawadi K.L. & Neslin S.A. (1998), The Effect of Promotion on Consumption: Buying More and Consuming It Faster. Journal of Marketing Research, 35(3), pp.390–398.
Andrews, D. (2016). Product information and consumer choice confidence in multi-item sales promotions. Journal of Retailing and Consumer Services, 28, 45-53.
Arkes H.R. (1996), The Psychology of Waste, Journal of Behavioral Decision Making, 9, 213–224.
Binkley, J. K., & Bejnarowicz, J. (2003). Consumer price awareness in food shopping: the case of quantity surcharges. Journal of Retailing, 79(1), 27-35.
Blattberg, R. C., & Neslin, S. A. (1989). Sales promotion: The long and the short of it.
Marketing letters, 1(1), 81-97.
Bolton, L.E. & Alba J.W. (2012), When less is more: Consumer aversion to unused utility,
Journal of Consumer Psychology, 22, 369–383.
Brucks, M. (1986). A typology of consumer knowledge content. NA-Advances in Consumer
Research Volume 13.
Busby, J.C., Hodan, F. W., & Hyman, J. (2014) The Estimated Amount, Value and Calories of Postharvest Food Losses at the Retail and Consumer Levels in the United States, Economic
Information Bulletin No. (EIB-121) Retrieved 2/22/2015 from www.ers.usda.gov/
media/1282296/eib121.pdf
Chandon, P, B Wansink, & G Laurent (2000), A Benefit Congruency Framework of Sales Promotion Effectiveness, Journal of Marketing, 64, 65–84.
Version postprint
De Pechpeyrou, P., & Odou, P. (2012). Consumer skepticism and promotion effectiveness.
Recherche et Applications en Marketing (English Edition), 27(2), 45-69.
Evans D. (2011), Blaming the consumer–once again: the social and material contexts of everyday food waste practices in some English households, Critical Public Health 21, 429– 440.
Farr‐Wharton, G., Foth, M., & Choi, J. H. J. (2014). Identifying factors that promote consumer behaviours causing expired domestic food waste. Journal of Consumer Behaviour, 13(6), 393-402
Foubert, B., & Gijsbrechts, E. (2007). Shopper response to bundle promotions for packaged goods. Journal of Marketing Research, 44(4), 647-662.
Graham-Rowe E., Jessop D.C., Sparks P., 2014, Identifying motivations and barriers to minimising household food waste, Resources, Conservation and Recycling, 84, 15–23 Grankvist G., H. Lekedal and M. Marmendal, 2007, Values and eco- and fair-trade labelled products, British Food Journal, 109 (2), 169-181
Grunert, K. G., Hieke, S., & Wills, J. (2014). Sustainability labels on food products: Consumer motivation, understanding and use. Food Policy, 44, 177-189.
Henseler, J. Ringle, C. and Sarstedt, M. (2015), A new criterion for assessing discriminant validity in variance-based structural equation modeling, Journal of the Academy of Marketing
Science, 43, 115-135.
Hunt, K. A., Keaveney, S. M., & Lee, M. (1995). Involvement, attributions, and consumer responses to rebates. Journal of business and psychology, 9(3), 273-297.
Laroche M., Pons F., Zgoll N., & Kim C.(2001), Consumers use of price promotions: a model and its potential moderators, Journal of Retailing Consumer Services, 8, 251-260
Version postprint
Lastovicka, J. L., Bettencourt, L. A., Hughner, R. S., & Kuntze, R. J. (1999). Lifestyle of the tight and frugal: Theory and measurement. Journal of consumer research, 26(1), 85-98. Lavorata, L. (2014). Influence of retailers’ commitment to sustainable development on store image, consumer loyalty and consumer boycotts: Proposal for a model using the theory of planned behavior. Journal of Retailing and Consumer Services, 21(6), 1021-1027.
Lichtenstein D., Netemeyer R. & Burton S. (1995), Assessing the domain specificity of deal proneness: a field study, Journal of Consumer Research, 22, 3, 314-326
Lichtenstein D.R., R.G. Netemeyer, & S. Burton (1990), Distinguishing coupon proneness from value consciousness: an acquisition-transaction utility theory perspective, Journal of
Marketing, 54, 54–67
Lyndhurst, B., Cox, J., & Downing, P. (2007). Food behaviour consumer research: quantitative phase. Waste & Resources Action Programme (WRAP): Banbury, UK. Manning, K.C. & Sprott, D.E. (2007), Multiple unit price promotions and their effects on quantity purchase intentions, Journal of Retailing, Vol. 83 No. 4, pp. 411-421
Mano H & Elliott MT (1997), Smart shopping: the origins and consequences of price savings. Advances in Consumer Research, 24, 504–510.
Nijs, V., Dekimpe, M., Steenkamp, J-B., & Hanssen, D. (2001). The Category-Demand Effect of Price Promotions, Marketing Science, 20, 1-22
Obermiller C. & Spangenberg E. (2000), On the origin and distinctness of skepticism towards advertising, Marketing Letters, 11,4, 311-322.
Pechtl H. (2004), Profiling intrinsic deal proneness for HILO and EDLP price promotion strategies, Journal of Retailing and Consumer Services, 11, 223–233
Version postprint
Pepper, M. Jackson, T. and Uzzell, D. (2009), An examination of the values that motivate socially conscious and frugal consumer behaviours, International Journal of Consumer
Studies, 33, 126-136.
Quested T. E., Marsh E., Stunell D., Parry A.D. (2013), Spaghetti soup: the complex world of food waste behaviours, Resources Conservation Recycling, 79, 43-51.
Raghubir P., Inman J., & Grande H. (2004), The three faces of consumer promotions: economic, informative, and affective, California Management Review, 46,4, 23-42
Stefan, V., van Herpen, E., Tudoran, A. A., & Lähteenmäki, L. (2013). Avoiding food waste by Romanian consumers: The importance of planning and shopping routines. Food Quality
and Preference, 28(1), 375-381.
Verbeke, W. & Vackier, I. (2004), Profile and effects of consumer involvement in fresh meat, Meat science, 67, 1, 159–168.
Wansink, B., Kent, R., Hoch, S.J. (1998), An anchoring and Adjustment Model of Purchase Quantity Decisions, Journal of Marketing Research, 35, 71-81.
Winer, R. S. (1986), A reference price model of brand choice for frequently purchased products, Journal of Consumer Research, 13, 2, 250-256.
Yoon, S. & Vargas, P. T. (2010), Feeling happier when paying more: Dysfunctional counterfactual thinking in consumer affect. Psychology and Marketing, 27, 1075–1100
Zaichkowsky, J. L. (1985). Familiarity: product use, involvement or expertise?. NA-Advances