Introduction
The removal of attachments and adhesive resin from tooth surfaces without iatrogenic damage is the main objective of bracket debonding. Factors such as the time needed for complete removal and potential damage to the enamel are essential for the clinician. Adhesive removal is necessary to eliminate potential plaque retention and to restore the aesthetic appearance of the enamel surface. Incorrect debonding techniques, such as the use a diamond bur, can cause enamel damage and can be more time-consuming (Zachrisson and Årtun, 1979; Campbell, 1995; Zarinnia et al., 1995; Ireland et al., 2005).
The amount of enamel loss and residual adhesive on teeth have been reported and discussed in the literature. Several factors, such as the type of adhesive resin and debonding instruments, are related to the amount of enamel loss (Gwinnett and Gorelick, 1977; Retief and Denys, 1979; Zachrisson and Årtun, 1979; Pus and Way, 1980; Diedrich, 1981; Thompson and Way, 1981; Campbell, 1995; Hong and Lew, 1995; Van Waes et al., 1997).
Enamel loss and adhesive remnants following bracket removal
and various clean-up procedures in vitro
Sacha Ryf*, Simon Flury**, Senthamaraiselvi Palaniappan***, Adrian Lussi**,
Bart van Meerbeek*** and Brigitte Zimmerli**
,***
Departments of *Orthodontics and Dentofacial Orthopedics, **Preventive, Restorative and Pediatric Dentistry, School of Dental Medicine, University of Bern, Bern, Switzerland and ***Leuven BIOMAT Research Cluster, Department of Conservative Dentistry, School of Dentistry, Oral Pathology and Maxillo-Facial Surgery, Catholic University of Leuven, Leuven, Belgium
Correspondence to: Dr Sacha Ryf, Klinik für Kieferorthopädie der Universität Bern, Freiburgstrasse 7, 3010 Bern,
Switzerland. E-mail: [email protected]
SUMMARY This study evaluated the enamel loss and composite remnants after debonding and clean-up.
The tested null hypothesis is that there are no differences between different polishing systems regarding removing composite remnants without damaging the tooth surface. Brackets were bonded to 75 extracted human molars and removed after a storage period of 100 hours. The adhesive remnant index (ARI) was evaluated. The clean-up was carried out with five different procedures: 1. carbide bur; 2. carbide bur and Brownie and Greenie silicone polishers; 3. carbide bur and Astropol polishers; 4. carbide bur and Renew polishers; and 5. carbide bur, Brownie, Greenie and PoGo polishers. Silicone impressions were made at baseline (T0) and after debonding (T1) and polishing (T2) to produce plaster replicas. The replicas were analysed with a three-dimensional laser scanner and measured with analytical software. Statistical analysis was performed with the Kruskal–Wallis test and pairwise Wilcoxon tests with Bonferroni–Holm adjustment (a = 0.05).
Enamel breakouts after debonding were detectable in 27 per cent of all cases, with a mean volume loss of 0.02 mm3 (±0.03 mm3) and depth of 44.9 mm (±48.3 mm). The overall ARI scores was 3 with a few
scores of 1 and 2. The composite remnants after debonding had a mean volume of 2.48 mm3 (±0.92 mm3).
Mean volume loss due to polishing was 0.05 mm3 (±0.26 mm3) and the composite remnants had a mean
volume of 0.22 mm3 (±0.32 mm3). There were no statistically significant differences in volumetric changes
after polishing (P = 0.054) between the different clean-up methods. However, sufficient clean-up without enamel loss was difficult to achieve.
Care should be taken when using bond removers and scalers, as excessive force with such instruments can visibly gouge the enamel. The use of a green rubber wheel followed by pumice was recommended by Gwinnett and Gorelick (1977). However, Zachrisson and Årtun (1979) recommended the use of tungsten carbide burs at low speed followed by pumice and/or polishing cups not only because they caused the finest scratch pattern and the least loss of surface enamel but also due to the superior accessibility to different developmental irregularities and other difficult-to-reach areas. The use of a tungsten carbide bur at high speed, finishing with graded medium, fine and superfine Sof-Lex discs at low speed, and a final finishing with a rubber cup and Zircate paste was also recommended by Zarinnia et al. (1995). Stainless steel finishing burs were found to be the most inefficient for residual resin removal (Zarinnia et al., 1995). The best method of composite remnant removal after debonding appears to be the low-speed tungsten carbide bur (Oliver and Griffiths, 1992). Nowadays, the variability of different polishers is high regarding material (silicone
carbide, silicone dioxide, or diamond particles). Eventhough analyses regarding polishing capabilities of restorative materials exist (Botta et al., 2009; Marghalani, 2010), efficiency in removal and protective properties for tooth substance have, to date, not been investigated.
Previous studies have examined enamel loss and surface alterations after debonding by comparing weights (Davis et al., 2002), using a planer surfometer (Hosein et al., 2004), profilometry (Eliades et al., 2004; Kim et al., 2007), and by scanning electron microscopy (Gwinnett and Gorelick, 1977; Retief and Denys, 1979; Oliver and Griffiths, 1992; Zarinnia et al., 1995; Osorio et al., 1998; Brosh et al., 2005; Fjeld and Øgaard, 2006). As all techniques allow only a small number of measurements per tooth surface, it can be assumed that local enamel defects produced by rotary instruments or residual composite must influence the results (Van Waes et al., 1997) or are not even detected. Moreover, non-flat surfaces are more difficult to analyse. Devices, such as profilometers, optical sensors, or laser scanning devices, must be used. These can adequately quantify volume and vertical loss (Heintze et al., 2006a). In addition, the laser sensor has some advantages such as speed and simplicity (Heintze et al., 2006a). The differentiation between enamel loss and adhesive remnants is reliable with three-dimensional (3D) laser scanning techniques (Al Shamsi et al., 2007). Currently, only a few investigations have quantified enamel loss by laser scanning procedures (Van Waes et al., 1997) and the time required for polishing procedures has therefore been described in only a few studies (Oliver and Griffiths, 1992; Krell et al., 1993).
The aim of this research was to evaluate different polishing methods for their ability to remove the adhesive remnants without damaging the tooth surface. The working hypothesis was that there was no difference between the tested polishing procedures regarding enamel loss and adhesive remnants.
Materials and methods Sample preparation
Seventy-five extracted human molars were thoroughly debrided and stored in an aqueous solution of thymol (0.1 per cent) at room temperature to prevent dehydration. Prior to the start of the experiment the teeth were rinsed and randomly assigned to five equal groups of 15 teeth. To simplify matching of the laser scan evaluation on each tooth surface, three small pits were made with a diamond bur as a reference.
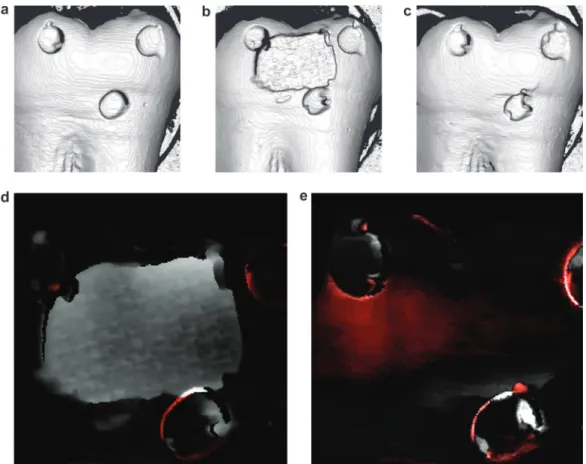
Silicone impressions (President microSystem light/ regular body; Coltène/Whaledent AG, Altstätten, Switzerland) were taken of the buccal surfaces of the teeth. Baseline models (T0) were produced in dental stone (Fuji Super Hardrock, GC, Leuven, Belgium) and scanned with the 3D imaging device (Laserscan 3-D Pro; Willytec GmbH, Gräfelfingen, Germany) to establish T0 data (Figure 1a).
The measuring principle of the scanner device has been explained by Mehl et al. (1997).
All teeth were then bonded according to the manufacturers’ instructions: the buccal enamel was etched for 20 seconds with a 35 per cent phosphoric acid gel (Ultra-Etch; Ultradent Products, South Jordan, Utah, USA), rinsed with water spray for 10 seconds, air-dried for 5 seconds (with oil-free compressed air), and sealed with Transbond Liquid (3M Unitek, Monrovia, California, USA). Transbond XT adhesive (3M Unitek) was placed onto the bracket pad, and the bracket was firmly pressed on the prepared enamel; the excess adhesive was then removed with an explorer. The adhesive was light-cured with an Ortholux XT Visible Light Curing Unit (3M Unitek) for 5 seconds at each side (left and right). The upper second molar brackets used in this study had 0.022 inch slots (Forestadent, Pforzheim, Germany). The teeth were stored in a humid chamber at a temperature of 37°C for 100 hours.
Bracket removal
The brackets were debonded by gently squeezing with Weingart pliers (3M Unitek). A second impression was taken of the buccal surfaces of the teeth after debonding (T1), and replicas were made in dental stone (Figure 1b).
The amount of adhesive remaining was determined by visual inspection using the Adhesive Remnant Index (ARI) (Årtun and Bergland, 1984).
0: No adhesive left on the tooth.
1: Between 0 and 50 per cent of adhesive left on the tooth. 2: Between 51 and 99 per cent of adhesive left on the tooth. 3: All adhesive left on the tooth.
Clean-up (T2)
The residual adhesive on each tooth in the five groups was removed using one of the five following protocols: group 1, carbide bur (Figure 2a); group 2, carbide bur followed by Brownies and Greenies (Figure 2b); group 3, carbide bur followed by Astropol F, P, and HP polishers (Figure 2c); group 4, carbide bur followed by the Renew System (Figure 2d); and group 5, carbide bur followed by Brownies and Greenies and finished with a PoGo polisher (Figure 2e).
An eight-bladed tungsten carbide finishing bur was used in a low-speed contra-angle handpiece (less than 20 000 rpm) and a new bur was used after 10 teeth in every group. The finishing materials are listed in Table 1 and the finishing procedures in Table 2.
The polishing was continued until no visible adhesive remnants could be detected. The removal of the remnant adhesive and restoration of the enamel surface to as close as possible to the T0 condition were verified by visual inspection under a dental operating light. The time taken to T2 was recorded in seconds with a digital stopwatch. All bonding, debonding, and clean-up procedures were performed by the same operator (SR).
A third impression (T2) was then taken of the surface of every tooth (Figure 1c).
Surface analysis
A total of 225 models were scanned with the 3D laser scanning instrument by a second operator (BZ) blinded to the test groups. The laser beam had a width of 22 mm and was projected to the surface. The sample was moved in the y-axis by a micro-step motor. This enabled calculation of the surface
differences of a defined area respecting different measurement points per sample. The scanned dental stone models were processed and matched using Match-3D software (Stemmer Imaging, Puchheim, Germany). Matching the T1 and T2 models to T0 was achieved by superimposing and aligning the three small pits of the surface that served as defined references. The match was only accepted if the standard deviation was less than 20 mm (Söderholm et al., 2001). By superimposing two models, the software calculated a digital Figure 1 Images at baseline (T0). (a), after bracket removal (T1) (b) with a clearly visible resin remnant, after clean-up
(c) and differences after overlapping baseline T0 and T1 (d). Resin remnant is shown (white) and (e) T0 and T2. Loss of surface substance (red) and resin remnants (white) are visible.
Figure 2 (a) Group 1 (carbide bur). (b) Group 2 (carbide bur, Shofu Brownie and Shofu Greenie). (c) Group 3 (carbide bur, Astropol polishing system:
subtraction and generated a differential image that was used for quantification of the surface alterations. The differential image showed surface alteration by colour mapping that facilitated surface evaluation. The measurements were made by scanning the whole area of interest (bonding interface) for evaluation of volumetric and vertical mean, minimum, and maximum values. It has been shown that this technique has a high reproducibility with a variability of 0.4 per cent for the mean value (Heintze et al., 2006a) and therefore if the matching procedure was accepted, one laser scanning surface measurement per sample was performed.
By matching T1 to T0, the height and volume of composite remnant was recorded (Figure 1d). If present, enamel defects were recorded in terms of depth of lesion and volume loss. Therefore, the areas of interest analysed from the differential image were selected and separately measured. Comparing the T2 with the T0 models, vertical and volumetric changes in surface geometry were measured (Figure 1e). However, enamel breakouts that were recorded by superimposing T1 on T0 were always at the margin of the area of interest and excluded from further surface analysis. If defined, composite remnants were left, and the height and volume of the remnants were separately recorded.
Table 1 Finishing instruments (grit/contents according to manufacturers’ information). N.A., further information was not available from
the manufacturer.
Finishing instrument Grit Manufacturer
Carbide finishing bur (OWA-Carbide) N.A. Maillefer, Ecublens, Switzerland Brownie Silicone Polisher 35–48 mm (silicone carbide) Shofu, Kyoto, Japan
Greenie Silicone Polisher 6 mm (silicone carbide) Shofu
Astropol F (Finieren) (grey) 40 mm (silicone dioxide) Ivoclar Vivadent AG, Schaan, Liechtenstein Astropol P (Polieren) (green) 20–40 mm (silicone dioxide) Ivoclar Vivadent AG
Astropol HP (Hochglanz-polieren) (red) 10 mm (silicone dioxide and diamond particles) Ivoclar Vivadent AG Renew System Points#383—Friction
Grip—#RSPFG 240–320 mm (N.A.) Reliance Orthodontic Products, Itasca, Illinois, USA PoGo 20 mm (diamond) Dentsply, Milford, Illinois, USA
Table 2 Finishing procedures.
Finishing procedure Finishing instruments Mean total polishing time (s) Group 1 (n = 15) Carbide bur 65.9 ± 14.0 Group 2 (n = 15) Carbide burShofu Brownie 121.4 ± 23.3
Shofu Greenie Group 3 (n = 15) Carbide bur 160.0 ± 19.5 Astropol F Astropol P Astropol HP
Group 4 (n = 15) Carbide burRenew System 83.6 ± 15.5 Group 5 (n = 15) Carbide bur 183.5 ± 14.1 Shofu Brownie Shofu Greenie PoGo Statistical analysis
The single laser scanning point measurements from one sample were calculated for the selected area of interest and the mean values for alterations of volume and vertical dimension were given by the Match-3D software. The mean values from each sample of the single polishing group were averaged to obtain one mean value. As enamel breakouts and composite remnants after debonding were not related to the polishing groups, they were analysed and descriptive statistics were employed over all samples. Detectable composite remnants after clean-up were measured separately and are only descriptively described. However, they were included in the overall surface measurements after clean-up and taken into account for final statistical analysis. Differences between the clean-up groups were analysed with the Kruskal–Wallis test. Pairwise differences between the test groups were analysed with pairwise Wilcoxon tests with Bonferroni–Holm adjustment. The Spearman correlation coefficient of linear (height/depth) surface alterations and volumetric changes was calculated. The level of significance was set at a = 0.05.
Results
Comparison of T0 and T1 impressions
Enamel defects after debonding were detectable in 27 per cent of the teeth (20 samples). One enamel defect was detected in a sample with ARI score 1 (volume loss −0.13 mm3). Nineteen samples with breakouts had an ARI score
of 2 (mean volume loss −0.02 mm3). There were no
breakouts in samples with an ARI score of 0 (no samples) and ARI score of 3 (46 samples). The deepest part of thebreakout was −297.8 mm, and mean depth was −44.9 mm (±48.3 mm). Mean volume loss due to enamel breakout was 0.02 mm3 (±0.03 mm3). Composite remnants after debonding
had a mean height of 200.2 mm (±55.3 mm) and a mean volume of 2.48 mm3 (±0.92 mm3). The mean composite
remnant for ARI score 1 (three samples) was 0.62 mm3, ARI
score 2 (26 samples) 2.23 mm3, and ARI score 3 (46 samples)
2.78 mm3. Qualitative and quantitative composite remnant
Comparison of T0 and T2 impressions
Clear detectable resin remnants were found in 27 per cent of teeth (20 samples) but were not related to the enamel breakouts in T0 measurements. The average of the highest part of the remaining composite was 229.2 mm (±135.6 mm), and the overall average of the remaining composite was 75.3 mm (±52.6 mm). The mean composite volume remnant was 0.22 mm3 (±0.32 mm3). Although composite
remnants were included in the overall surface measurements, larger areas of composite remnants were not equally distributed: clean-up group 1 had three samples with clear detectable resin remnants (volume: 0.12 mm3, height: 57.9
mm), group 2 had two samples (0.15 mm3, 152.9 mm),
group 3 had four samples (0.25 mm3, 75.4 mm), group 4
had four samples (86.78 mm3, 0.5 mm), and group 5 seven
samples (0.10 mm3, 54.1 mm). The mean surface change
was −4.1 mm (±15.4 mm), and the mean volume change was −0.05 mm3 (±0.26 mm3). Clean-up time was only minimally
influenced by the volume of composite remnants after debonding (Spearman rank correlation coefficient: −0.17). There was no correlation between clean-up time and remaining composite or enamel loss. The results of surface alterations and volume change with different clean-up methods are listed in Tables 3 and 4 and in Figures 3, 4a, and 5. No significant influence of clean-up method on surface alterations was found (P > 0.05, Kruskal–Wallis test) (Figure 3). However, this result was borderline (P = 0.054). Evaluating the differences between the clean-up groups with the Wilcoxon test revealed a significant difference between groups 2 and 5 (P = 0.003), whereas the
other groups showed no significant differences, although the difference between groups 4 and 5 was almost significant (P = 0.04; but not significant due to Bonferroni correction). Comparisons of the variances of the different clean-up procedures’ total volume loss and composite remnants showed that there were differences, although not significant, between the groups (Figure 4a and 4b). The least aggressive method for enamel, with minor removal of hard dental substance, was found in group 3. The method in group 1 seemed to be more aggressive. However, all methods left some remaining composite on the tooth surface, with group 5 leaving the most. Spearman correlation showed a clear linear correlation of volume alteration to linear surface alterations (correlation coefficient: 0.95; Figure 6).
Comparing the mean times for resin removal showed that using burs only was the fastest method, at 65.9 seconds (±14.0 seconds), followed by the carbide bur combined with the Renew System at 83.6 seconds (±15.5 seconds). When three or more steps were required for polishing, the mean time increased. In group 2, with three steps, it took 121.4 seconds (±23.3 seconds), while in groups 3 and 5, with four steps each, it took 160.0 seconds (±19.5 seconds) and 183.5 seconds (±14.1 seconds), respectively (Table 2).
Discussion
The aim of this study was to evaluate different polishing methods for their ability to remove adhesive remnants without damaging the tooth surface. A post-cleaning mean enamel loss of 22.8 or 50.5 mm for resin-modified glass ionomer cement or resin-coated adhesive precoated brackets,
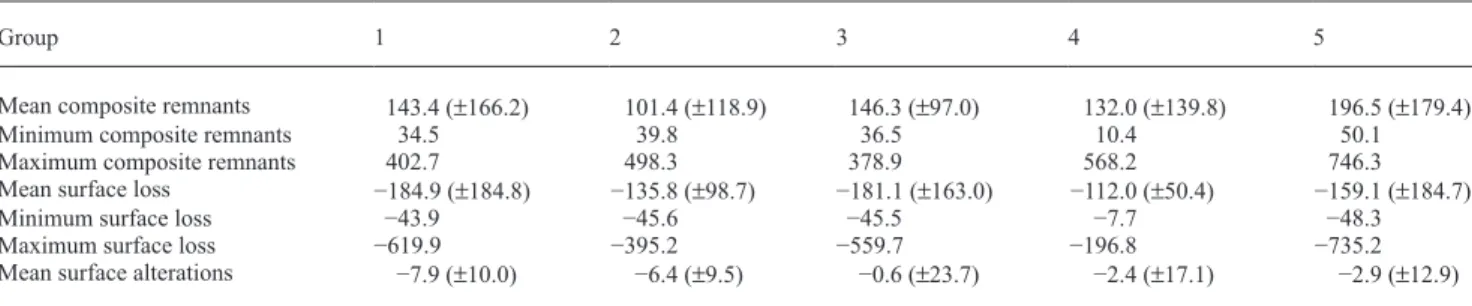
Table 3 Results of surface changes in micrometres (± standard deviation) for the groups as listed in Table 2.
Group 1 2 3 4 5
Mean composite remnants 143.4 (±166.2) 101.4 (±118.9) 146.3 (±97.0) 132.0 (±139.8) 196.5 (±179.4) Minimum composite remnants 34.5 39.8 36.5 10.4 50.1 Maximum composite remnants 402.7 498.3 378.9 568.2 746.3 Mean surface loss −184.9 (±184.8) −135.8 (±98.7) −181.1 (±163.0) −112.0 (±50.4) −159.1 (±184.7)
Minimum surface loss −43.9 −45.6 −45.5 −7.7 −48.3
Maximum surface loss −619.9 −395.2 −559.7 −196.8 −735.2 Mean surface alterations −7.9 (±10.0) −6.4 (±9.5) −0.6 (±23.7) −2.4 (±17.1) −2.9 (±12.9)
Table 4 Results of volume changes in cubic millimetres (± standard deviation) for the groups as listed in Table 2.
Groups 1 2 3 4 5
Mean composite remnants 0.11 (±0.14) 0.11 (±0.08) 0.21 (±0.24) 0.24 (±0.38) 0.22 (±0.19) Minimum composite remnants 0.00 0.05 0.05 0.06 0.01 Maximum composite remnants 0.37 0.30 0.36 0.42 0.55 Mean surface loss −0.25 (±0.17) −0.22 (±0.12) −0.19 (±0.15) −0.26 (±0.15) −0.25 (±0.19)
Minimum surface loss −0.07 −0.09 −0.09 −0.05 −0.08
Maximum surface loss −0.57 −0.49 −0.66 −0.57 −0.75
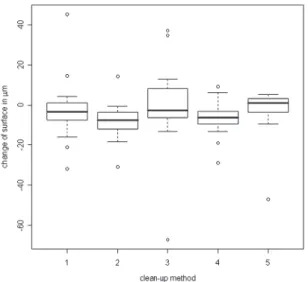
Figure 3 Box-and-whisker plot showing median, first and third quartiles,
and minimum and maximum values. Circles denote outliers in volume alterations after clean-up with five different methods. Groups as listed in Table 2.
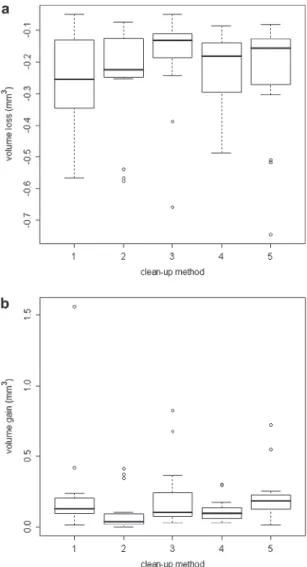
Figure 4 Loss of volume (a) and composite remnants (b) after clean-up
with five different methods. Groups as listed in Table 2.
respectively, has been described by Al Shamsi et al. (2007). Others have reported a mean loss of enamel ranging from 29.5 to 41.2 mm for filled resin (Pus and Way, 1980). A loss of enamel, of only 5–10 mm, has been reported by Zachrisson and Årtun (1979). This study achieved a mean enamel loss of 4.1 mm in all samples, and 2.9 mm when burs were combined with polishers, which is considerably less than in other studies. A mean enamel loss of 7.4 mm with a tungsten carbide bur has been described but with lower enamel loss and less damage to the enamel when those burs are used carefully (Van Waes et al., 1997). In the present study, the mean enamel loss was 7.9 mm when only burs were used for eliminating resin. It seems reasonable that using burs only is more aggressive because it is more difficult to eliminate all the resin with only one bur than gently beginning with burs and finishing with fine polishers. Nevertheless, care with the line angle and cervical areas should be taken when using a tungsten carbide bur for removal of resin (Schuler and Van Waes, 2003) and also the choice of bur (Radlanski, 2001). Care should also be taken not only at the end of treatment when debonding brackets but also when brackets need to be rebonded during treatment. Remnant adhesive and enamel loss are not consistently distributed over the tooth surfaces (Van Waes et al., 1997; Al Shamsi et al., 2007). Previous studies appear to have reported average values, and in only one study was the minimum and the maximum on the surfaces reported (1 and 52 mm) (Van Waes et al., 1997); the range in the current study was between 43.9 and 619.9 mm for burs only and ranged from 7.7 to 735.2 mm for all samples. Despite gentle removal of the remaining adhesive and subsequent polishing, some scratches and grooves could be observed (Zachrisson and Årtun, 1979; Van Waes et al., 1997). Clean-up with carbide burs resulted in a high variability of surface alterations. On the one hand, some samples showed a high amount of enamel loss, whereas on the other hand, the overall composite remnants were quite high. As the scanner evaluated the whole surface, it seems reasonable that the scratches and grooves described above led to the present results. The least volume loss was generated by the application of silicone dioxide and diamond particles. This polishing kit, although it did not remove all composite remnants, gave a shiny and smooth surface that was optically evaluated as an accurate clean-up. This polishing system has previously been reported as being successful for composite polishing (Heintze et al., 2006b).
Overall, most composite remnants were detected within group 5. This is notable as this method had one polishing instrument more than that in group 2 with the least amount of composite remnants. This finding may be a result of the added instrument of the PoGo polishers that has small diamond particles and is provided as a single step polisher. Therefore, after a short polishing time, the surface seems lustrous and may not require further polishing, whereas in group 2, the last polisher used was a Greenie silicone carbide polisher. This
polisher is prone to leaving remnants in pores of composite and at the margin, making the restorative material easily detectable. Although the manufacturers of the Renew system did not provide further grit and composition information, the abrasive particles appear to be rough. Therefore, the variation in surface loss due to this system might be increased for the same reasons as for the carbide bur.
Although polishing procedures were continued until no visual adhesive remnants could be detected, traces of composite were still observed in 27 per cent of the samples (20 teeth), mainly in T0 present grooves (Hong and Lew, 1995), but clinically these results would be interpreted as complete composite removal. Furthermore, adequate composite polishing with a high surface gloss may tend to stop the clinician from further polishing.
Deep localized enamel fractures of 100 mm and total enamel loss of 150–160 mm have been described by Diedrich (1981). Figure 5 Surface alteration after clean-up with five different methods.
Groups as listed in Table 2.
Figure 6 Correlation of linear versus volumetric surface changes.
Spearman rank correlation coefficient = 0.95.
The deepest fracture in the present study was 298 mm, which was still in the enamel layer, as bonded surfaces usually have a thickness of 1500–2000 mm (Thompson and Way, 1981).
For all practical purposes, the final enamel appearance after debonding should be comparable with the adjacent natural enamel surfaces, dry as well as wet. Examination of the dry appearance is important because reflection and refraction phenomena associated with a wet surface could mask surface irregularities (Zarinnia et al., 1995).
Care should also be taken regarding the choice of etching time before bonding. More adhesive remaining on the teeth when enamel was etched for 60 versus 15 seconds has been observed by Osorio et al. (1999). Absolute enamel loss also decreases when enamel is etched for a shorter time (Osorio et al., 1999). Another study described fewer irreversible changes to the enamel surface after bonding with self-etching adhesives or conditioners with polyacrylic acid in comparison with conventional acid etching and bonding (Fjeld and Øgaard, 2006). The most popular bonding systems in orthodontics are based on resin composite materials that are attached to the enamel surface according to a micromechanical retention principle. A relatively strong acid, generally 35–40 per cent phosphoric acid, is applied for approximately 30 seconds to clean the surface and partially dissolve the minerals. Bonding brackets to such a surface results in thick resin tags, penetrating relatively deep into the enamel. Alterations in enamel structure can be observed up to 50 mm. Self-etching systems result in smaller and fewer resin tags. The possible higher failure rate of bonding systems based on self-etching primer might be outweighed by the fewer irreversible effects on the enamel structures (Fjeld and Øgaard, 2006).
Enamel surface structures examined before bonding has shown individual variation, as most surfaces demonstrate the characteristic perichymata seen in young enamel (Zachrisson and Årtun, 1979). Although enamel breakouts are frequent in untreated teeth, e.g. 25–30 per cent in molars (Zachrisson et al., 1980), care should also be taken when debonding brackets with pliers, as it was found that 27 per cent of all teeth had enamel breakouts after debonding. Most of the enamel breakouts were flattened after the polishing procedures, but not only did debonding cause irreversible changes to the enamel but removing the remaining resin with the carbide bur also produced deep grooves on the surface. Although polishing reduced the scratches, resulting in a smooth surface, the surface lost perichymata, indicating considerable enamel loss (Zachrisson and Årtun, 1979).
The time taken for polishing could not be directly compared with other studies (Oliver and Griffiths, 1992; Krell et al., 1993), as they used different polishing methods. Only in one study (Krell et al., 1993) was a carbide bur alone used for removing resin and polishing under similar conditions. Less time was required in the present study (65.9 ± 14.0 seconds) than described (113.2 ± 14.4 seconds) by Krell et al. (1993). A mean total time for polishing with a carbide bur, finishing with medium and fine discs and final polishing
with a rubber cup, of 253.3 ± 73.7 seconds has been described by Oliver and Griffiths (1992), whereas less time for the four-step procedures (160.0 ± 19.5 seconds and 183.5 ± 14.1 seconds, respectively) was needed in the current study.
Conclusions
1. Clean-up procedures with carbide burs only may result in the removal of too much tooth substance; a large amount of composite on the surface was also observed in the present study.
2. Multi-step rubber polishing kits seem to have advantages in preventing enamel loss.
3. Polishing systems with good composite polishing properties may leave a lustrous surface and therefore more composite remnants as they become invisible. 4. Different clean-up methods have no significant influence
on surface alterations, but adequate clean-up without enamel loss is difficult to achieve.
Acknowledgements
The authors are indebted to Dentsply DeTrey, Germany, for the PoGo-Polishers; to Ortho Walker, Switzerland, for the carbide burs and the Reliance polishers; and to Dr S. Heintze (Ivoclar Vivadent AG) for the explanations of surface measurements.
References
Al Shamsi A H, Cunningham J L, Lamey P J, Lynch E 2007 Three-dimensional measurement of residual adhesive and enamel loss on teeth after debonding of orthodontic brackets: an in vitro study. American Journal of Orthodontics and Dentofacial Orthopedics 131: 301.e9–e15
Årtun J, Bergland S 1984 Clinical trials with crystal growth conditioning as an alternative to acid-etch enamel pretreatment. American Journal of Orthodontics 85: 333–340
Botta A C, Duarte S, Paulin Filho P I, Gheno S M, Powers J M 2009 Surface roughness of enamel and four resin composites. American Journal of Dentistry 22: 252–254
Brosh T, Strouthou S, Sarne O 2005 Effects of buccal versus lingual surfaces, enamel conditioning procedures and storage duration on brackets debonding characteristics. Journal of Dentistry 33: 99–105 Campbell P M 1995 Enamel surfaces after orthodontic bracket debonding.
Angle Orthodontist 65: 103–110
Davis V A, Staley R N, Bigleow H F, Jakobsen J R 2002 Remnant amount and cleanup for 3 adhesives after debracketing. American Journal of Orthodontics and Dentofacial Orthopedics 121: 291–296
Diedrich P 1981 Enamel alterations from bracket bonding and debonding: a study with the scanning electron microscope. American Journal of Orthodontics 79: 500–522
Eliades T, Gioka C, Eliades G, Makou M 2004 Enamel surface roughness following debonding using two resin grinding methods. European Journal of Orthodontics 26: 333–338
Fjeld M, Øgaard B 2006 Scanning electron microscopic evaluation of enamel surfaces exposed to 3 orthodontic bonding systems. American Journal of Orthodontics and Dentofacial Orthopedics 130: 575–581 Gwinnett A J, Gorelick J 1977 Microscopic evaluation of enamel after
debonding, clinical application. American Journal of Orthodontics 71: 651–665
Heintze S D, Cavalleri A, Forjanic M, Zellweger G, Rousson V 2006b A comparison of three different methods for the quantification of the
in vitro wear of dental materials. Dental Materials 22: 1051–1062
Heintze S D, Forjanic M, Rousson V 2006a Surface roughness and gloss of dental materials as a function of force and polishing time in vitro. Dental Materials 22: 146–165
Hong Y H, Lew K K 1995 Quantitative and qualitative assessment of enamel surface following five composite removal methods after bracket debonding. European Journal of Orthodontics 17: 121–128
Hosein I, Sherriff M, Ireland A J 2004 Enamel loss during bonding, debonding, and cleanup with use of a self-etching primer. American Journal of Orthodontics and Dentofacial Orthopedics 126: 717–724 Ireland A J, Hosein I, Sherriff M 2005 Enamel loss at bond-up, debond and
clean-up following the use of a conventional light-cured composite and a resin-modified glass polyalkenoate cement. European Journal of Orthodontics 27: 413–419
Kim S S, Park W K, Son W S, Ahn H S, Ro J H, Kim Y D 2007 Enamel surface evaluation after removal of orthodontic composite remnants by intraoral sandblasting: a 3-dimensional surface profilometry study. American Journal of Orthodontics and Dentofacial Orthopedics 132: 71–76
Krell K V, Courey J M, Bishara S E 1993 Orthodontic bracket removal using conventional and ultrasonic debonding techniques, enamel loss, and time requirements. American Journal of Orthodontics and Dentofacial Orthopedics 103: 258–266
Marghalani H Y 2010 Effect of finishing/polishing systems on the surface roughness of novel posterior composites. Journal of Esthetic and Restorative Dentistry 22: 127–138
Mehl A, Gloger W, Kunzelmann K H, Hickel R 1997 A new optical 3-D device for the detection of wear. Journal of Dental Research 76: 1799–1807
Oliver R G, Griffiths J 1992 Different techniques of residual composite removal following debonding—time taken and surface enamel appearance. British Journal of Orthodontics 19: 131–137
Osorio R, Toledano M, Garcia-Godoy F 1998 Enamel surface morphology after bracket debonding. ASDC Journal of Dentistry for Children 65: 313–317
Osorio R, Toledano M, Garcia-Godoy F 1999 Bracket bonding with 15- or 60-second etching and adhesive remaining on enamel after debonding. Angle Orthodontist 69: 45–49
Pus M D, Way D C 1980 Enamel loss due to orthodontic bonding with filled and unfilled resins using various clean-up techniques. American Journal of Orthodontics 77: 269–283
Radlanski R J 2001 A new carbide finishing bur for bracket debonding. Journal of Orofacial Orthopedics 62: 296–304
Retief D H, Denys F R 1979 Finishing of enamel surfaces after debonding of orthodontic attachments. Angle Orthodontist 49: 1–10
Schuler F S, Van Waes H 2003 SEM-evaluation of enamel surfaces after removal of fixed orthodontic appliances. American Journal of Dentistry 16: 390–394 Söderholm K J et al. 2001 Clinical wear performance of eight experimental
dental composites over three years determined by two measuring methods. European Journal of Oral Science 109: 273–281
Thompson R E, Way D C 1981 Enamel loss due to prophylaxis and multiple bonding/debonding of orthodontic attachments. American Journal of Orthodontics 79: 282–295
Van Waes H, Matter T, Krejci I 1997 Three-dimensional measurement of enamel loss caused by bonding and debonding of orthodontic brackets. American Journal of Orthodontics and Dentofacial Orthopedics 112: 666–669 Zachrisson B U, Årtun J 1979 Enamel surface appearance after various
debonding techniques. American Journal of Orthodontics 75: 121–137 Zachrisson B U, Skogan O, Höymwyhr S 1980 Enamel cracks in debonded,
debanded, and orthodontically untreated teeth. American Journal of Orthodontics 77: 307–319
Zarinnia K, Eid N M, Kehoe M J 1995 The effect of different debonding techniques on the enamel surface: an in vitro qualitative study. American Journal of Orthodontics and Dentofacial Orthopedics 108: 284–293