HAL Id: hal-02291111
https://hal.archives-ouvertes.fr/hal-02291111
Submitted on 18 Sep 2019
HAL is a multi-disciplinary open access
archive for the deposit and dissemination of
sci-entific research documents, whether they are
pub-lished or not. The documents may come from
teaching and research institutions in France or
abroad, or from public or private research centers.
L’archive ouverte pluridisciplinaire HAL, est
destinée au dépôt et à la diffusion de documents
scientifiques de niveau recherche, publiés ou non,
émanant des établissements d’enseignement et de
recherche français ou étrangers, des laboratoires
publics ou privés.
Big data for agri-food 4.0: Application to sustainability
management for by-products supply chain
Jean-Pierre Belaud, Nancy Prioux, Claire Vialle, Caroline Sablayrolles
To cite this version:
Jean-Pierre Belaud, Nancy Prioux, Claire Vialle, Caroline Sablayrolles. Big data for agri-food 4.0:
Application to sustainability management for by-products supply chain. Computers in Industry,
Elsevier, 2019, 111, pp.41-50. �10.1016/j.compind.2019.06.006�. �hal-02291111�
OATAO is an open access repository that collects the work of Toulouse
researchers and makes it freely available over the web where possible
Any correspondence concerning this service should be sent
to the repository administrator:
tech-oatao@listes-diff.inp-toulouse.fr
This is an author’s version published in:
http://oatao.univ-toulouse.fr/24230
To cite this version:
Belaud, Jean-Pierre
and Prioux, Nancy
and Vialle, Claire
and
Sablayrolles, Caroline
Big data for agri-food 4.0: Application to sustainability
management for by-products supply chain. (2019) Computers in Industry, 111.
41-50. ISSN 0166-3615
Big
data
for
agri-food
4.0:
Application
to
sustainability
management
for
by-products
supply
chain
Jean-Pierre
Belaud
a,*
,
Nancy
Prioux
a,
Claire
Vialle
b,
Caroline
Sablayrolles
baLaboratoiredeGénieChimique,UniversitédeToulouse,CNRS,Toulouse,France bLaboratoiredeChimieAgro-industrielle,UniversitédeToulouse,INRA,Toulouse,France
ARTICLE INFO Keywords: Industry4.0 Sustainability Circulareconomy Biorefinery
Agriculturesupplychain Life-cycleassessment
ABSTRACT
Thebioconversionoflignocellulosicbiomassisapromisingmethodfortheproductionofbio-energy, biomoleculesandbiomaterials.Pretreatmentofthelignocellulosicbiomassisanessentialstepin thisprocess.Thechoiceofpretreatmentprocessisadifficultone,andtherearecurrentlynoclear criteriaonwhichtobasethischoice.Thisproject,withitssustainabilityandagri-foodperspective, usedenvironmentalimpactstoassessthevariousprocessesandtheirpanelsoftechnologies.The approachdeveloped integratesbig data,toimprove sustainabilitymanagementin supplychain design,withtheaimofvalorisingagriculturalwaste.Infivemainsteps,thisapproachcombines conceptsfromindustry4.0,sustainabilityandtheagri-foodindustry.Weapplythisapproachtoa casestudyin thedomainof agriculturalwaste valorisation:thepretreatment oflignocellulosic biomassinthericesupplychain.
1.Introductionandbackground
Sincethebeginningofthe1970s,humaninfluenceontheEarth and its resources — through the economic, scientific and technologicaldevelopmentofourindustrialsociety—hassteadily increased,resultinginanever-greaterimpactontheenvironment. Awarenessoftheseecologicalproblemshassparkednewideasfor more eco-friendly development. The Brundtland report (1987) marked the start of “sustainable development”, with the first definitionofthistermas“developmentthatmeetstheneedsofthe presentwithoutcompromisingtheabilityoffuturegenerationsto meettheirownneeds.”Sustainabledevelopmentthushasthree main objectives:economic efficiency, social fairness and envi-ronmentalsustainability.Itrequiresprofoundchangesintheway wethink,designanduseresources,andineconomicandsocial structuresfor consumptionand productionpatterns. Life-cycle thinkingcanhelptoimproveenvironmentalperformances,and socialand economic benefits can be derived from approaches
taking the full life-cycle of the agricultural supplychain into account. Indeed, this approach can be used to minimise the impactinsomeareas,whilstpreventingfurtherimpactsinother areas.Sustainabledevelopmentrequiresthestablesimultaneous consideration of economic, environmental and social aspects (Hardaker,1997). A newbusiness model for more sustainable development hasrecently emerged: thecirculareconomy (CE) (Mathews and Tan, 2011). This model helps to reconcile economic, environmental and social aspects. Ghisellini et al. (2016)havereviewedscientificarticlesonCEandhavediscussed theoriginsofCEandtheprinciplesandlimitationsofCEmodels. InFrance,thecirculareconomywasincludedinthenineareasof theSNTEDD(NationalEcologicalTransitionStrategyfor Sustain-ableDevelopment)proposedbytheFrenchgovernmentin2015 (Belaudetal.,2019).Theterm“ecologicaltransition”isusedto describetheshifttowardsmore sustainabledevelopment. This transition is a major societal concern and will require broad knowledgeandskills(Reichmanetal.,2011)frommanydifferent sciences(Palmeretal.,2005).
Thedigitaltransformationofcurrentsocietieshasledtoanew erainindustry,whichcanbedescribedas“industry4.0”,which may facilitate the ecological transition. Industry has changed considerably since its beginnings in the 18th century. Four industrial revolutions are now considered to have occurred.
*Correspondingauthor.
E-mailaddresses:jeanpierre.belaud@ensiacet.fr(J.-P.Belaud),
nancy.prioux@ensiacet.fr(N.Prioux),claire.vialle@ensiacet.fr(C.Vialle),
caroline.sablayrolles@ensiacet.fr(C.Sablayrolles).
Industrial revolution 1.0 corresponds to the introduction of machinery powered by the local generation of steam, which uncoupled production from the limitations of human manual effort.Industry2.0correspondstotheperiodafter1870inwhich “scientificmanagement”orTaylorismintroducedthedivisionof labour,assemblylinesandtheuseofelectricenergymachines.The 20thcentury,withthedevelopmentofelectronics,computingand roboticmanufacturing,usheredintheeraofindustry3.0,which focused on quality and cost performances. Automation has provided opportunities to optimise manufacturing processes and improve productivity through the design of more flexible, ergonomic and safer machinery. Industry 4.0, based on the technologicalconceptsofcyberphysicalsystems(CPS)(Babiceanu andSekr,2016),internetofthing(IoT),bigdataandaninternetof services (Kagermannet al., 2013), is an umbrellaterm for the technologies and concepts of value chain organisation, which facilitatesthedevelopmentof“smartfactories”.Oneofthecore principlesofindustry4.0isdatamanagement,fromcollectionto analysis, and the integration of information technologies, manufacturing andoperation systemsas awaytoacquire data inamoretimely,rapidandflexiblemanner(Bretteletal.,2014). This transformation from industry 3.0 to industry 4.0 is often referredtoasthe“digitalisationprocess”or“digitaltransition”.Big data and related methods and tools form one of the pillars supportingthistransformation(ChenandZhang,2014).
Bigdataareinformationassetswithahighvolume,velocityand variety(DeMauroetal.,2016),makingthemdifficulttomanage withcommontools(Hamptonetal.,2013).Bigdatatechnologies canbeappliedtotheCEandindustrialecology.Mingetal.(2015) exploredthepossiblecontributionofbigdatatoindustrialecology throughseveralexamplescombiningthesetwodomains. Knowl-edge engineering (KE) is a technique from knowledge-based systemsthatcannowbeappliedtobigdata.Life-cyclethinking wouldclearlybenefitfromthecombinationofthehugeamountsof datanowavailablewithKEtechniquesfortheirexploitation.This wouldmakeitpossibletoobtainadditionalandsurrogatedatain situationsinwhichspecificdatacannotbecollected,ratherthan having to rely on default and missing values. This approach requiresasetofhypotheses.ThemaingoalofKEistostructure knowledgeintoformalrepresentationsfor exploitationby com-puters. Thisstructuring of data is particularly important when handlinglargeamountsofdata,which pushstandardstatistical softwaretoitslimits(Snijdersetal.,2012).KEmethodsuseda standardisedvocabularytostructure theexperimental dataand their meaning. This structuring may be based on an ontology representing the experimental data of interest (Noy, 2004). Ontologiesareknowledgerepresentationmodelsthatcanbeused tolinkdataandtoprovideautomatedtoolsforreasoning(Doan etal.,2012).Oncethedatahavebeenstructuredintoontologies, theycanbehomogenisedandusedtodefineandcalculatecriteria fortheassessmentofprocesses(Liaoetal.,2015).However,onlya fewstudieshaveexploredtheapplicationofthisapproachinthis domain.Belaudetal.(2019)designsintensivedataand informa-tionsystemstomanagesustainabledevelopmentintheframeof eco-industrialarea.Cooperetal.(2013)usedbigdatatocomplete thebackgrounddata.Thebackgroundsystemconsistsofallother processesinteractingdirectlywiththeforegroundsystem. “Data-intensivelife-cycleassessment”(Bhingeetal.,2015)usesKE-based approaches to adapt life-cycle assessment (LCA) methods, incorporatingtechnological developmentsthatmaymodifyLCA resultsforagivenproductovertime.Finally,bigdataandKEcanbe usedtorepresentthelifecycleofaproductorservice(Zhangetal., 2015),withalltheintermediateflows,emissionsandextractions, inontology-basedLCA.
Europegeneratesmorethan700milliontonnesofagricultural wasteannually(Pavwelczyk,2005).Theprojectedincreaseinthe
world’s population will undoubtedly be accompanied by increasesinwasteproductionanditsimpactontheenvironment. Inaddition,human activities are decreasing the availabilityof agriculturalland,withinevitableimpactsonagriculturalsystems. New agricultural technologies should facilitate sustainable intensification,the“best”approachforthefutureofagriculture (Garnett etal., 2013).However, thisintensificationwilllead to more waste of products and resources (West et al., 2014). AccordingtoHortonetal.(2016),theparametrisationofwastein agriculture is a major challenge in attempts to achieve sustainability.Wecanidentifytwoclassesofwaste:wastefrom inputs, such as water or fertiliser, and waste due to the incompleteconversionorprocessingofmaterials inthesupply chain,fromcropproduction tofoodconsumption. Thissecond classofagricultural wasteincludes lignocellulosicby-products, correspondingtotheessentialstructuralcompoundsofthecell walls of lignified plants. Lignocellulosic biomassis one of the mostabundantandcheapestrenewable resourcesonEarth.Its bioconversionisapromisingapproachtotheproductionof bio-energy, biomolecules and biomaterials. This process involves enzymatic hydrolysis of the biomass to release glucose. The lignocellulosic biomass has four main components: cellulose, hemicellulose, lignin, and phenolic acids. Only two of these components, cellulose and hemicellulose, can be hydrolysed to generateglucose.Foroverallsustainability,theprocessesusedto generatethesebioresourcesmustbesustainable.Assessmentsof sustainability areincreasingbeingincorporatedintoprocessesinthe agro-fooddomain(FoodSCPRoundTableEuropeanCommission, 2012;Raymond,2012).Wolferdetal.exploredsmartfarmsthrough farmmanagement,farmprocesses,networkmanagement organi-sationandnetworkmanagementtechnology(Wolfertetal.,2017). Afewstudiessince2010havefocusedonclimatechangeandbigdata in thedomainof agriculture(Pivoto etal., 2018).Anintegrated theoreticalframeworkdevelopedbyHortonetal.(2016)considered theagri-foodsupply chain—fromlandtopeople—byintegratingbig data and data for all actors with any influence on agri-food businesses.Agenericagri-foodecosystemtemplatewas created, including the key actors, external influences, components and impacts.
Wefocusedonthevalorisationofagriculturalwasteand by-products,consideringthewaysinwhichbigdatacouldsupportthe managementofsustainability.Thepretreatmentoflignocellulosic biomassbeforeitsenzymatichydrolysisisessential,toensuregood yields.Variouspretreatmentmethodshavebeenstudiedindetail over the last 30 years. However, it remains difficult to choose betweenthesedifferentprocessesintermsoftheavailablebiomass andproductquality,andcriteriaarelackingtoguidethischoice.We studied the relationships between productquality and biomass pretreatment.Focusingonsustainability,wecomparedthevarious pretreatmentprocessesandthetechnologiesinvolvedintermsof theireconomicandenvironmentalimpacts.Environmentalimpact canbeassessedinvariousways.Weusedthelife-cycleassessment (LCA)method,becausethisapproachistrulysystemicandbasedon life-cycle thinking. LCA evaluates environmental aspects and potential environmental impacts throughout thelife cycleof a product or process (ISO, 2006). We initially extracted relevant information from heterogeneous sources for the analysis of pretreatments for lignocellulosic biomass valorisation.Our approach combinesconceptsfromindustry4.0,sustainabilityandthe agri-food industry.In particular, it incorporatesbig data,to improve sustainabilitymanagement insupplychaindesignfor the valor-isationofagriculturewastesandoutputsofagri-foodapplications.In thenextsection,weprovideanoverviewofourresearchapproach andtheassociateddetailedworkflow.Insection3,weapplythis approachtoacasestudy:sustainabilitymanagementforfour agri-foodprocesses,guidingdecisionsrelatingtothesupplychainand
technologiesinriceproduction.Wethendiscusstheconclusionsof thisstudyandfutureperspectives.
2.Bigdatafortheagricultureby-productsupplychain 2.1.Materialsandmethods
Big data can be used at various levels of sustainability management. One of the challenges in by-product valorisation intheagriculturalsupplychainisdesigningthe“best”process.The by-productvalorisationsupplychainincludesseveraloperational stages,frombiomasschoicetowastedisposal,anditpassesthrough varioustransformationstagesandupstream/downstreamprocesses. Eachstagecanbedefined withimpactmethodsand indicators relatingtothreeareas:economic,environmentalandsocial.Once thevariousstageshavebeendescribed,theresearchercanchoose thebiomassandthemostappropriateprocesswiththedecision supporttool,whichtakesintoaccountalltheindicatorsineach area.Themain goalofthis approachis toanalysethedifferent valorisationsystemsandprovidesupportforgroup-based decision-making.Thelink betweenthedecision supportsystem andthe variousdatamakesitpossibletotreatvarioustypesofdatawhilst maintainingahigh-throughputforbigdataprocessing.Thevarious datausedarelistedinFig.1.Publicwebdataareavailabletoanyone withawebbrowserandincludeweatherdata,worldpricesforraw materials and impact factors for LCA methods (ReCiPe for example). Corporate dataare data obtained fromcompanies at anystageoftheiractivity(fromthesettingupofthecompanyuntil itsclosure).Inthecaseofagriculturalby-productvalorisation,the “company” is a biorefinery, and each biorefinery has its own transformationprocessdata.Fielddataaredatadescribingbiomass quality(cellulosecontent) and mass, and moisturecontent,for example. Technological data relate to the technologies used in valorisationprocesses,suchascuttingandmillingtechnologies, inputs, rotation speeds and energy values, for example. LCA
databasesaredatabaseswidelyusedinLCA,suchasEcoInventand Gabi.Scientificdatabasesaredatabasesofscientificarticles.Inour example (Section 3), the articles were obtained from Web of ScienceandScienceDirect.
Wehavethreemainaxesofinterest(Fig.1).Theworkflowto supportthelinkbetweenbigdataandsustainabilityassessments for valorisation of the agricultural by-product supply chain is detailedinSection2.2.Thisapproachwasadaptedtotheagri-food industry by making use of concepts from industry 4.0 and sustainabilitymanagement.Inparticular,weretainedtheBigData pillar from Industry 4.0 and sustainability assessment from sustainability management. Fig.1 illustratesone path of digital transformationbasedontheintegrationofbigdataintothe agri-food industry. The valorisation of the agricultural by-products supplychaincanbesplitintofiveelements:lignocellulosicbiomass, transformation processes and technologies, inputs and outputs, productsandwastes,andupstreamanddownstreamprocesses.Each ofthesecategoriescanbedescribedwithheterogeneousdataand caninfluenceanothercategory.Forexample,thetypeofbiomass caninfluencethetypeoftransformationprocesses.Alldataareof importanceandinfluencethesocial,economicandenvironmental indicators.Inthesustainabilityofagriculturalby-product valor-isation,thegoalistointegrateallthedataintoprocessdesign,but thisisverydifficult.Forexample,forenvironmentalassessments complying with life-cycle thinking, process data are required. Obtaining suchdata is time-consumingand requires expensive experiments.Alternatively, datacanbeobtainedfromscientific publicationsandothersources,withtheautomaticormanualuse ofbigdata.Itis,indeed,possibletomakeuseofthesedataand, therefore, toobtain foreground data for sustainability analysis, whereas background data are generallyavailable from theLCA database.
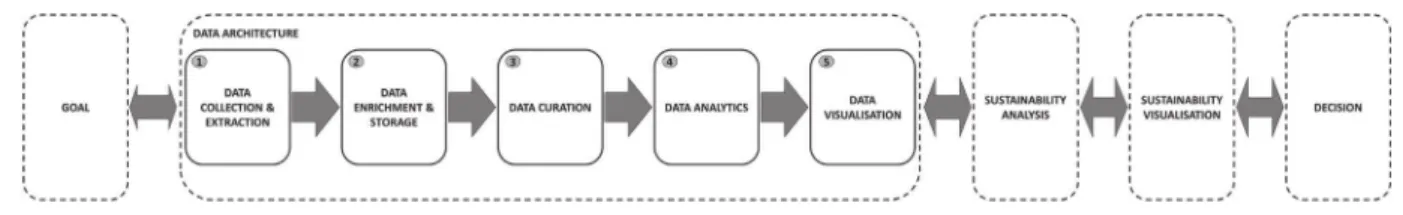
TheintegrationofsustainabilityassessmentintotheAgri-Food Industrywillfacilitatetheecologicaltransition.Ourapproachis divided into five major steps (Fig. 2): goal, data architecture,
sustainabilityanalysis,sustainabilityvisualisationanddecision.Each step hasitsown substepsand passageto andfro betweenthe variousstepsisrecommended.Thesecondstepoftheproposed methodologyconcernstheconstructionofthebigdata architec-ture: datacollectionandextraction, dataenrichmentandstorage, data curation,data analyticsand data visualisation (Levin et al., 2013).
There are five substeps in the construction of the data architecture: datacollection andextraction, dataenrichment and storage, datacuration,dataanalyticsand datavisualization.Chen etal.(2012)comparedthesesubstepstoBusinessIntelligenceand Analytics.Thedatacomefromvariousheterogeneoussourcesand canbestructuredorunstructured.Thetoolscommonlyusedfor ETL(extraction,transformationandloading)indatamanagement and warehousing are unsatisfactory in this context. Specific methodsandtoolsarethereforerequired.
Thecollectionandextractionofdatafromstructureddatabases requirespecifictools,suchasdataqueries(SQLrequests)oronline analyticalprocessing(OLAP).Thissubstepismorecomplicatedfor unstructureddatafromtheweb.Weextractthevariouswebpages containing the data of interest. The metadata associated with thesewebpagescanbeusedfortheirclassificationandtoprovide accesstotheircontent.Forexample,thedefinitionoftheMARC format in the early 1960’s normalised documentary resource metadata. Thanks to Linked Web development including RDF (Resource Description Framework, a standard from W3C) in particular, it is possibletouseSPARQLtorequesttheRDF. The extraction process generates a structured table and differs according to the format of the webpages: API, HTML or pdf. Extractionmaybeautomatic,semi-automaticormanual.Datacan be extractedautomatically fromwebpageswith anAPI format. However,theextractionoftherelevantdatafromscientificarticles requiresareadingguide,whichisgeneratedfromontologiesand pretreatmentexpertanalysis.Thistypeofextractionis,thus, semi-automatic. In the data enrichment and storage substep, the extracted data are stored in relational database management systems(DBMS).Enrichmentistheprocessofaddingdatatothe DBMS.Thesedatacomefromexpertsormodels.Themodelsare empiricnumericalsimulationsofunitoperationtype, thermody-namicsandenergyforthecontrolofflows,transformationsand transfers.
Thedatacurationsubstepinvolvesthecleaningup,addition and deletionof datafor themanagementofvolume andvalue. Following this curation,a second,more accurateand accessible database can be generated. Curation saves time in subsequent substeps and preventsincorrect interpretation during thedata analytics substep and the sustainability analysis step. The data analyticssubstepdependsonthegoal,thedatadomainsandthe decision-makers. For types of analysis are possible: descriptive analysis (what happened?), diagnostic analysis (why did it happen?),predictiveanalysis(whatwillhappen?)and prescrip-tive analysis (how can we make it happen?). Descriptive and diagnosticanalysesmake useofa numberofdifferentmethods andalgorithms,suchassummarisation,standarddeviation,linear
or non-linear dependences, factor analysis and classification methods (decisiontreeinduction, Bayesian networks,k-nearest neighbourclassifier).Someofthesemethodsarevisual,anddata visualisation may therefore be included in the data analytics substep.Datavisualizationmayalsobeachievedbyplotting the rawdataasasimpleorinteractivegraph.
2.2.Detailedworkflow
Fig. 3 shows the different steps supporting the approach describedinFig.2.Inthefirststep,goal,systemboundariesmust beclearlydefined,andlife-cyclethinking(LCT)is recommended-forthispurpose. LCTencourages a “fromcradle tograve” or “fromcradletocradle”approach.IntheCEmodel,thepartof thelifecycleinwhichtheproductisusedisakeyelementfor progresstowardsecological transition.“Fromcradletogate” approaches are oftenpreferred because the integration of downstream elements into sustainability analyses can be tedious and difficult. In particular, scientists and engineers oftenfinditimpossibletotake thebehaviourof end-usersor consumers into account in their models. System boundaries have a strong effect on the assessments subsequently per-formed.Forexample,itmustbespecifiedwhethertheupstream biomasssupplychainistakenintoaccount.Oncethegoaland scopehave been defined,the supply chain, technologies and transformation processes mustbe described. This description must be as complete as possible in terms of the process operations,thestudylocation,thevariousinputsandoutputs, andthetypeofenergyused,forexample.Thesedetailsensure thepertinenceofthedatacollected.Thelastsubstepischoosing whether to study economic, social or environmental items. Studiesmaydealwithone,twoorallthreeof theseareas.For completesustainabilitymanagement,allthreeareasshouldbe included, but social elements are often removed from the analysis duetomethodological limitationsandtime andcost concerns.
In the second step, Data Architecture, the five numbered substepsonFig.2aresimilartocommonstepsinbigdataanalysis. Thedatatobeusedmustfirstbechosen.Thisrequiresseveral questionstobeaddressed:WheredoIfindthedata?Whatkind ofdata?Whataretheuncertaintiesonthedata?WhatdatadoI alreadyhave?WhatdegreeofdataautomationdoIneed?The listofdifferentdatainFig.1isnotexhaustive,andothertypes ofdatacanbeadded,dependingonthegoaloftheproject.In thisstep,KEmethodscanbeusefulforcollectingdata.Thedata canbeextractedinvariousways(e.g.CSV,SQL,HTML,XML). Moreover,the integrationofbigdataintoagriculturalsupply chainvalorisationdoesnotalwaysinvolveautomatic process-ing. For semi-structured bases, such as scientific databases, expertsfromthedomainconcernedmustselectandverifythe dataexported.Forstructuredbases,suchasLCAdatabases,the data are automatically exported to the decision support system.Thedataenrichmentandstoragesubstepsdifferbetween studies of different complexities or with the degree of
automisation.Datacurationinvolvesthecleaningupofthedata, theadditionof expert dataand thedeletion of abnormaldata. Finally,dataanalyticsandthedatavisualisationdependonthegoal, thedataandthedecision-makers.
The third step, sustainability analysis, involves choosing the impactmethods, the indicators and thedispersion methods in accordance with each area of sustainability management. This choiceisbasedonthetwoprevioussteps.Themostimportant questionis whether themethods used are appropriate for the limitsand thedata chosen. The choice of methoddepends on
thelocationatwhichthestudytakesplace,thetypeofdataandthe limitsofthestudy.Itisimportanttocheckthatallthehypotheses of each methodaresatisfiedbefore applyingthe method.Each method belongs to a particular category and has its own limitations. The method may be based on a single criterion (carbonassessment)ormulti-criteria(LCA),qualitativeor quanti-tative,“product”-orientedor“organisation”-oriented.
Sustainabilityvisualisationisthefourthstep.Differenttypesof visualisation maybe used,depending onthe group-baseddeci-sion-making process, the goal of the study or thechoice of
analysismethod,butthisvisualisationshouldneverbeignored (Belaudetal.,2014).ThelaststepisDecision.Thisstepguides group-based decision-making for selection of the biomass, the agricultural supply chain (transformation operations and up-stream/downstreamprocesses)andtechnologies. Decisionsmay betakenmanuallyorwiththeassistanceofdecisionsupporttool, suchas ELECTRE,or PROMETHEE. Mixedgroup-based decision-makingmethods,suchasDelphi-SWOT(Tavanaetal.,2012),will beimplementedinthefuturedevelopmentofthisapproach.The approachisillustratedwithacasestudyinthenextsection:an analysisoffouragriculturalsupply chainsin theenvironmental arearelatingtoricestrawvalorisationprocessesinFrance. 3. Casestudy:valorisationofthericestrawsupplychain 3.1.Pretreatmentoflignocellulosicbiomass
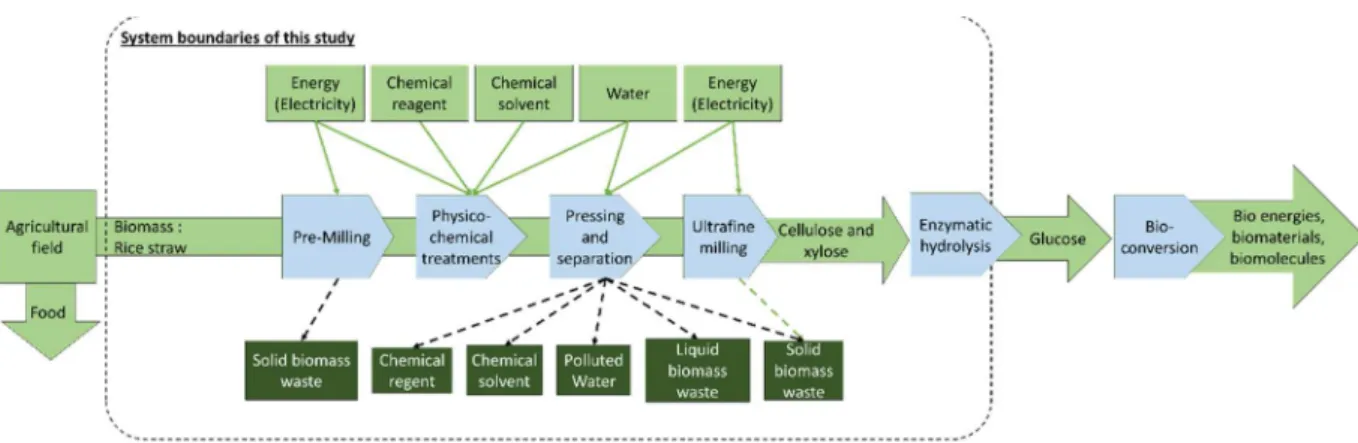
The lignocellulosic biomass has four main components: cellulose,hemicellulose,lignin,andphenolicacids.Celluloseand hemicellulosecanbehydrolysedtogenerateglucose.Ligninand phenolic acidsareresponsiblefor therecalcitranceof cellulosic materials,thecrystallinityofcelluloseandtheparticularsurface andporositycharacteristicsofmatrixpolymers.Biomass pretreat-mentisthereforeessential,todecreasecrystallinity,toincreasethe specific surface area and porosity and to extract the major constituents. Variouspretreatment methods havebeen studied in detail over the last 30 years. Each of these pretreatment methods,whethermechanical,physical,chemical, physicochemi-cal,biologicaloramixtureofvarioustypes,hasadvantagesand disadvantages. Various factors have beenused tocompare the performance, efficiency or environmental impactof these pre-treatmentprocesses:environmentalfactors,energyconsumption andenergyefficiency,forexample(Barakatetal.,2014;Chuetor et al.,2015; Zhuand Pan,2010).Biomasspretreatment process studiesuseda cradle-to-gateapproach(Jacqueminetal.,2012), extending fromthepre-millingof thebiomasstoits enzymatic hydrolysis(Fig.4).
Thegoalofthiscasestudywastousetheapproachdescribed aboveanditsassociatedworkflowtohelpresearcherstochoosea sustainableprocessforthevalorisationofricestrawpretreatment. The preliminary results obtained are presented here. The LCA method was applied to the environmental domain for the sustainabilityanalysis.Futurestudieswillfocusontheeconomic area,andwillmakeuseofthelifecyclecosting(LCC)method.This studywasacradle-to-gate.Thesystemboundariesweresetatthe pre-millingandenzymatichydrolysissteps.Thetransportofthe
biomassfromthefieldtothefirmwastakenintoaccount.Thecore hypotheseswere:(i)apre-pilot-scaleprocessisstudied(ii)rice straw is considered to be free agricultural waste with no environmentalimpact–allimpactsofthericecropareattributed tothepartusedforfood(iii)theenergyisFrenchmixedelectricity (v)thesiteofthestudyisFrance,andthefieldandthefirmarea known distance apart. The functional unit chosen was “the productionof1gofglucose”.Glucoseyieldwasrequiredforthe expressionofflowsperfunctionalunit.Fourdifferentprocessesfor treating rice straw were studied. These processes consisted of combinations of the four transformation operations shown in Fig.4:
(a)RSP1(ricestrawprocess1),withoneoperation:pre-milling. (b) RSP2, with two milling operations: pre-milling+ultrafine milling.Likethepreviousprocess,thisisamechanicalprocess. (c) RSP3, with three operations: pre-milling+physicochemical
treatment+pressingandseparation.
(d)RSP4, with the four operations in the sequence shown in Fig. 4: pre-milling+physicochemical treatment+pressing andseparation+ultrafinemilling.
The last step of the transformation process is enzymatic hydrolysis treatment, which was the same forall four systems studied.Theonlydatafromthishydrolysisusedwereglucoseyield andtheamountofbuffer,whichisdependentonbiomassquality (morebufferrequiredforlowerbiomassquality).
3.2.Results
Thegeneralworkflow(Fig.3)isillustratedforthecasestudyin AppendixA.Thefirststepoftheworkflow(goal)isspecifiedin Section3.1.
Inthedataarchitecturestep,datafromvariousbigdatasources werecollectedandextractedtocompletetheassessmentandto createdecisionsupportfortheresearcher:publicweb,fielddata, corporatedata,LCAdatabasesandscientificdatabases(Appendix A).Thescientificdatabasesincludedarticlespublishedonthefour rice straw processes. Fifteen articleswere selected bybiomass industrial engineering experts. The LCA database usedwas Ecoinvent,whichcontainsbackgrounddataandinformationabout the uncertainties on these data. The field database contained allthe flow data, for both input and output, for the operation ofthe process, together withinformationaboutthetechnologiesusedforindividualoperations. Data wereextractedfromthesedatabasesintheformofCSVfiles.These CSVfileswerethenusedforthesecondsubsteptheenrichmentand
storageof all data, correspondingto add data.The milling unit operationwasidentifiedforeacharticle,buttheenergydatawere missing,hamperingthesustainabilityanalysis(thirdstep).Internal empiricalmodelscreatedbyricestrawpretreatmentexpertswere availableandwereusedtoenrichthedata.
Thethirdsubstep,datacuration,wasperformedmanuallyby sustainabilityengineeringexperts.Twocurationswereperformed with the 15 rice straw articles. The material balance was not checked in two of the 15 articles selected due to lack of information.Allthedatafromthesetwoarticleswere,therefore,
Fig.5. Exampleofdatavisualisationfroman"averageexperiment".
Fig.8.Visualisationatmidpointmethod(2/2). Fig.7. Visualisationatmidpointmethod(1/2).
deleted.Theavailabilityofenergydataforunitoperationswasalso very patchy. We therefore decided to remove the energy data presentedinsomeofthearticles,tomakeitpossibletoupgradeall articles and avoid bias. This upgrade allowed to compare the differentindustrialpathforthenextsteps(sustainabilityanalysis, sustainabilityvisualisationanddecision).
Afterthiscuration,thefourthsubstepwasdataanalytics.The13 articles described 39 experiments. We decided to create one experimentfromeacharticletofacilitatesubsequentcalculations, analysis,visualisationanddecisionmaking.Thisexperimentwas an“average experiment”fromeach article,bycalculating mean valuesforallthedataineacharticle.Thesemeanvalueswerethen expressedperfunctionalunit,toensuredataconsistency(Fig.5 givesanexample).These13“averageexperiments”weregrouped togetherintofourtypesofprocess:RSP1,RSP2,RSP3andRSP4.The datavisualisationsubstepgeneratedtheinventorytablesusedfor thenext step.Attheend ofthedataarchitecturesteplife-cycle inventories for each process(RSP1,RSP2, RSP3 and RSP4)were generated.
The third step, sustainability analysis, uses the ReCiPe 2016 method to assess environmental impact and the Monte-Carlo methodtocalculatedispersion.TheReCiPeimpactfactordatabase (RIVM,2018)andtheMonte-Carlomethodareavailablefromthe publicweb.TheLCAdatabaseusedwasEcoinvent(EcoInventLife CycleInventoryDatabase,2017).Thepedigreematrixwasobtained fromscientificarticlesandwascompletedforbackgrounddatain Ecoinvent. WechosetousetheLCAmethodandassociated ISO standards.Thedatafortheforegroundsystem,resultingfromstep 2,andthebackgrounddata,extractedfromEcoinvent,weremixed tocalculatetheenvironmentaleffectsofeachinputandoutput. The ReCiPe method was then used to calculate 18 midpoint indicatorsandthreeendpointindicators.
The fourth step, sustainability visualisation, provided a visualisation of theseenvironmental indicators (Figs. 6–8).The different types of figure show the impact assessment at the midpointorendpointlevel.Astandardrepresentationofmidpoint indicators is available in Figs. 7 and 8 presents a common representation of endpoint indicators. These interactive visual-isations supported decision-making for the last step, decision, concerningthe“best”pretreatmentprocessforricestraw valor-isation.Theendpointmethodusesthreeindicators:humanhealth, ecosystems and resources.Results areexpressed per functional unit,makingitpossibletocomparedifferentprocesses.RSP1and RSP3hadthegreatestimpactonthethreeindicatorsconsidered. This impact can be explained by the pre-millingoperation for RSP1. The production of 1g of glucose with this pretreatment requiresbothalargeamountofbiomassandlotsofbufferforthe enzymatichydrolysis.Theuseofsuchalargeamountofbufferhas averyhighimpact.InRSP3,thepressingandseparationoperation hadthehighestimpact.Thus,twoverydifferentprocesseswere foundtohavehighendpointindicators.Withthisvisualisation,it wasnoteasytoidentifytheprocesswiththeleastenvironment impact, because the differences between RSP2 and RSP4 were minor.
Thevisualisationofmidpointindicatorscanbemorerelevant fordecision-making(Figs.7and8).RSP2appearedtohavealower impactthanRSP4forallbutthreeindicators:marine eutrophica-tion,terrestrialecotoxicityandagriculturallandoccupation.Atthis point, thedecision-makinggroup,couldeithermake adecision directlyorrefertoadditionalstudiescomparingRSP2andRSP4. However,biorefinerychainsareinnovativeandfewdatarelatingto biorefineries have been published to date. Further studies are thereforerequired.
Theteamofdatascientistsandresearchersinindustrialand sustainability engineering applied the five steps to test the
approach.Resultswereobtainedwithanewlycreatedresearch toolcouplingawell-knownLCAapplication(Simapro@)anda Microsoft Excel-VBA application. This tool supports all the stepsoftheproposedapproachexceptthedecisionstep,with decisionstaken bya decision group.Thisapproach couldbe improvedforthecasestudypresented.Eachnewarticleabout ricestrawpretreatmentwillprovideadditionalprocessdata, therebyimprovingthesustainabilityanalysis.Thermodynamic modelsarethenrequiredtocompletethedatafromscientific publications, particularly for the calculation of energy con-sumptionfortheprocessoperations.Thecasestudycouldalso bebroadenedbytheinclusionoftheeconomicareainfuture developmentsofthisresearchtool.
4. Conclusionandoutlook
Wehavedesignedanapproachintegratingindustry4.0into supplychaindesigntoimprovesustainabilitymanagementfor thevalorisationofagriculturalwaste.Thisfive-stepapproach combinesmethodsandtoolsfrombigdataandsustainability assessment.Thegoal,limitsand hypothesesofthestudy are firstspecified.Thismakesitpossibletodeterminewhichdata arerequiredforthesecond step:data architecture.Basedon big data architecture, five substeps of thedata architecture step have been defined: data extraction, storage, curation, analysisandvisualisation.Thesefivesubstepsprovideallthe data required for the next step: sustainability analysis. The sustainability visualisation step can then generate results through various dynamic and in-depth visualisation techni-ques.Finally,thedecision stepinvolveseithera group-based decision-makingprocessorasemi-automaticdecision meth-od.Three areas ofsustainability —economic, environmental andsocial—canbeassessed.Inthecasestudypresented,we appliedthisapproachtotheassessmentoffourpretreatment processesinthe agro-foodindustry.Thisapproachruledout twoprocesses as having too greatan environmentalimpact. Additional studies wouldbe required toenable thedecision group to identify the “best” of the remaining processes. Various possibilities for improving this approach and case studycouldbeexplored:(i)additionofspecificdatasources, methodsandvisualisationsfortheeconomicandsocialareas, to improve sustainability data inventories and assessment methods; (ii) progress towards the automation of data extraction for step 2. This would make it possible to save timeandtoaddnewsourcesofdatamoreeasily;(iii)fromour feedbackwiththeExcel-VBAresearchtool,development ofa complete ergonomic computing framework supporting the approach. This would encourage stakeholders to adopt this approach and would facilitate decision-making through the implementationofcollaborativedecision-makingtechniques, suchasDelphi-SWOT;(iv)thedesignofmodelsforcalculating energies; (v) the generalisation of this principle and the development of a library of business and domain-specific models from agro-food process engineering. These models could be used to check and validate the data in the data architecture step. Controls could include, for example, an advanced material balance or energy analysis; (vi) the development of data dispersion propagation and automatic qualitative explanation systems for stakeholders. These advances will help to refine the method, to render it more generalandmoreaccurate.
DeclarationofCompetingInterest None.
AppendixA.RiceStrawValorisationWorkflow
References
Babiceanu,R.F.,Sekr,R.,2016.Bigdataandvirtualizationformanufacturing cyber-physicalsystems:asurveyofthecurrentstatusandfutureoutlook.Comput. Ind.81,128–137.
Barakat,A.,Chuetor,S.,Pouau,X.,Solhy,A.,Rouau,X.,2014.Eco-friendlydry chemo-mechanicalpre-treatmentoflignocellulosicbiomass:impactonenergyand yieldoftheenzymatichydrolysis.AcsAppl.EnergyMater.113,97–105.
Belaud,J.-P.,Negny,S.,Dupros,F.,Michéa,D.,Vautrin,B.,2014.Collaborative simulationandscientificbigdataanalysis:illustrationforsustainabilityin
naturalhazardsmanagementandchemicalprocessengineering.Comput.Ind. 65,521–535.
Belaud,J.-P.,Adoue,C.,Vialle,C.,Sablayrolles,C.,2019.Acirculareconomyand industrialecologytoolboxfordevelopinganeco-industrialpark:perspectives fromFrenchpolicy.CleanTechnol.Environ.Policy21,967–985.
Bhinge,R.,Srinivasa,A.,Robinson,S.,Dornfeld,D.,2015.Data-intensivelifecycle assessment(DILCA)fordeterioratingproducts.ProcediaCIRP29,396–401.
Brettel,M.,Friederichsen,N.,Keller,M.,Rosenberg,M.,2014.Howvirtualization, decentralizationandnetworkbuildingchangethemanufacturinglandscape:an Industry4.0perspective.Int.J.Mech.Ind.Sci.Eng.8(1),37–44.
Chen,H.,Chiang,R.H.L.,Storey,V.C.,2012.Businessintelligenceandanalytics:from bigdatatobigimpact.MISQ.36(4),1165–1188.
Chen,C.,Zhang,C.-Y.,2014.Data-intensiveapplications,challenges,techniquesand technologies:asurveyonbigdata.Inf.Sci.275,314–347.
Chuetor,S.,Luque,R.,Solhy,A.,Rouan,X.,Barakat,A.,2015.Innovativecombineddry fractionationtechnologiesforricestrawvalorizationtobiofuels.GreenChem. 17,926–936.
Cooper,J.,Noon,M.,Jones,C.,Kahn,E.,Arbuckle,P.,2013.Bigdatainlifecycle assessment.J.Ind.Ecol.17(6),796–799.
DeMauro,A.,Greco,M.,Grimaldi,M.,2016.Aformaldefinitionofbigdatabasedon itsessentialfeatures.Libr.Rev.65,122–135.
Doan,A.,Halevy,A.,Ives,Z.,2012.PrinciplesofDataIntegration.MorganKaufmann Publishers.
EcoInventLifeCycleInventoryDatabase,2017.EcoInventLifeCycleInventory Database. Available:http://www.ecoinvent.org/.(Accessed24May2017).
FoodSCPRoundTableEuropeanCommission,2012.ContinuousEnvironmental Improvement-FinalReport..
Garnett,T.,Appleby,M.,Balmford,A.,Bateman,I.,Benton,T.,Bloomer,P., Burlingame,B.,Dawkins,M.,Dolan,L.,Fraser,D.,Herrero,M.,Hoffmann,I., Smith,P.,Thornton,P.,Toulmin,C.,Vermeulen,S.,Godfray,H.,2013.Sustainable intensificationinagriculture:premisesandpolicies.Science341(6141),33–34.
Ghisellini,P.,Cialani,C.,Ulgoati,S.,2016.Areviewoncirculareconomy:the expectedtransitiontoabalancedinterplayofenvironmentalandeconomic systems.J.Clean.Prod.114,11–32.
Hampton,S.,Strasser,C.,Tewksbury,J.,Gram,W.,Budden,A.,Batcheller,A.,Duke,C., Porter,J.,2013.Bigdataandthefutureofecology.Ecol.Environ.11(3),156–162.
Hardaker,J.B.,1997.GuidelinesfortheIntegrationofSustainableAgricultureand RuralDevelopment.2.TheConceptofSARD.FAO,FoodandAgriculture Organization,Rome.
Horton,P.,Koh,L.,ShiGuang,V.,2016.Anintegratedtheoreticalframeworkto enhanceresourceefficiency,sustainabilityandhumanhealthinagri-food systems.J.Clean.Prod.120,164–169.
ISO,2006.EnvironmentManagement-LifeCycleAssessment-Principlesand Framework. 14040:2006.InternationalOrganizationforStandardization, Geneva,Switzerland.
Jacquemin,L.,Pontalier,P.-Y.,Sablayrolles,C.,2012.Lifecycleassessment(LCA) appliedtotheprocessindustry:areview.Int.J.LifeCycleAssess.17,1028–1041.
Kagermann,H.,Wahlster,W.,Helbig,J.,2013.RecommendationsforImplementing theStrategicInitiativeIndustry4.0-FinalReportoftheIndustry4.0Working Group.Acatech,München.
Levin,O.,Ketner,J.,Krapohl,D.,2013.NISTBigDataPublicWorkingGroup: ReferenceArchitectureSubgroup. Available:https://bigdatawg.nist.gouv/ _uplloadfiles/NIST.SP.1500-6.pdf.(Accessed13September2018).
Liao,Y.,Lezoche,M.,Panetto,H.,Boudjilida,N.,RochaLoures,E.,2015.Semantic annotationforknowledgeexplicationinaproductlifecyclemanagement context:asurvey.Comput.Ind.71,24–34.
Mathews,J.,Tan,H.,2011.Progresstowardsacirculareconomy:thedriversand inhibitorsofeco-industrialinitiative.J.Ind.Ecol.15,435–457.
Ming,X.,Cai,H.,Liang,S.,2015.Bigdataandindustrialecology.J.Ind.Ecol.19(2), 205–210.
Noy,N.,2004.Sematicintegration:asurveyofontology-basedapproaches.SIGMOD Rec.33(4),65–70.
Palmer,M.,Bernhardt,E.,Chornesky,E.,Collins,S.,Dobson,A.,Duke,C.,Gold,B., Jacobson,R.,Kingsland,S.,Kranz,R.,Mappin,M.,Martinez,M.,Micheli,F., Morse,J.,Pace,M.,Pascual,M.,Palumbi,S.S.,Reichman,O.,Townsend,A.,Turner, M.G.,2005.Ecologicalscienceandsustainabilityforthe21stcentury.Front. Ecol.Environ.3,4–11.
Pavwelczyk,A.,2005.EUPolicyandLegislationonrecyclingoforganicwastesto agriculture.Int.Soc.Anim.Hyg.1.
Pivoto,D.,Waquil,P.D.,Talamini,E.,SpanholFinocchio,C.P.,DallaCorte,V.F.,de VargasMores,G.,2018.Scientificdevelopmentofsmartfarmingtechnologies andtheirapplicationinBrazil.Inf.Process.Agric.5,21–32.
Raymond,R.,2012.Improvingfoodsystemsforsustainabledietsinagreen economy.GreeningtheEconomywithAgriculture,2012UnitedNations ConferenceonSustainableDevelopment:GovernanceforGreeningthe EconomywithAgriculture.
Reichman,O.,Jones,M.B.,Schildhaueur,M.,2011.Challengesandopportunitiesof opendatainecology.Science11,703–705.
N.i.f.P.H.a.t.Environment,2018.N.i.f.P.H.a.t.Environment.RIVMAvailable:
https://www.rivm.nl/en/Topics/L/Life_Cycle_Assessment_LCA/Downloads/ Documenten_ReCiPe_2016/.(Accessed26September2018).
Snijders,C.,Matzat,U.,Reips,U.-D.,2012.“Bigdata”:biggapsofknowledge.Int.J. InternetSci.7(1),1–5.
Tavana,M.,Pirdashti,M.,Kennedy,D.T.,Belaud,J.-P.,Behzadian,M.,2012.Ahybrid Delphi-SWOTparadigmforoilandgaspipelinestrategicplanninginCaspian Seabasin.EnergyPolicy40,345–360.
West,P.,Gerber,J.,Engstrom,P.,Mueller,N.,Brauman,K.,Carlson,K.,Cassidy,E., Johnston,M.,2014.Leveragepointsforimprovingglobalfoodsecurityandthe environment.Science345,325–328.
Wolfert,S.,Ge,L.,Verdouw,C.,Bogaardt,M.-J.,2017.Bigdatainsmartfarming-a review.J.Agric.FoodSyst.Commun.Dev.153,69–80.
Zhang,Y.,Luo,X.,Buis,J.,Sutherland,J.,2015.LCA-orientedsemanticrepresentation fortheproductlifecycle.J.Clean.Prod.86,146–162.
Zhu,J.,Pan,X.,2010.Woodybiomasspre-treatmentforcellulosicethanol production:tehcnologyandenergyconsumptionevaluation.Bioresour. Technol.101(13),4992–5002.