HAL Id: hal-00330314
https://hal.archives-ouvertes.fr/hal-00330314
Submitted on 9 Jan 2006
HAL is a multi-disciplinary open access
archive for the deposit and dissemination of
sci-entific research documents, whether they are
pub-lished or not. The documents may come from
teaching and research institutions in France or
abroad, or from public or private research centers.
L’archive ouverte pluridisciplinaire HAL, est
destinée au dépôt et à la diffusion de documents
scientifiques de niveau recherche, publiés ou non,
émanant des établissements d’enseignement et de
recherche français ou étrangers, des laboratoires
publics ou privés.
uptake of atmospheric CO2 in the Arabian Sea
upwelling system
T. Rixen, Catherine Goyet, V. Ittekkot
To cite this version:
T. Rixen, Catherine Goyet, V. Ittekkot. Diatoms and their influence on the biologically mediated
up-take of atmospheric CO2 in the Arabian Sea upwelling system. Biogeosciences, European Geosciences
Union, 2006, 3 (1), pp.1-13. �hal-00330314�
www.biogeosciences.net/bg/3/1/ SRef-ID: 1726-4189/bg/2006-3-1 European Geosciences Union
Biogeosciences
Diatoms and their influence on the biologically mediated uptake of
atmospheric CO
2
in the Arabian Sea upwelling system
T. Rixen1, C. Goyet2, and V. Ittekkot1
1Center for Tropical Marine Ecology, Fahrenheitstr. 6, 28 359 Bremen, Germany
2Universit´e de Perpignan, Bˆat. B., EA 1947 BDSI, 52 avenue Paul ALDUY, 66 860 Perpignan, France
Received: 17 December 2004 – Published in Biogeosciences Discussions: 25 January 2005 Revised: 4 May 2005 – Accepted: 6 December 2005 – Published: 9 January 2006
Abstract. Sediment trap experiments have been carried out in order to study processes controlling shifts from diatom to non-diatom dominated systems in the western Arabian Sea. One of our major problems was to link sediment trap records to surface ocean processes. Satellite-derived observations on upper ocean parameters were helpful to reduce this prob-lem in the past and gain a new quality by combining it with results obtained during the Joint Global Ocean Flux Study (JGOFS) in the Arabian Sea. The new results imply that in-tense grazing can decline or impede the development of large diatom blooms in a silicon-enriched near shore upwelling system off Oman. In the open western Arabian Sea diatom blooms recover within the offshore advecting upwelled wa-ter and lead to peak organic fluxes into the deep sea but only during the later phase of the upwelling season. During on-set of the upwelling season grazing favoured by eolian iron inputs causing the formation of thinner diatom shells seems to prevent the development of a large diatom bloom within the silicon-enriched offshore advecting upwelled water. An increased relevance of diatoms and diatom-grazing copepods in the planktonic community as well as oligotrophic condi-tions seem to raise the ratio between organic carbon forma-tion and calcium carbonate carbon precipitaforma-tion (rain ratio) in the surface water. The decomposition of organic matter in the water column reduces the rain ratio within in the sink-ing matter especially in the oligotrophic region dominated by cyanobacteria and reduces also the variation of the carbon to nutrient uptake ratios seen in the surface water.
1 Introduction
Marine organisms influence ocean/atmospheric CO2
ex-change by photosynthesising organic matter and by precip-itating carbonate shells. The subsequent export of organic Correspondence to: T. Rixen
carbon and calcium carbonate into the deep sea and the
re-sulting net effect on the atmospheric CO2 concentration is
defined as the biological pump (Volk and Hoffert, 1985). The biological pump is driven by nutrients such as phosphate and inorganic nitrogen (N = nitrate + nitrite + ammonia), which are, in addition to carbon, required to build up organic mat-ter (Heinze et al., 1991; Maier-Reimer et al., 1996; Tyrrell, 1999; Hedges et al., 2002). The efficiency of the biolog-ical pump can be enhanced by raising the uptake ratio of carbon to nutrients (C/N/P Redfield ratio) during the pro-duction of organic matter and by a repro-duction of the calcium carbonate precipitation, because the latter process increases
the CO2 concentration in sea water (Redfield et al., 1963;
Berger and Keir, 1984; Heinze et al., 1991). Depending on the species and on environmental conditions the C/P ratio of marine organisms varies between 40 and >200 (Goldman et al., 1979; Burkhardt et al., 1999; Geider and La Roche, 2002; Klausmeier et al., 2004). Nevertheless, despite such variations, a global analysis suggests a mean Redfield ratio of 117±14/16±1/1 (Anderson and Sarmiento, 1994), which is close to the constant Redfield ratio derived by a “General Circulation Model” (GCM, 122/16/1, Maier-Reimer, 1996), and to those found by a basin-wide analysis in the Arabian Sea (125:14:1, Millero et al., 1998).
Carbonate production is often parameterised by apply-ing a fixed ratio between the organic carbon production and the precipitation of calcium carbonate carbon (rain ratio, Sarmiento et al., 2002). Data-based estimates of rain ratios are scarce and deviate between 3.3 and 12.5 (Sarmiento et al., 2002 and references therein). A new estimate even sug-gests a mean global rain ratio of 16 (Sarmiento et al., 2002). All these estimates fall within the range of global mean rain ratios (2.3 to 26.6), which can be obtained by dividing the global mean organic carbon export derived from satellite data (2 to 16 1015g C yr−1; Falkowski et al., 2000; Rixen et al., 2002) by estimates of the global mean carbonate carbon ex-port (Table 1).
Table 1. Contribution of carbonate-producing organism to the pelagic marine carbonate production. % 1015g C References
Total carbonate production 100 0.60–0.86 Milliman and Droxler (1996) Foraminifera 23–56 0.14–0.48 Schiebel (2002)
Pteropods ∼10 0.06–0.09 Schiebel (2002)* Coccolithophorids 4–38 0.02–0.33 Schiebel (2002)* * and references therein.
Possible effects of changing Redfield and rain ratios on
the atmospheric CO2 concentration were quantified using
GCMs. It was estimated that an increase of the C/P ratio
by 30% (122:1 to 158.6:1) could lower the atmospheric CO2
concentration by ∼72 ppm (Heinze et al., 1991). A doubling of the global mean rain ratio from 4 to 8 could reduce the
atmospheric CO2concentration by 28.5 ppm (Heinze et al.,
1991), and raising the rain ratio from 5 to 16.6 could,
how-ever, reduce the atmospheric CO2concentration by 70 ppm
(Archer et al., 2000). These changes explaining a major pro-portion of the glacial/interglacial variation of the atmospheric
CO2concentration were achieved by assuming that diatoms
outcompete the carbonate-producing coccolithophorids and drive the export production. Due to such a competition the rain ratio is directly linked to biogenic opal production in some models used to study the feedback impact of the
car-bonate production in the ocean on increasing CO2
concen-trations in the atmosphere (Heinze, 2004).
Since diatom growth is believed to be limited by the avail-ability of silicon at lower latitudes (Dugdale and Wilkerson, 1998; Rixen et al., 2000), changes of the global silicon cy-cle and re-organisation of the marine silicon cycy-cle were pro-posed as being possible mechanisms to fertilise lower lati-tudes with silicon during glacial times (Froelich et al., 1992; Harrison, 2000; Conley, 2002; Ridgwell et al., 2002). The re-organisation of the marine silicon cycle is suggested to be triggered by an enhanced eolian iron input lowering the Si/N uptake ratio of diatoms in the Southern Ocean and, subse-quently, enhancing the silicon export from higher to lower latitudes (Matsumoto and Sarmiento, 2002).
In addition to coccolithophorids competing with di-atoms, there are also carbonate-producing heterotrophs like foraminifera and pteropods which feed on diatoms. In the Arabian Sea sediment trap experiments showed that coc-colithophorids contribute only <15% to the carbonate ex-port into the deep sea and that the peak flux of foraminifera into the deep sea coincides with that of diatoms during the highly productive upwelling season (Haake et al., 1993b, 1993a; Zeltner, 2000). This suggests strongly that effects of foraminifera and pteropods on the rain ratio should be taken into consideration, as these organisms are important or even the main carbonate producer in the ocean (Table 1).
The total fluxes of calcium carbonate and organic car-bon measured by deep moored sediment traps in the Ara-bian Sea (Lee et al., 1998; Honjo et al., 1999; Rixen et al., 2002) and ratios between calcium carbonate dissolution and organic carbon remineralization in the water column (Hupe and Karstensen, 2000) have been used to calculate rain ratios (Rixen et al., 2005). In this study these calculated rain ratios ranging between 2 and 3.5 will be compared with rain ratios derived form total dissolved inorganic carbon concentrations (DIC), total alkalinity (TA), and CO2partial pressure
differ-ences (1pCO2)between the atmosphere and surface water
(Goyet et al., 1998b, 1999; Millero et al., 1998). Furthermore plankton counts (Garrison et al., 2000; Schiebel et al., 2004) will be evaluated in conjunction with nutrient (Morrison et al., 1998) and iron concentrations (Measures and Vink, 1999) in order to study factors influencing shifts in the planktonic community structure and associated changes of the composi-tion of sinking particles.
2 Study area
The Arabian Sea is strongly influenced by the Asian mon-soon. This climatic feature is driven by the sea-level pressure difference between the Asian landmass and the Indian Ocean (Ramage, 1971, 1987). During the boreal winter the sea level pressure over Asia exceeds that over the Indian Ocean due to a stronger cooling of the landmass. Following the pressure gradient and deflected by the Coriolis force, the wind blows from the NE (NE monsoon) over the Arabian Sea. This sit-uation reverses when the summer heating of the Asian land-mass leads to the formation of one of the strongest atmo-spheric lows on Earth. This low attracts the SE trade winds, and after crossing the equator the former SE winds blow as SW winds over the Arabian Sea due to associated changes of the Coriolis force. The SW winds (SW monsoon) form a tro-pospheric jet (Findlater Jet) extending almost parallel to the Arabian coast (Fig. 1, Findlater, 1977; Rixen et al., 1996). The monsoon winds and the deserts surrounding the western and northern parts of the Arabian Sea lead to dust inputs into the Arabian Sea, which are among the highest in the world ocean (Tegen and Fung, 1994, 1995).
Wind speed [m s-1] 0 1 2 3 4 5 6 7 8 9 10 11 12 13 14 55˚ 60˚ 65˚ 70˚ 10˚ 10˚ 15˚ 15˚ 20˚ 20˚ 25˚ 25˚
Title: Diatoms and their effect ... Rixen et al. Figure 1
Fig. 1. Mean SW monsoon wind speeds over the Arabian Sea dur-ing the SW monsoon. Data are obtained from Rixen et al. (1996). Red squares indicate the U.S. JGOFS (Honjo et al., 1999) and the red circles the long-term Indo/German sediment trap sites in the western and central Arabian Sea (Rixen et al., 2002). The white cir-cle indicate the central Arabian Sea surface mooring location (ONR, Dickey et al., 1998), and the black circles show the U.S. JOGFS wa-ter sampling sites (Morrison et al., 1998).
Biological productivity within the Arabian Sea is deter-mined by the interplay between the euphotic zone and mixed layer depth (MLD), whose deepening is caused by winter cooling and wind mixing (Rixen et al., 2002). The inter-play between the euphotic zone and the MLD regulating the availability of light and nutrients is well known from the tem-perate ocean. In the Arabian Sea this leads to early and late NE monsoon blooms. During the SW monsoon the Findlater Jet creates one of the most productive upwelling areas in the ocean (Antoine et al., 1996) and a hot spot for CO2emission
along the Arabian coast (K¨ortzinger et al., 1997; Goyet et al., 1998b, 1998a; Sabine et al., 2000). Diatom blooms are common during the later phases of the NE and SW monsoon (Haake et al., 1993b; Rixen et al., 2000).
3 Data base, methods and results
Nutrients, DIC, TA, temperature, and salinity profiles mea-sured at the sampling sites S1–S15 during the U.S. JGOFS cruises ttn49 (18 July 1995–13 August 1995) and ttn50 (14 August 1995–13 September 1995) were obtained from the U.S. JGOFS database (Figs. 1, 2). The mixed layer depth was defined as the depth at which a pronounced temperature decrease and nutrient increase occurred within profiles. Sub-sequently all data were averaged for the mixed layer depth
Sea surface temperature [oC]
19 20 21 22 23 24 25 26 27 28 29 30 31 32 50˚ 60˚ 70˚ 5˚ 5˚ 10˚ 10˚ 15˚ 15˚ 20˚ 20˚ 25˚ 25˚ 20 21 22 23 24 25 26 27 28 29 0 300 600 900 1200 20 21 22 23 24 25 26 27 28 29 35.6 35.8 36.0 36.2 36.4 36.6 36.8 35.6 35.8 36.0 36.2 36.4 36.6 36.8 S15 S14 S13 S12 S11 S10 S9 S7 S8 S6 S5 S4 S3 S2 S1 S1 Surface temperature [ oC] Surface salinity
Distance to the coast [km]
Title: Diatoms and their effect ... Rixen et al. Figure 2
Fig. 2. Upper panel: Mean satellite-derived sea surface temper-atures during the cruise ttn49. Data are obtained from Physical Oceanography Distributed Active Archive Center at Jet Propulsion Laboratory, California Institute of Technology). Lower panel: Sur-face temperatures and salinity averaged for the depth of the mixed layer (data are from the U.S. JGOFS database: http:/usjgofs.whoi. edu/jg/dir/jgofs/arabian/) at each sampling site (S1 to S15).
(Table 2). The resulting mean mixed layer temperatures and salinities increase generally from the coastal upwelling zone towards the open ocean (Fig. 2). During both cruises slightly reduced temperatures and salinities occurred between sta-tions S5 and S7, approximately 500 km offshore. As shown by satellite-derived SSTs charts (Fig. 2), this anomaly was associated with the filament that extended almost parallel to the transect, perpendicular to the coast towards the open Arabian Sea. Filaments are cold water structures caused by an accelerated advection of upwelled water. While mov-ing offshore the upwelled water get mixed with the warmer and saltier surface water that was formed during the preced-ing oligotrophic intermonsoon season (Fischer et al., 2002; Weller et al., 2002). Mixing of two water masses is indicated by a linear correlation between temperature (T) and salin-ity (S) if latent and sensible heat fluxes between ocean and atmospheres are negligible. Temperature und salinity (T/S) data derived from the sampling sites along the Oman tran-sect are not correlated (Fig. 3) and T/S data obtained from
20 22 24 26 28 35.5 36.0 36.5 37.0 Salinity Temperature [ oC]
Title: Diatoms and their effect ... Rixen et al. Figure 3
Fig. 3. Salinity versus temperature. Salinities and temperatures were measured during cruise ttn49 (open circles) and ttn50 (black circles) and averaged for the depth of the mixed layer (data are from the U.S. JGOFS database). The black line connects the data col-lected at the sites S1 and S2.
the sites S2–S14 deviate from the line (mixing line) that connects T/S data obtained from the sampling site S1 and S15. In order to calculate energy fluxes required to explain these deviations from the mixing line (1SST) the time dur-ing which the surface water was in contact with the atmo-sphere must be known. The ages of the surface water can be calculated at each sampling site by dividing the distance to the coast by the mean advection velocity and considering that the upwelled water was already a few days old prior to it left the coast. Since the lower temperatures and the re-duced salinity indicate an accelerated advection of upwelled water within the filament an age correction has been applied. The distance from the coast towards the most offshore station (S13) and the station closest to the coast (S1) is ∼1100 km and ∼26 km, respectively. At these two stations the salinity was 36.6 and 35.7 (Table 2). Based on these two points de-fined by the distance to the coast and the salinity a linear re-gression was developed which allowed us to derive corrected distances from the salinity measured at each sampling site (distance [km]=1135.1×Salinity−40451.8). The time since the water mass was in contact with the atmosphere was ob-tained by dividing the corrected distance by the mean
ad-vection velocity ranging between 0.2 and 0.8 m s−1 (Rixen
et al., 2000). Additionally it was assumed that coastally up-welled water was already 4 days old prior to it left the coast. The energy fluxes required to explain 1SST have been calcu-lated as follows: (ρ×MLD×Cp×1SST )/(age of the water), whereas “ρ” is the sea water density in “kg m−3”, MLD is the
0.0 0.6 1.2 1.8 0 300 600 900 1200 Phosphate [10 -6mol kg -1]
Distance to the coast [km] a) 0.0 0.1 0.2 0.3 0.4 0.5 0.0 0.6 1.2 1.8 0.0 0.2 0.4 0.6 0.8 1.0 0 Phosphate [10 -6mol kg -1] Consumption [10 -6mol kg -1] b)
Proportion of oligotrophic water
Rixen et al. Figure 4 Title: Diatoms and their effect ..
Fig. 4. (a) Phosphate concentration measured during cruise ttn49 and averaged for the depth of the mixed layer versus the distance to the coast (data are from the U.S. JGOFS database). (b) Mean phosphate concentration (black circles) and the mixing line (black line) versus the proportion of oligotrophic water. Bars reveal the difference between the measured phosphate concentration and the phosphate concentration indicated by the mixing line. This differ-ence is regarded as biological consumption.
mixed layer depth in “m”, “cp” is the specific heat of the wa-ter (∼3980 J kg−1K−1), 1SST and the age of the water are given in “◦C” and seconds, respectively. The calculated data
show that a heat flux of 90 to 584 W m−2could have caused
the 1SST at sampling site S7 (Table 3). Energy fluxes of 150
to 200 W m−2determined at the U.S. JGOFS surface
moor-ing site which is close to S7 (Weller et al., 1998) fall within this range implying that heat fluxes could have caused 1SST at station S7 and most probably also at the other water sam-pling sites for which no data on heat fluxes are available.
Latent heat fluxes do not affect the relationship be-tween salinity and nutrient concentrations as changes in the amount of water in the mixed layer increase both
the salinity and the nutrient concentration. Since in
ad-dition to that salinity and nutrient concentration are un-affected by sensible heat flux, salinity instead of tem-perature was used to define the end-members and to calculate the mixing ratios “a” and “b” within the two-end-member mixing analysis at sampling sites S1– S13 (SalinityS1−S13=aS1−S13×Salinityupwelled water+bS1−S13
Salinityoligotrophic water, whereas aS1−S13+bS1−S13=1).
Sta-tion S1 was defined as the upwelling and staSta-tion S13 as the oligotrophic end-member because there are hardly any discernible variations in the salinity between stations S13,
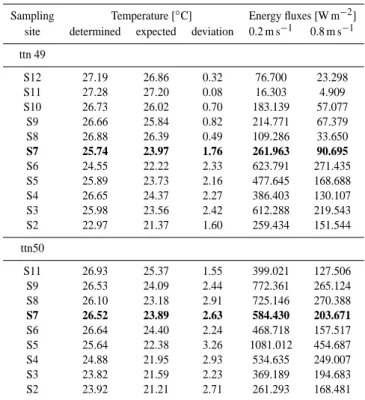
Table 2. Station number, position, distance between the station and the coast, mixed layer depth, mean mixed layer temperature, salinity, phosphate, total inorganic nitrogen , silicon and total inorganic carbon concentration, mean total alkalinity and partial pressure difference between the atmosphere and the ocean. Missing data are indicated by −99.00. The position was obtained by averaging the position of all available hydrographic casts at one sampling sites.
St. Lon. Lat. Distance MLD Temp. Sal. PO4 TN Si DIC TA 1pCO2
[◦E] [◦N] [km] [m] [C] [psu] ——–[µmol/kg]——– µeq./kg µatm Cruise ttn49 S1 57.32 18.52 25.73 10.00 20.84 35.66 1.55 17.40 9.23 2146.50 2338.60 −299.09 S2 58.03 18.16 93.01 18.00 22.98 35.71 1.32 15.40 7.64 2111.43 2329.18 −222.65 S3 58.86 17.67 193.58 53.00 25.99 36.00 0.69 5.58 3.13 2046.65 2349.28 −99.37 S4 59.87 17.17 313.98 42.00 26.65 36.10 0.53 4.12 2.73 2044.78 2348.66 −83.25 S5 60.51 16.79 392.79 48.00 25.90 36.02 0.60 4.81 2.51 2042.92 2348.80 −89.41 S6 61.25 16.43 482.12 40.00 24.55 35.82 1.13 12.16 5.59 2091.47 2340.20 −159.56 S7 62.00 16.03 573.55 34.00 25.74 36.05 0.79 7.25 3.55 2056.73 2350.63 −116.40 S8 62.81 15.64 669.95 75.00 26.89 36.37 −99.00 1.52 1.80 2030.58 2369.00 −57.44 S9 63.51 15.23 757.38 82.00 26.66 36.29 0.44 2.01 1.25 2035.04 2362.73 −54.62 S10 64.25 14.82 849.37 83.00 26.73 36.32 0.39 0.96 1.16 2028.16 2366.69 −39.80 S11 65.00 14.44 940.11 75.00 27.28 36.47 0.32 0.51 0.99 2024.41 2375.23 −27.76 S12 65.00 13.24 1010.75 84.00 27.19 36.43 0.27 0.04 0.54 2020.13 2373.47 −27.38 S13 65.01 12.05 1092.72 108.00 27.71 36.60 0.24 0.17 0.69 2018.74 2382.50 −19.72 S14 65.00 10.81 1186.65 104.00 27.72 36.57 0.27 0.29 1.10 2020.96 2381.27 −23.93 S15 64.91 9.97 1247.93 95.00 27.88 36.58 0.25 0.40 1.19 2017.80 2381.40 −27.45 Cruise ttn50 S1 57.30 18.50 23.26 14.00 20.95 35.66 1.66 19.42 11.18 −99.00 −99.00 −99.00 S2 58.04 18.09 96.34 10.00 23.93 35.69 1.32 15.09 5.71 −99.00 −99.00 −99.00 S3 58.85 17.67 192.68 20.00 23.82 35.74 1.07 11.50 1.99 −99.00 −99.00 −99.00 S4 59.77 17.18 303.75 25.00 24.89 35.79 0.96 9.62 1.51 −99.00 −99.00 −99.00 S5 60.50 16.80 392.48 52.00 25.64 35.84 0.85 8.38 1.12 −99.00 −99.00 −99.00 S6 61.25 16.43 481.32 52.00 26.65 36.11 0.53 3.15 0.97 −99.00 −99.00 −99.00 S7 61.98 16.01 573.00 50.00 26.52 36.04 0.59 3.84 1.49 −99.00 −99.00 −99.00 S8 62.77 15.64 666.57 48.00 26.10 35.95 0.76 6.52 1.70 −99.00 −99.00 −99.00 S9 63.50 15.25 756.05 74.00 26.54 36.07 0.57 3.84 2.42 −99.00 −99.00 −99.00 S11 65.00 14.44 940.20 75.00 26.93 36.23 0.41 1.22 0.73 −99.00 −99.00 −99.00 S13 65.00 12.05 1091.55 102.00 27.42 36.51 0.34 0.31 0.59 −99.00 −99.00 −99.00 S14 65.00 10.80 1186.62 100.00 27.64 36.51 0.32 0.09 0.42 −99.00 −99.00 −99.00 S15 64.90 9.97 1247.66 84.00 27.85 36.57 0.30 0.13 0.27 −99.00 −99.00 −99.00
14 and 15 (Table 2). A mixing ratio “b” of zero indicates pure upwelled water whereas a mixing ratio “b” of one im-plies that no upwelled water is present. The mixing ratios “a” and “b” determined for each station and the mean nu-trient concentration calculated at the station S1 and S13 (see Table 2) were subsequently used to calculate a mixing line (PhosphateS1−S13mixing=aS1−S13×PhosphateS1+bS1−S13
PhosphateS13; Fig. 4b). The mixing line represents the
con-centration that could be expected if mixing were the only factor controlling the nutrient concentration. Deviations of measured phosphate, inorganic nitrogen, and silicon concen-trations from the mixing line can be attributed to biological consumption. In order to determine error ranges of the de-rived biological consumption caused by analytical methods, a relative percentage error of 0.5% and 0.012% of nutrient
and salinity data (U.S. JGOFS data base documentation) was considered. Within these error ranges random errors were produced by applying the standard fortran 77 random num-ber generator (F77-RNG). Subsequently, the mixing analysis was performed 500 times by using the produced errors. The mean ratios of inorganic nitrogen and phosphate consump-tions (N/P ratios) vary between ∼7 and 24 (Fig. 5b) and fall within the range of N/P ratios determined in marine particu-late matter and phytoplankton (∼3–34, Geider and La Roche, 2002; Klausmeier et al., 2004). The resulting standard devi-ations of the N/P ratios range between 0.1 and 0.4.
The DIC and TA data were treated in the same way as nutrient data, but prior to calculating the biological
con-sumption the DIC concentrations were corrected for CO2
Table 3. Sampling site, the mean mixed layer temperature (deter-mined), the temperature as suggested by the mixing line indicate in Fig. 4 (expected), the difference between the mixed layer tem-perature and the expected temtem-perature (1SST), and energy fluxes required to explain the temperature deviation. The energy flux has been calculated by assuming a mean advection velocity of 0.8 and 0.2 m s−1.
Sampling Temperature [◦C] Energy fluxes [W m−2]
site determined expected deviation 0.2 m s−1 0.8 m s−1
ttn 49 S12 27.19 26.86 0.32 76.700 23.298 S11 27.28 27.20 0.08 16.303 4.909 S10 26.73 26.02 0.70 183.139 57.077 S9 26.66 25.84 0.82 214.771 67.379 S8 26.88 26.39 0.49 109.286 33.650 S7 25.74 23.97 1.76 261.963 90.695 S6 24.55 22.22 2.33 623.791 271.435 S5 25.89 23.73 2.16 477.645 168.688 S4 26.65 24.37 2.27 386.403 130.107 S3 25.98 23.56 2.42 612.288 219.543 S2 22.97 21.37 1.60 259.434 151.544 ttn50 S11 26.93 25.37 1.55 399.021 127.506 S9 26.53 24.09 2.44 772.361 265.124 S8 26.10 23.18 2.91 725.146 270.388 S7 26.52 23.89 2.63 584.430 203.671 S6 26.64 24.40 2.24 468.718 157.517 S5 25.64 22.38 3.26 1081.012 454.687 S4 24.88 21.95 2.93 534.635 249.007 S3 23.82 21.59 2.23 369.189 194.683 S2 23.92 21.21 2.71 261.293 168.481
been derived from the 1pCO2data published for each
wa-ter sampling site in the U.S. JGOFS database (Table 2). The required wind-dependent gas transfer velocity “k” was calculated using eight different formulations (Liss and Mer-livat, 1986; Wanninkhof, 1992; Wanninkhof and McGillis, 1999; Nightingale et al., 2000; Feely et al., 2001). Satellite-derived wind speeds (see Fig. 1) were taken from Rixen et al. (1996). The standard deviation and the resulting mean
CO2 emission at each sampling site along the transect are
given in Fig. 6. In order to estimate the amount of CO2that
escaped from the surface water, the CO2emissions have been
multiplied by the age of the water which has been was calcu-lated by using a mean advection velocity of 0.6 m s−1. The
resulting mean CO2loss was subtracted from the amount of
DIC held in the mixed layer. A further correction for the
pen-etration of anthropogenic CO2was neglected because of the
short time scale covered by the cruises. The CO2-corrected
DIC and the TA consumption (DICconsumption, TAcons.)have
been used for differentiating between the net organic carbon production (POCproduction)and the precipitation of calcium
50 100 150 200 C/P Ratio a) 10 20 30 N/P Ratio b) 0 5 10 15 0.0 0.2 0.4 0.6 0.8 1.0 22.3 POC/PIC Ratio c)
Proportion of oligotrophic water
Title: Diatoms and their effect ... Rixen et al. Figure 5
Fig. 5. (a) C/P, (b) N/P and (c) rain (POC/PIC) ratios versus the proportion of oligotrophic water. Error bars are calculated as de-scribed in the text. The number in panel (c) indicates the rain ratio at the sampling site S11 which is not plotted as it is out of scale.
carbonate (PICprecipitation), according to the equations:
DICconsumption=POCproduction+PICprecipitation (1)
PICprecipitation=(TAcons.+POCproduction×0.15)/2 (2)
The factor 0.15 accounts for the increase of TA during the production of organic matter, and the factor 2 due to the fact that for each mole of carbonate precipitated from the sea water TA decreases by two units (Broecker and Peng,
1982; Zeebe and Wolf-Gladrow, 2001). With two
equa-tions and two unknowns the production of organic carbon (POCproduction)can be determined as follows:
POCproduction=(DICcorrected−TAcons./2)/1.08 (3)
Error ranges were determined by producing “analytical” er-rors artificially by applying the F77-RNG within the range of the standard deviation given for the determination of
DIC concentrations (±1.2 10−6mol kg−1) and TA (±3.2
10−6eq. kg−1 Millero et al., 1998; U.S. JGOFS data base
documentation). Subsequently the errors were used to re-calculate the POC and PIC production 500 times for each of the different gas transfer velocity coefficients cited above. The resulting mean C/P and rain ratios and their standard de-viations are given in Fig. 5a. The mean C/P uptake ratios vary between 80 and 150 and are well within the range of published C/P ratios observed in marine particulate matter and phytoplankton. The same holds true for the rain ratios which vary between ∼2.3 and ∼8.1 except at station S11
0 10 20 30 40 50 60 70 0 300 600 900 1200 CO 2 flux [mmol m -2 day -1] Distance [km]
Title: Diatoms and their effect ... Rixen et al. Figure 6
Fig. 6. Mean CO2emission derived from 1pCO2 data obtained
from the U.S. JGOFS data, satellite-derived wind speeds and the different gas transfer velocity coefficients “k” versus the distance to the coast. Error bars indicate the standard variation of results derived from the different wind speed data sets and the different methods to calculate “k”.
where the rain ratio is 22.3 (Fig. 5c). However, due to the low carbon consumption the standard deviation at the sam-pling sites S10–S12 (proportion of oligotrophic water >0.7) are so high that these data have to be treated with caution within the following discussion.
In order to calculate the new production rates (Dug-dale and Goering, 1967; Eppley and Peterson, 1979) the POCproduction (see Eq. 3) was integrated over the depth of
the mixed layer and subsequently divided by the age of the upwelled water. The comparison with primary and export production rates measured at the same time and at the same stations (Buesseler et al., 1998) show that the resulting new carbon production rates are lower than the primary produc-tion rates, as expected (Fig. 7). Since new producproduc-tion ex-ceeds export production rates it is assumed that the biomass is growing in the mixed layer but under different environ-mental conditions.
New production rates which are consistent with published data on primary and export production rates and reliable rain and Redfield ratios suggest that our approach is suitable for studying biogeochemical processes in the Arabian Sea dur-ing the upwelldur-ing season. In the followdur-ing discussion the re-sults obtained by our mixing analysis will, furthermore, be linked to plankton counts and sediment trap data in order to investigate factors influencing changes in the planktonic community structure and associated impacts on the rain ra-tio. 0 20 40 60 80 100 120 140 160 180 200 220 0.0 0.2 0.4 0.6 0.8 1.0 [mmol C m -2 day -1]
Proportion of oligotrophic water
Title: Diatoms and their effect ... Rixen et al. Figure 7
Fig. 7. Primary production rates (stars), export production rates de-rived from234Th measurements (open diamonds; Buesseler et al., 1998), and sediment trap data (grey diamonds; Rixen et al., 2003). Organic carbon (new) production calculated from the DIC and TA uptake is indicated by black circles.
4 Discussion
4.1 Diatom blooms
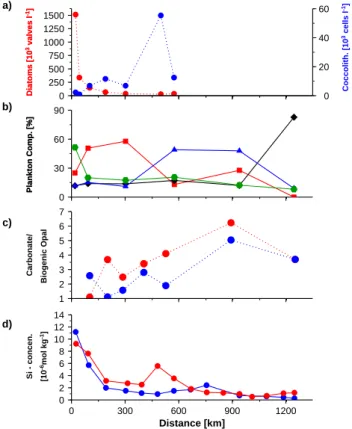
The shoaling of the mixed layer and enhanced organic car-bon flux measured in the deep sea reveal that the cruise ttn49 and the cruise German JGOFS cruise M32/5 took place at the beginning of the upwelling season in the open western Arabian Sea (Fig. 8). On month later during the cruise ttn50 the high organic carbon fluxes indicate the peak upwelling season. At this time plankton counts (Garrison et al., 2000) show that diatoms dominate the planktonic community from approximately 100 to 400 km offshore (Fig. 9b). Flagellates succeed diatoms in the central Arabian Sea after silicon con-centrations in the surface water reach their oligotrophic
in-termonsoon value of ∼2 µmol kg−1, (compare Figs. 9b and
d). Plankton growth rates generally decrease with decreasing nutrient concentrations after the latter falls below a certain threshold (Lalli and Parsons, 1993). Assuming that such a threshold is close to a silicon concentration of ∼2 µmol kg−1 diatom growth rates falling below the high grazing rates (Smith et al., 1998) could explain the declining diatom bloom in the open western Arabian Sea where silicon in the surface water is not consumed. This observation confirms
experi-mental data suggesting a silicon-threshold of ∼2 µmol kg−1
for the dominance of diatoms within the planktonic commu-nity (Egge and Aksnes, 1992). Near the coast, at silicon
concentration of ∼11 µmol kg−1 the relatively low
contri-bution of diatoms to the planktonic community (Fig. 9b, d) has been attributed to intense grazing by copepods slowing down the development of diatom blooms in the coastal re-gion off Oman (Smith, 2001). During the early phase of the upwelling season the abundance of diatoms decreased dras-tically close to the Oman coast as shown by plankton counts
0 5 10 15 20 25 30 2 3 4 5 6
May Jun Jul Aug Sep
1995 POC Flux [mg m -2day -1] Carbonate/Biogenic Opal -120 -80 -40 0 Water Depth [m] ttn49 ttn50 M32/5 M32/5 MLD Eupthotic zone
Title: Diatoms and their effect ... Rixen et al. Figure 8
Fig. 8. Depth of the mixed layer (MLD black line) and of the eu-photic zone (1% light level; green line) determined at the ONR mooring site. Data was redrawn from (Dickey et al., 1998). The MLD represents the water-depth at which the temperature is 1◦C lower than at the surface. The organic carbon fluxes (black line) and carbonate/biogenic opal ratios (red line) measured in the west-ern Arabian Sea at the long-term Indo/German sediment trap site (WAST) at 3000 m water-depth. The horizontal black lines show the time during which the cruises M32/5 have been carried out and the cruises ttn49 and 50 have been performed along the transect off Oman in the western Arabian Sea. The other horizontal lined indi-cate the time at which the measured surface data could be reflected in the deep ocean. A delay of 14 days has been added to original dates.
(Fig. 9a, Schiebel et al., 2004). This decline is accompanied with a transition from a Chaetoceros dominated diatom as-semblage near the coast to one dominated by Nitzchia bicap-itata further offshore. The decline and the associated tran-sition of the diatom assemblage has been linked to decreas-ing nutrient concentrations and intense grazdecreas-ing (Smith, 2001; Schiebel et al., 2004).
The results obtained by the plankton counts agree with those derived from deep moored sediment traps and our mixing analysis showing silicon consumption and carbonate biogenic opal ratios which are lower and higher, respectively, during the early than during the later phase of the upwelling season in the open western Arabian Sea (Figs. 9c, 10a). Vice versa, near the coast carbonate biogenic opal ratios reveal a higher contribution of diatoms to the exported matter during the early than during the later phase of the upwelling season (Fig. 9c). This seems to be caused by the export of the de-clining diatom bloom during the early phase of the upwelling season (Fig. 9a) and the delayed development of the diatom bloom one month later (Fig. 9b).
0 250 500 750 1000 1250 1500 0 20 40 60 Diatoms [10 3 valves l -1] Diatoms [10 3 valves l -1] Coccolith. [10 3 cells l -1] a) 0 30 60 90
Plankton Comp. [%] Plankton Comp. [%]
b) 1 2 3 4 5 6 7 Carbonate/ Biogenic Opal c) 0 2 4 6 8 10 12 14 0 300 600 900 1200 Si - concen. [10 -6mol kg -1] d) Distance [km]
Title: Diatoms and their effect ... Rixen et al. Figure 9
Fig. 9. (a) Number of diatom valves and coccolithophorid cells (Schiebel et al., 2004) (b) contribution of nanoplankton (green), diatoms (red), flagellates (blue) and cyanobacteria (black) to the biomass of photoautotrophic plankton (Garrison et al., 2000), (c) Carbonate biogenic opal ratios (blue – peak upwelling season; red – onset of the upwelling season) derived from deepest sediment traps deployed at the U.S., JGOFS and Indo/German sediment trap site (see Figs. 1 and 2) (d) silicon concentrations (blue – ttn50, red – ttn49) versus the distance to the coast. The sediment traps have been deployed at water-depth ranging approximately between 2500 and 3500 m except near the coast the sediment trap was deployed at a water-depth of ∼1000 m.
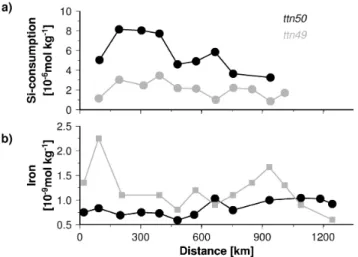
4.2 The role of iron for the development of diatom blooms
Iron enrichment experiments in the coastal upwelling sys-tem off California revealed that iron fertilization favours the growths rates of Chaetoceros and other diatoms but leads to the formation of thinner shells as indicated by a low up-take of silicon relative to nitrogen (Hutchins and Bruland, 1998). The iron concentration in the diatom dominated open
western Arabian Sea range between 0.5 and 1 nmol l−1
dur-ing the cruise ttn50 and reach values of >2 nmol l−1during the cruise ttn49 near the coast (Fig. 10b). Off California an increase in the iron concentration from 0.5 to 2.5 halves Si/N uptake ratio (Hutchins and Bruland, 1998). Assuming a similar impact of iron on the Si/N uptake off Oman sug-gests that Chaetoceros blooming during the onset of the up-welling season near the coast off Oman might built thinner
Fig. 10. (a) Silicon consumption, (b) iron concentration versus the distance to the coast during the cruises ttn49 and 50.
shells than diatoms growing a month later in same region but in water revealing lower iron concentrations. The extremely strong diatom shell is an important protection against preda-tors (Hamm et al., 2003). Since enhanced iron concentrations lead to the formation of thinner shells it is suggested that copepode grazing is favoured in iron-enriched environments. An iron-favoured grazing could explain the decline of the near shore diatom bloom during the onset of the upwelling season (Fig. 9a). On the other hand a less efficient grazing due to lower iron concentrations (Fig. 10b) and thicker shells could slow down but do not prevent the development of a large diatom bloom during the later phase of the upwelling season (Fig. 9b) at which the silicon concentrations are al-most equal to those during early phase of the upwelling sea-son (Fig. 10d).
4.3 Rain ratios
Apart from one exception as discussed before the rain ratios derived from mixing analysis range between ∼2.3 and 8.1 and are generally higher than those obtained from sediment trap data (2–3.5, Fig. 11). The rain ratios derived from the sediment trap data have been adjusted to a water-depth of 100 m whereas the mixed layer depth is <100 m in the west-ern Arabian Sea (Table 1). POC/PIC ratios tend to decrease within increasing water depth because the decomposition of organic matter is faster than the dissolution of carbonates in the upper water column. Consequently, the difference be-tween rain ratios derived from sediment trap data and the mixing analysis could be caused by differences in the water-depth. Moreover, one should consider that sediment trap data represent a larger area and a longer time interval than data de-rived form nutrient profiles obtained at a specific site within a relatively short period of time.
However, rain ratios obtained from sediment trap data and the mixing analysis reveal a similar trend in the upwelling
2 4 6 8 10 Rain ratio a) 2 3 4 0.0 0.2 0.4 0.6 0.8 1.0 2 3 4 0.0 0.2 0.4 0.6 0.8 1.0 8.4 8.6 8.8 9.0 9.2 0.0 0.2 0.4 0.6 0.8 1.0 2 3 4 0.0 0.2 0.4 0.6 0.8 1.0 MS1&2
MS1&2 MS4 MS3 WAST CAST MS5 upwelling area oligotrophic area
22
Rain ratio (trap data) C/N ratio (trap data) b)
Proportion of oligotrophic water
Rixen et al. Figure 11 Title: Diatoms and their effect ..
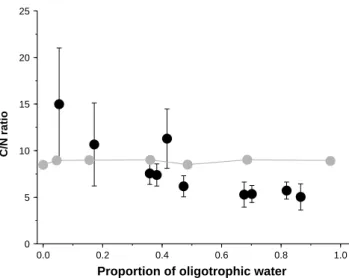
Fig. 11. (a) Rain ratios and silicon consumption derived from the mixing analysis versus the proportion of oligotrophic water (same data as shown in Figs. 5 and 10a). (b) Rain (black circles) and C/N ratios (open circles) derived from sediment traps versus the pro-portion of oligotrophic water data. The rain ratios are mean SW monsoon values and have been derived from trap data (Rixen et al., 2005). The C/N ratios obtained from deepest trap deployed at each mooring site have been averaged for the period of the cruise ttn4. The proportion of oligotrophic water was determined by ad-joining to them the closest water-sampling site during the cruise ttn49. Since lateral advection has to be considered additionally, not the closest station was used but its neighbour station to the west (coast). The grey circles indicate long-term mean rain and C/N ra-tio obtained from the Indo/German sediment trap site in the central Arabian Sea (CAST), but it does not include data from the SW mon-soon 1995, due to an instrumental error.
region characterized by a proportion of oligotrophic water
(pow) <0.6 (Fig. 11). Near the upwelling centres (pow
<0.35) the rain ratios increase with an increasing proportion of oligotrophic water until they reach a maximum at a pow of ∼0.35. This increase is accompanied with an enhanced silicon consumption (Fig. 10a) indicating a slight recovery of the diatom (Nitzchia bicapitata) bloom after the dramatic de-cline of Chaetoceros dominated diatom bloom near the coast during the early upwelling season (Fig. 9a). At the tran-sition between the upwelling dominated area and the more oligotrophic sites the rain ratios decrease by ∼30 (sediment trap data) and 45% (mixing analysis). This decline is accom-panied with decreasing silicon consumption (Fig. 10a) and during the later phase of the upwelling season also with de-creasing contribution of diatoms to the plantonic community structure (Fig. 9b).
The high abundance of coccolithophorids at approxi-mately 450 km offshore (Fig. 9a) occurred in a water mass
0 5 10 15 20 25 0.0 0.2 0.4 0.6 0.8 1.0 C/N ratio
Proportion of oligotrophic water
Title: Diatoms and their effect ... Rixen et al. Figure 12
Fig. 12. C/N ratios derived from the mixing analysis (black circles) and sediments traps (grey circles, same data as in Fig. 11b) versus the proportion of oligotrophic water.
which is characterized by a pow of ∼0.2. The associated rain ratio of ∼5 is relatively high (Fig. 11a) and implies in line with sediment trap results that coccolithophorids are only of minor importance for the carbonate export in the Abian Sea. This in turn implies that changes of the rain ra-tios as discussed before are mainly caused by variations in the growth and export rates of foraminifera. Enhanced rain ratios associated with even a slightly increased contribution of diatoms in the planktonic community structure could for example results from predators such as copepods competing with foraminifera for diatoms.
High rain ratios seem to characterize the oligotrophic re-gion, in which cyanobacteria dominate the planktonic com-munity (Figs. 11, 9b). These high rain ratios derived from mixing analysis are not mirrored by the sediment trap data which reveal the lowest values in this region (Fig. 11). Since it is generally assumed that cyanobacteria are rapidly rem-ineralized in the upper water column and hardly sink into the deep sea (Karl et al., 1996, 1997) a preferential decom-position of cyanobacterial biomass could explain the differ-ence between the rain ratios derived from the mixing anal-ysis and the those obtained from the sediment trap data. A preferential decomposition of more labile nitrogen contain-ing compounds in the water column (Lee and Cronin, 1982; Wakeham et al., 1997; Lee et al., 2000) is also indicated by C/N ratios which are lower in the organic matter produced in the surface water than those measured in organic mat-ter inmat-tercepted by sediment traps in the oligotrophic regions (Fig. 12).
4.4 C/N and C/P ratios
Contrary to the oligotrophic region C/N ratios partly decrease with depth impling a preferential decomposition
carbon-enriched material in the upwelling area (Fig. 12). Such
carbon-enriched organic matter could be transparent ex-opolymers (TEP) which are produced by diatoms and fos-ter the formation of fast-sinking marine snow (Passow et al., 1994, 2001). The formation of TEP raises the C/P ratios especially at the end of diatom blooms (Engel et al., 2002) and along the transect at the transition from the upwelling towards the oligotrophic system the CP ratios reveal a drop from values >108 to 78 (Fig. 5a). The huge decrease of the C/P and C/N ratios is not reflected in the C/N ratios of the exported matter in the deep sea which show only a ∼7% de-crease at the transition from the upwelling towards the olig-otrophic system (Fig. 11b). This implies that the preferential decomposition of TEP-like organic matter in the upper wa-ter column reduces the impact of the TEP formation on the Redfield ratio in the exported matter during diatom blooms.
5 Conclusions
The evaluation of data collected during the U.S. and German JGOFS expedition in 1995 suggest that an intense grazing decline and impede the development of large diatom blooms in a silicon-enriched near shore upwelling system off Oman. Within the offshore advecting upwelled water mass a large diatom blooms enhancing the organic carbon export into the deep sea develop only during the later phase of the upwelling period. During the onset of the upwelling season no large diatoms blooms occurs in the open western Arabian Sea, de-spite increased concentrations of dissolved silicon in the sur-face water. Enhanced iron concentration due to eolian dust inputs into the offshore advecting upwelled water might have favoured grazing at this time because it leads to the formation of thinner diatom shells. The decrease of the rain ratios dur-ing transition from upwelldur-ing towards the oligotrophic off-shore region seems to be caused by foraminifera competing with diatom-grazing copepods for food. The large variabil-ity of Redfield ratios and also of the rain ratios in the olig-otrophic region is not reflected in the sediment trap record. This suggests that the decomposition of organic matter in the water columns contributes to the relative uniform global mean Redfield ratio and leads to an underestimation of rain ratios derived from sediment traps records in oligotrophic re-gions dominated by cyanobacteria.
Acknowledgements. We would like to thank all the scientists,
technicians, and officers and their crews of the numerous research vessels as well as the national funding agencies who made the Joint Global Ocean Flux Study in the Arabian Sea possible. Particularly, we would like to appreciate the work of S. Honjo, S. Manganini, T. Dickey, K. Buesseler, C. I. Measures, S. Vink, J. M. Morrison, D. L. Garrison, L. Codispoti, and S. L. Smith which in particular contributed to our study. We would like to thank also C. Lee, S. W. A. Naqvi and T. Pohlmann for helpful discussions. Furthermore, we are grateful to the Federal German Ministry for Education, Science, Research and Technology (BMBF, Bonn)
and the German Research Council (DFG, Bonn), the Council of Scientific and Industrial Research (CSIR, New Delhi), and the De-partment of Ocean Development (DOD, New Delhi) for financial support of the Bilateral Indo/German Program on Biogeochemical Fluxes in the northern Indian Ocean. P. Wessels and W. H. F. Smith are acknowledged for providing the generic mapping tools (GMT), as well as B. Aksen for secretarial assistance.
Edited by: A. Watson
References
Anderson, L. A. and Sarmiento, J. L.: Redfield ratios of rem-ineralization determined by nutrient data analysis, Global Bio-geochem. Cycles, 8(1), 65–80, 1994.
Antoine, D., Andr´e, J.-M., and Morel, A.: Oceanic primary produc-tion – 2. Estimaproduc-tion at global scale from satellite (coastal zone color scanner) chlorophyll, Global Biogeochem. Cycles, 10(1), 57–69, 1996.
Archer, D., Winguth, A. M. E., Lea, D., and Mahowald, N.: What caused the glacial/interglacial atmospheric pCO2cycles?, Rev.
Geophys., 38(2), 159–189, 2000.
Berger, W. H. and Keir, R. S.: Glacial-Holocene Changes in At-mospheric CO2and the Deep-Sea Record, in: Climate Processes
and Climates Sensitivity, edited by: Hansen, J. E. and Takahashi, T., Am. Geophys. Union, Washington, 337–351, 1984.
Broecker, W. S. and Peng, T.-H.: Tracers in the sea, Lamont-Doherty Geological Observatory, Columbia University, Pal-isades, New York, 690 pp., 1982.
Buesseler, K., Ball, L., Andrews, J., Benitez-Nelson, C., Belastock, R., Chai, F., and Chao, Y.: Upper ocean export of particulate or-ganic carbon in the Arabian Sea derived from thorium-234, Deep Sea Research II, 45(10–11), 2461–2487, 1998.
Burkhardt, S., Zondervan, I., and Riebesell, U.: Effect of CO2concentration on C: N: P ratio in marine phytoplankton: A species comparison, Limnology and Oceanography, 44(3), 683– 690, 1999.
Conley, D. J.: Terrestrial ecosystems and the biogeochemical silica cycle, Global Biogeochem. Cycles, 16(4), 68-1–68-8, 2002. Dugdale, R. C. and Goering, J. J.: Uptake of new and
regener-ated forms of nitrogen in primary productivity, Limnology and Oceanography, 12, 196–206, 1967.
Dugdale, R. C. and Wilkerson, F. P.: Silicate regulation of new pro-duction in the equatorial Pacific upwelling, Nature, 391, 270– 273, 1998.
Egge, J. K. and Aksnes, D. L.: Silcate as regulating nutrient in phytoplankton competition, Marine Ecology Progress Series, 83, 281–289, 1992.
Engel, A., Goldtwait, S., Passow, U., and Alldredge, A. L.: Tempo-ral decoupling of carbon and nitrogen dynamics in a mesocosm diatom bloom, Limnology and Oceanography, 47(3), 753–761, 2002.
Eppley, R. W. and Peterson, B. J.: Particulate organic matter flux and planktonic new production in the deep ocean, Nature, 282, 677–680, 1979.
Falkowski, P., Scholes, R. J., Boyle, E., Canadell, J., Canfield, D., Elser, J., Gruber, N., Hibbard, K., H¨ogberg, P., Linder, S., Mackenzie, F. T., Moore III, B., Pedersen, T., Rosenthal, Y., Seitzinger, S., Smetacek, V., and Steffen, W.: The Global Carbon
Cycle: A Test of Our Knowledge of Earth as a System, Science, 290, 291–296, 2000.
Feely, R. A., Sabine, C. L., Takahashi, T., and Wanninkhof, R.: Uptake and storage of carbon dioxide in the ocean: The global survey, Oceanography, 14(4), 18–32, 2001.
Findlater, J.: Observational Aspects of the Low-level Cross-equatorial Jet Stream of the Western Indian Ocean, Pageoph., 115, 1251–1262, 1977.
Fischer, A. S., Weller, R. A., Rudnick, D. L., Eriksen, C. C., Lee, C. M., Brink, K. H., Fox, C. A., and Leben, R. R.: Mesoscale eddies, coastal upwelling, and the upper-ocean heat budget in the Arabian Sea, Deep Sea Research Part II: Topical Studies in Oceanography, 49(12), 2231–2264, 2002.
Froelich, P. N., Blanc, V., Mortlock, R. A., and Chillrud, S. N.: River fluxes of dissolved silica to te ocean were higher during glacials: Ge/Si in diatoms, rivers, and oceans, Paleoceanography, 7(6), 739–767, 1992.
Garrison, D. L., Gowing, M. M., Hughes, M. P., Campbell, L., Caron, D. A., Dennett, M. R., Shalapyonok, A., Olson, R. J., Landry, M. R., and Brown, S. L.: Microbial food web structure in the Arabian Sea: a US JGOFS study, Deep Sea Research II, 47(7–8), 1387–1422, 2000.
Geider, R. J. and La Roche, J.: Redfield revisited: variability of C:N:P in marine microalgae and its biochemical basis, European Journal of Phycology, 37, 1–17, 2002.
Goldman, J. C., McCarthy, J. J., and Peavey, D. G.: Growth rate in-fluence on the chemical composition of phytoplankton in oceanic waters, Nature, 279, 210–214, 1979.
Goyet, C., Millero, F. J., O’Sullivan, D. W., Eischeid, G., McCue, S. J., and Bellerby, R. G. J.: Temporal variations of pCO2 in
surface seawater of the Arabian Sea in 1995, Deep Sea Research I, 45(4–5), 609–623, 1998a.
Goyet, C., Metzl, N., Millero, F., Eischeid, G., O’Sullivan, D., and Poisson, A.: Temporal variation of the sea surface CO2/carbonate properties in the Arabian Sea, Marine Chemistry, 63(1–2), 69–79, 1998b.
Goyet, C., Coatanoan, C., Eischeid, G., Amaoka, T., Okuda, K., Healy, R., and Tsunogai, S.: Spatial variation of total CO2and
total alkalinity in the northern Indian Ocean: A novel approach for the quantification of anthropogenic CO2in seawater, J.
Ma-rine Res., 57, 135–163, 1999.
Haake, B., Rixen, T., and Ittekkot, V.: Variability of moonsonal up-welling signals in the deep western Arabian Sea, SCOPE/UNEP Sonderband, 76, 85–96, 1993a.
Haake, B., Ittekkot, V., Rixen, T., Ramaswamy, V., Nair, R. R., and Curry, W. B.: Seasonality and interannual variability of parti-cle fluxes to the deep Arabian Sea, Deep Sea Research I, 40(7), 1323–1344, 1993b.
Hamm, C. E., Merkel, R., Springer, O., Jurkojc, P., Maler, C., Prechtel, K., and Smetacek, V.: Architecture and material prop-erties of diatom shells provide effective mechanical protection, Nature, 421, 841–843, 2003.
Harrison, K. G.: Role of increased marine silica input on
paleo-pCO2levels, Paleoceanography, 15(3), 292–298, 2000.
Hedges, J. I., Baldock, J. A., Gelinas, Y., Lee, C., Peterson, M. L., and Wakeham, S. G.: The biochemical and elemental composi-tion of marine plankton: A NMR perspective, Marine Chemistry, 78, 47–63, 2002.
in the greenhouse, Geophys. Res. Lett., 31, L16308, doi:10.1029/2004GL020613, 2004.
Heinze, C., Maier-Reimer, E., and Winn, K.: Glacial pCO2 Reduc-tion by the World Ocean: Experiments with the Hamburg Carbon Cycle Model, Paleoceanography, 6(4), 395–430, 1991.
Honjo, S., Dymond, J., Prell, W., and Ittekkot, V.: Monsoon-controlled export fluxes to the interior of the Arabian Sea, Deep Sea Research II, 46(8–9), 1859–1902, 1999.
Hupe, A. and Karstensen, J.: Redfield stoichiometry in Arabian Sea subsurface waters, Global Biogeochem. Cycles, 14(1), 357–372, 2000.
Hutchins, D. A. and Bruland, K. W.: Iron-limited diatom growth and Si:N uptake ratios in a costal upwelling regime, Nature, 393, 561–564, 1998.
Karl, D., Letelier, R., Tupas, L., Dore, J., Christian, J., and Hebel, D.: The role of nitrogen fixation in biogeochemical cycling in the suptropical North Pacific Ocean, Nature, 388, 533–538, 1997. Karl, D. M., Christian, J. R., Dore, J. E., Hebel, D. V., Letelier,
R. M., Tupas, L. M., and Winn, C. D.: Seasonal and interan-nual variability in primary production and particle flux at Station ALOHA, Deep Sea Research II, 43(2–3), 539–568, 1996. Klausmeier, C. A., Lichtman, E., Daufresne, T., and Levin, S., A.:
Optimal nitrogen-to-phosphorus stoichiometry of phytoplank-ton., Nature, 429, 171–174, 2004.
K¨ortzinger, A., Duinker, J. C., and Mintrop, L.: Strong CO2emissions from the Arabian Sea during south-west mon-soon, Geophys. Res. Lett., 24(14), 1763–1766, 1997.
Lalli, C. and Parsons, T. R.: Biological Oceanography, an introduc-tion, 301 p., Pergamon Press Ltd, Oxford, 1993.
Lee, C. and Cronin, C.: The vertical flux of particulate organic ni-trogen in the sea: decomposition of amino acids in the Peru up-welling area and the equatorial Atlantic, J. Marine Res., 40(1), 227–251, 1982.
Lee, C., Wakeham, S. G., and Hedges, I. J.: Composition and flux of particulate amino acids and chloropigments in equatorial Pa-cific seawater and sediments, Deep Sea Research Part I: Oceano-graphic Research Papers, 47(8), 1535–1568, 2000.
Lee, C., Murray, D. W., Barber, R. T., Buesseler, K. O., Dymond, J., Hedges, J. I., Honjo, S., Manganini, S. J., and Marra, J.: Particu-late organic carbon fluxes: compilation of results from the 1995 US JGOFS Arabian Sea Process Study, Deep Sea Research II, 45(10–11), 2489–2501, 1998.
Liss, P. S. and Merlivat, L.: Air-sea gas exchange rates: Introduction and synthesis, in: The Role of Air-Sea Exchange in Geochemi-cal Cycling, edited by: Buat-Mernard, P., p. 113–129, Reidel, Boston, 1986.
Maier-Reimer, E.: Dynamic vs. apparent Redfield ratio in the oceans: A case for 3D-models, J. Marine Syst., 9, 113–120, 1996.
Maier-Reimer, E., Mikolajewicz, U., and Winguth, A.: Future ocean uptake of CO2: interaction between ocean circulation and biology, Climate Dynamics, 12, 711–721, 1996.
Matsumoto, K. and Sarmiento, J. L.: Silicic acid leakage from the Southern Ocean: A possible explanation for glacial atmospheric
pCO2, Global Biogeochem. Cycles, 16(3), 5-1–5-23, 2002.
Measures, C. I. and Vink, S.: Seasonal variations in the distribu-tion of Fe and Al in the surface waters of the Arabian Sea, Deep Sea Research Part II: Topical Studies in Oceanography, 46(8-9), 1597–1622, 1999.
Millero, F. J., Degler, E. A., O’Sullivan, D. W., Goyet, C., and Eis-cheid, G.: The carbon dioxide system in the Arabian Sea, Deep Sea Research Part II: Topical Studies in Oceanography, 45(10– 11), 2225–2252, 1998.
Milliman, J. D. and Droxler, A. W.: Neritic and pelagic carbonate sedimentation in the marine environment: ignorant is not bliss, Geologische Rundschau, 85, 496–504, 1996.
Morrison, J. M., Codispoti, L. A., Gaurin, S., Jones, B., Mang-hanani, V., and Zheng, Z.: Seasonal variation of hydrographic and nutrient fields during the US JGOFS Arabian Sea Process Study, Deep Sea Research II, 45(10–11), 2053–2101, 1998. Nightingale, P. D., Malin, G., Law, C. S., Watson, A. J., Liss, P. S.,
Liddicoat, M. I., Boutin, J., and Upstill-Goddard, R. C.: In situ evaluation of air-sea gas exchange parameterizations using novel conservative and volatile tracers, Global Biogeochem. Cycles, 14, 373–387, 2000.
Passow, U., Alldredge, A. L., and Logan, B. E.: The role of particu-late carbohydrate exudates in the flocculation of diatom blooms, Deep Sea Research I, 41(2), 335–357, 1994.
Passow, U., Shipe, R. F., Murray, A., Pak, D. K., Brzezinski, M. A., and Alldredge, A. L.: The origin of transparent exopolymer par-ticles (TEP) and their role in the sedimentation of particulate matter, Continental Shelf Research, 21(4), 327–346, 2001. Ramage, C. S.: Monsoon Meteorology, Academic Press, New York,
London, 1971.
Ramage, C. S.: Monsoon Climates, in: The Encyclopedia of Cli-matology, edited by: Oliver, J. E. and Fairbridge, R. W., Van Nostrand Reinhold Company, New York, 1987.
Redfield, A. C., Ketchum, B. H., and Richards, F. A.: The Influence of organisms on the composition of sea-water, in: The sea, edited by: Hitt, M., N., pp. 26–77, Wiley & Sons, New York, 1963. Ridgwell, A. J., Watson, A. J., and Archer, D.: Modeling the
re-sponse of the oceanic Si inventory to perturbation, and con-sequences for atmospheric CO2, Global Biogeochem. Cycles,
16(4), 19-1–19-15, 2002.
Rixen, T., Haake, B., and Ittekkot, V.: Sedimentation in the western Arabian Sea: the role of coastal and open-ocean upwelling, Deep Sea Research II, 47, 2155–2178, 2000.
Rixen, T., Guptha, M. V. S., and Ittekkot, V.: Sedimentation, in: Report of the Indian Ocean Synthesis Group on the Arabian Sea Process Study, edited by: Watts, L., Burkill, P. H., and Smith, S., pp. 65–73, JGOFS International Project Office, Bergen, 2002. Rixen, T., Guptha, M. V. S., and Ittekkot, V.: Deep ocean fluxes and
their link to surface ocean processes and the biological pump, Progress in Oceanography, 65, 240–259, 2005.
Rixen, T., Haake, B., Ittekkot, V., Guptha, M. V. S., Nair, R. R., and Schl¨ussel, P.: Coupling between SW monsoon-related sur-face and deep ocean processes as discerned from continous parti-cle flux meausurements and correlated satellite data, J. Geophys. Res., 101(C12), 28 569–28 582, 1996.
Sabine, C. L., Wanninkhof, R., Key, R. M., Goyet, C., and Millero, F. J.: Seasonal CO2fluxes in the tropical and subtropical Indian
Ocean, Marine Chemistry, 72(1), 33–53, 2000.
Sarmiento, J. L., Dunne, J., Gnanadesikan, A., Key, R. M., Mat-sumoto, K., and Slater, R.: A new estimate of the CaCO3 to organic carbon export ratio, Global Biogeochem. Cycles, 16(4), 54-1–54-12, 2002.
Schiebel, R.: Planktic foraminiferal sedimentation and the marine calcite budget, Global Biogeochem. Cycles, 16(4), 13-1–13-21,
2002.
Schiebel, R., Zeltner, A., Treppke, U. F., Waniek, J., Bollmann, J., Rixen, T., and Hemleben, C.: Distribution of diatoms, coccol-ithophores and planktic foraminiferes along a trophic gradient during the SW monsoon in the Arabian Sea, Marine Micropale-ontology, 51, 345–371, 2004.
Smith, S., Roman, M., Prusova, I., Wishner, K., Gowing, M., Codis-poti, L. A., Barber, R., Marra, J., and Flagg, C.: Seasonal re-sponse of zooplankton to monsoonal reversals in the Arabian Sea, Deep Sea Research Part II: Topical Studies in Oceanogra-phy, 45(10–11), 2369–2403, 1998.
Smith, S. L.: Understanding the Arabian Sea: Reflections on the 1994–1996 Arabian Sea Expedition, Deep Sea Research Part II: Topical Studies in Oceanography, 48(6–7), 1385–1402, 2001. Tegen, I. and Fung, I.: Modeling of mineral dust in the atmosphere,
J. Geophys. Res., 99(D11), 22 897–22 914, 1994.
Tegen, I. and Fung, I.: Contribution to the atmospheric mineral aerosol load from land surface modification, J. Geophys. Res., 100(D9), 18 707–18 726, 1995.
Tyrrell, T.: The relative influences of nitrogen and phosphorus on oceanic primary production, Nature, 400, 525–531, 1999. Volk, T. and Hoffert, M. I.: The carbon cycle and atmospheric CO2,
natural variation archean to present, edited by: Sundquits, E. T. and Broecker, W. S., p. 99–110, AGU, Washington, 1985. Wakeham, S. G., Lee, C., Hedges, J. I., Hernes, P. J., and Peterson,
M. L.: Molecular indicators of diagenetic status in marine or-ganic matter, Geochimica et Cosmochimica Acta, 61(24), 5363– 5369, 1997.
Wanninkhof, R.: Relationship between gas exchange and wind speed over the ocean, J. Geophys. Res., 97, 7373–7381, 1992. Wanninkhof, R. and McGillis, W. M.: A cubic relationship between
gas transfer and wind speed, Geophys. Res. Lett., 26, 1889–1983, 1999.
Weller, R. A., Baumgartner, M. F., Josey, S. A., Fischer, A. S., and Kindle, J. C.: Atmospheric forcing in the Arabian Sea during 1994–1995: observations and comparisons with climatology and models, Deep Sea Research Part II: Topical Studies in Oceanog-raphy, 45(10–11), 1961–1999, 1998.
Weller, R. A., Fischer, A. S., Rudnick, D. L., Eriksen, C. C., Dickey, T. D., Marra, J., Fox, C., and Leben, R.: Moored observations of upper-ocean response to the monsoons in the Arabian Sea dur-ing 1994–1995, Deep Sea Research Part II: Topical Studies in Oceanography, 49(12), 2195–2230, 2002.
Zeebe, R. E. and Wolf-Gladrow, D.: CO2In Seawater: Equilibrium,
Kinetics, Isotopes, 346 p., Elsevier Science B. V., Amsterdam, 2001.
Zeltner, A.: Monsoonal influenced changes of coccolithophore communities in the northern Indian Ocean – alteration during sedimentation and record in surface sediments, in: T¨ubinger Mikropal¨aontologische Mitteilungen, pp. 103, Institut und Mu-seum f¨ur Geologie und Pal¨aontologie der Universit¨at T¨ubingen, T¨ubingen, 2000.