Dagnachew et al. J. Appl. Biosci. 2014. AMMI and GGE biplot analyses aid selection of high yielding and adapted finger millet varieties
Additive Main Effects and Multiplicative Interactions
(AMMI) and genotype by environment interaction
(GGE) biplot analyses aid selection of high yielding
and adapted finger millet varieties
*Dagnachew Lule1 2, Masresha Fetene3, Santie de Villiers4 and Kassahun Tesfaye11Departmentof Microbial, Cellular & Molecular Biology, Addis Ababa University, Tel (+251)-911813638, *E-mail:
2Bako Agricultural Research Centre, Bako, Ethiopia
3DepartmentofPlant Biology and Biodiversity Management, Addis Ababa University; 4Department of Chemistry and Biochemistry, Pwani University, Kenya
Original submitted in on 7th March 2014. Published online at www.m.elewa.org on 30th April 2014.
http://dx.doi.org/10.4314/jab.v76i1.1 ABSTRACT
Background and justification: Lack of stable high yielding cultivars is one of the major bottlenecks for production and productivity of finger millets in Ethiopia. Identification of adaptable, stable and high yielding genotypes under varying environmental conditions prior to release as a cultivar is the first and foremost steps for plant breedingr and this has direct bearing on the adoption of the variety, its productivity and total production of the crop.
Objective: The major objectives of the present study were to (i) assess the stability and yield performance of advanced finger millet genotypes evaluated in multiple environments, and (ii) identify stable high yielding candidate cultivar (s) for possible release using different statistical tools.
Material and methods: A total of 30 advanced finger millet genotypes were evaluated against two standard checks (Gute and Taddese) across four locations (Arsi Negele, Assosa, Bako and Gute) in 2012 and 2013 main cropping seasons. The trial was arranged in a randomized complete block design (RCBD) replicated three times.
Summary result and application of the study: Additive Main effect and Multiplicative Interaction (AMMI), Genotype and Genotype by Environment interaction (GGE) biplot analysis and, Eberhart and Russell model revealed that Acc. 203544 is stable high yielding (3.16 ton ha-1) with a yield advantage of 13.7% over the best standard check, Gute (2.78 ton ha-1), and thus should be recommended for possible release with wider environmental adaptability. Acc. 242111 (3.08 ton ha-1), Acc. BKFM0051 (3.07 ton ha-1) and Acc.229738 (2.99 ton ha-1) were also high yielding, but showed narrow stability and thus should be recommended for verification and possible release for specific environments.
Key words/phrases: Additive main effect and multiplicative interaction (AMMI), Finger millet (Eleusine coracana subsp. coracana), Genotype by Environment Interaction (GEI)
Journal of Applied Biosciences 76:6291– 6303
Dagnachew et al. J. Appl. Biosci. 2014. AMMI and GGE biplot analyses aid selection of high yielding and adapted finger millet varieties
INTRODUCTION
Finger millet (Eleusine coracana subsp. coracana) represents one of the critical plant genetic resources for the agriculture and food security of farmers inhabiting arid, infertile and marginal lands (Barbeau and Hilu, 1993). It has excellent nutritional value as its seeds contain 7 – 14% protein (Barbeau and Hilu, 1993) and is rich in calcium, iron, methionine, phosphorus, carbohydrate and other nutrients (Leung et al., 1968). In general, breeding efforts in finger millet has been limited and farmers are growing unimproved and low yielding cultivars (Dida et al., 2007; Neves, 2011). In Ethiopia, it occupies diversified agro-ecologies with a vast range of genetic variability and its utilization is deep-rooted in the culture of the people (Kebede and Menkir, 1986). The area allotted to the crop is increasing yearly (CSA, 2013). However, the current national average productivity is 1.5 tons ha-1 (CSA, 2013); half of the potential productivity (3 tons ha-1) (Tadesse et al., 1995). The lower productivity could be attributed mainly due to lack of stable high yielding and adaptable improved varieties, poor management practices and other biotic and abiotic factors (Kebede and Menkir, 1986; Bezawuletaw et al., 2006). This necessitates development of stable high yielding cultivars with additional desirable traits. Evaluating genotypes under varying environmental conditions to recommend a new varietyies for release as cultivars is fundamental and this has direct bearing on the adoption of a variety, productivity and total production of the crop (Flores et al., 1998;
Showemimo et al., 2000; Mustapha et al., 2001). Genotypes exhibit fluctuating yields when grown in different environments or agro-climatic zones. This complicates demonstrating the superiority of a particular variety. Multi- environment yield trials are crucial to identify adaptable high yielding cultivars and discover sites that best represent the target environment (Yan et al., 2000). Adaptability is the result of genotype, environment and genotype by environment interaction and generally falls into two classes: (1) the ability to perform at an acceptable level in a range of environments, referred to as general adaptability, and (2) the ability to perform well only in desirable environments, known as specific adaptability (Farshadfar and Sutka, 2006). Combined analysis of variance can quantify G x E interactions and describe the main effects but does not explain the interaction effect (Yuksel et al., 2002; Asnake et al., 2013). AMMI model and GGE biplot analysis are the most commonly used analytical and statistical tools to determine the pattern of genotypic responses across environments (Gauch and Zobel, 1996; Yan et al., 2000; Yuksel et al., 2002). The goal of the present study was, therefore, to determine the stability and yield performance of advanced finger millet genotypes at multiple locations using GGE biplot analysis, AMMI and the Eberhart and Russell model in order to identify stable high yielding candidate cultivar(s) recommend for possible release in the test environments and similar agro ecologies.
MATERIALS AND METHODS
Thirty advanced finger millet genotypes were evaluated against the standard checks (Gute and Tadesse) at 4 locations - Arsi Negele (1947 m.a.s.l., 07019, N, 38039,
following the finger millet descriptor (IBPGR, 1985). However, since grain yield is the central parameters for measurement of varietal adaptability and stability, data
Dagnachew et al. J. Appl. Biosci. 2014. AMMI and GGE biplot analyses aid selection of high yielding and adapted finger millet varieties
Y
ij=µ
i+ b
iI
j+s
2d
ij;
Where
Yi
j was the mean performance ofi
th variety inj
thenvironment, µi was the mean of ithvariety over all
environments; bi is the regression coefficient which measured the response of ith variety to varying
environment;
s
2d
ij was deviation from regression ofi
thvariety in the
j
th environment, andI
j was theenvironmental index of
j
th environment. Regression coefficient (b
i) was considered as an indication of theresponse of the genotype to varying environment. If the regression coefficient was close to one (
b
i = 1.0), thegenotype was adapted in all environments, genotypes with bi > 1.0 were more responsive or adapted to high
yielding environments, whereas any genotype with
b
isignificantly lower than 1.0 was adapted to low yielding environments (Eberhart and Russell, 1966). Both AMMI and Eberhart and Russel models were computed using Agrobase software (Agrobase, 2000).
Additive mean effect and multiplicative interaction model: The AMMI model:
Y
ger=µ+ α
g+ β
e+ ∑
nλ
nγ
gnδ
en+ ε
ger+ρ
ge;
where
Y
gerwas the observed yield of genotype (g) inenvironment (e) for replication (r);
Additive parameters: µ was the grand mean;
α
gis thedeviation of genotype g from the grand mean,
β
eis thedeviation of the environment e;
Multiplicative parameters:
λ
nwas the singular valuefor interaction principal component axis (IPCA) n,
γ
gnwas the genotype eigenvectorfor axis n, and
δ
enis theenvironment eigenvector;
ε
ger is the error term andρ
geare PCA residuals. Accordingly, genotypes with low (regardless of the sign) IPCA scores showed general or wider adaptability, while those with high IPCA scores showed specific adaptability (Gauch and Zobel, 1996). AMMI Stability Value (ASV): The ASV is the distance from the coordinate point to the origin in a two-dimensional plot of IPCA1 scores against IPCA2 scores in the AMMI model (Purchase, 1997). Because the IPCA1 score contributes more to the G x E interaction sum of squares, a weighted value is needed. This was calculated for each genotype and each environment according to the relative contribution of IPCA1 to IPCA2 as follows:
2 2
2
1
)(
1
)]
(
2
)
[(
SS
SS
IPCA
score
IPCA
score
ASV
IPCA
IPCA
÷
+
=
Where SSIPCA1/SSIPCA2 was the weight given to the
IPCA1-value by dividing the IPCA1 sum of squares by the IPCA2 sum of squares. The larger the ASV value, either negative or positive, the more specifically adapted a genotype was to certain environments. A
smaller ASV value indicated a more stable genotype across environments (Purchase, 1997).
Genotype and Genotype by Environment Interaction biplot analysis: Genotype and Genotype by Environment Interaction biplot analysis was conducted using GenStat Release 15.1 computer software.
RESULT AND DISCUSSION
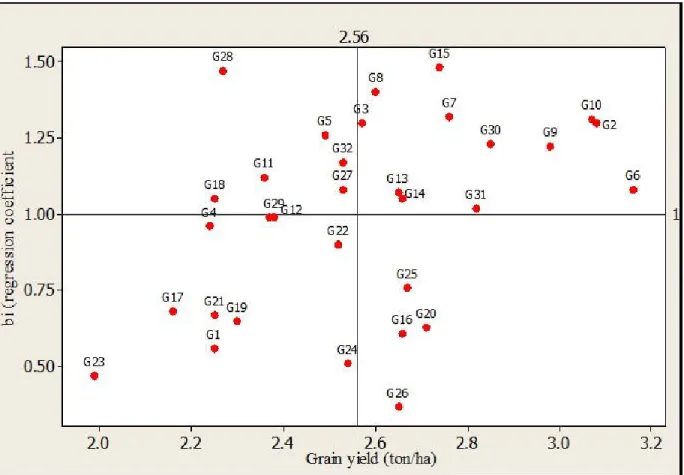
Analysis based on Eberhart and Russell regression model: Results from Eberhart and Russell model revealed that the best yielding accession, 203544 (G6) showed regression coefficient (
b
i) closer to one (1.08),suggesting that it was relatively stable and widely adaptaed candidate cultivar as compared to the rest of cultivars, though its deviation from regression was quite different from zero (0.42) (Table 1; Fig 1). Ebrehart and Russell (1996) noted that cultivars with high yield and regression coefficients closer to one, but squared deviation from regression (
s
2di
) different from zeroshould be considered stable and adaptable to wider environments. The other three relatively stable and high yielding accessions, Acc. 242111 (G2), Acc. BKFM0051 (G10) and Acc. 229738 (G9) recorded regression coefficient higher than one (1.40, 1.41 and 1.32, respectively) and squared deviation from regression different from zero (0.54, 0.27 and 1.40, respectively). This implied that those genotypes were highly responsive for the changes in environmental conditions and hence can be recommended for favourable growing conditions with appropriate
Dagnachew et al. J. Appl. Biosci. 2014. AMMI and GGE biplot analyses aid selection of high yielding and adapted finger millet varieties
agronomic practices. On the other hand, Acc. 230104 (G1), Acc. BKFM0028 (G23) and Acc. BKFM0042 (G24) gave grain yield below the average and regression coefficient lower than one (0.58, 0.47 and 0.51, respectively) indicating that they were adapted to low yielding environments (Table 1; Fig 1). Generally, the regression coefficient (
b
i) ranged from 0.37 to 1.48in the present study, indicating wider deviation from the ideal or stable genotypes. On the contrary, though the number of test genotypes was small, Dogan, et al. (2011) reported that regression coefficient (bi) ranged
from 0.824 to 1.180 for 8 triticale genotypes, showing narrow deviation from ideal regression.
Dagnachew et al. J. Appl. Biosci. 2014. AMMI and GGE biplot analyses aid selection of high yielding and adapted finger millet varieties
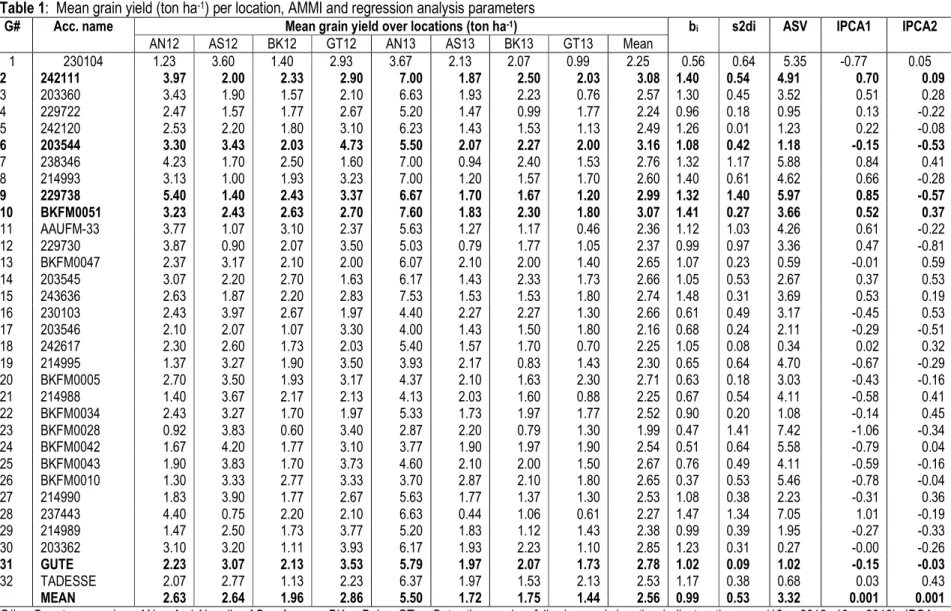
Table 1: Mean grain yield (ton ha-1) per location, AMMI and regression analysis parameters
G# Acc. name Mean grain yield over locations (ton ha-1) bi s2di ASV IPCA1 IPCA2
AN12 AS12 BK12 GT12 AN13 AS13 BK13 GT13 Mean
1 230104 1.23 3.60 1.40 2.93 3.67 2.13 2.07 0.99 2.25 0.56 0.64 5.35 -0.77 0.05 2 242111 3.97 2.00 2.33 2.90 7.00 1.87 2.50 2.03 3.08 1.40 0.54 4.91 0.70 0.09 3 203360 3.43 1.90 1.57 2.10 6.63 1.93 2.23 0.76 2.57 1.30 0.45 3.52 0.51 0.28 4 229722 2.47 1.57 1.77 2.67 5.20 1.47 0.99 1.77 2.24 0.96 0.18 0.95 0.13 -0.22 5 242120 2.53 2.20 1.80 3.10 6.23 1.43 1.53 1.13 2.49 1.26 0.01 1.23 0.22 -0.08 6 203544 3.30 3.43 2.03 4.73 5.50 2.07 2.27 2.00 3.16 1.08 0.42 1.18 -0.15 -0.53 7 238346 4.23 1.70 2.50 1.60 7.00 0.94 2.40 1.53 2.76 1.32 1.17 5.88 0.84 0.41 8 214993 3.13 1.00 1.93 3.23 7.00 1.20 1.57 1.70 2.60 1.40 0.61 4.62 0.66 -0.28 9 229738 5.40 1.40 2.43 3.37 6.67 1.70 1.67 1.20 2.99 1.32 1.40 5.97 0.85 -0.57 10 BKFM0051 3.23 2.43 2.63 2.70 7.60 1.83 2.30 1.80 3.07 1.41 0.27 3.66 0.52 0.37 11 AAUFM-33 3.77 1.07 3.10 2.37 5.63 1.27 1.17 0.46 2.36 1.12 1.03 4.26 0.61 -0.22 12 229730 3.87 0.90 2.07 3.50 5.03 0.79 1.77 1.05 2.37 0.99 0.97 3.36 0.47 -0.81 13 BKFM0047 2.37 3.17 2.10 2.00 6.07 2.10 2.00 1.40 2.65 1.07 0.23 0.59 -0.01 0.59 14 203545 3.07 2.20 2.70 1.63 6.17 1.43 2.33 1.73 2.66 1.05 0.53 2.67 0.37 0.53 15 243636 2.63 1.87 2.20 2.83 7.53 1.53 1.53 1.80 2.74 1.48 0.31 3.69 0.53 0.19 16 230103 2.43 3.97 2.67 1.97 4.40 2.27 2.27 1.30 2.66 0.61 0.49 3.17 -0.45 0.53 17 203546 2.10 2.07 1.07 3.30 4.00 1.43 1.50 1.80 2.16 0.68 0.24 2.11 -0.29 -0.51 18 242617 2.30 2.60 1.73 2.03 5.40 1.57 1.70 0.70 2.25 1.05 0.08 0.34 0.02 0.32 19 214995 1.37 3.27 1.90 3.50 3.93 2.17 0.83 1.43 2.30 0.65 0.64 4.70 -0.67 -0.29 20 BKFM0005 2.70 3.50 1.93 3.17 4.37 2.10 1.63 2.30 2.71 0.63 0.18 3.03 -0.43 -0.16 21 214988 1.40 3.67 2.17 2.13 4.13 2.03 1.60 0.88 2.25 0.67 0.54 4.11 -0.58 0.41 22 BKFM0034 2.43 3.27 1.70 1.97 5.33 1.73 1.97 1.77 2.52 0.90 0.20 1.08 -0.14 0.45 23 BKFM0028 0.92 3.83 0.60 3.40 2.87 2.20 0.79 1.30 1.99 0.47 1.41 7.42 -1.06 -0.34 24 BKFM0042 1.67 4.20 1.77 3.10 3.77 1.90 1.97 1.90 2.54 0.51 0.64 5.58 -0.79 0.04 25 BKFM0043 1.90 3.83 1.70 3.73 4.60 2.10 2.00 1.50 2.67 0.76 0.49 4.11 -0.59 -0.16 26 BKFM0010 1.30 3.33 2.77 3.33 3.70 2.87 2.10 1.80 2.65 0.37 0.53 5.46 -0.78 -0.04 27 214990 1.83 3.90 1.77 2.67 5.63 1.77 1.37 1.30 2.53 1.08 0.38 2.23 -0.31 0.36 28 237443 4.40 0.75 2.20 2.10 6.63 0.44 1.06 0.61 2.27 1.47 1.34 7.05 1.01 -0.19 29 214989 1.47 2.50 1.73 3.77 5.20 1.83 1.12 1.43 2.38 0.99 0.39 1.95 -0.27 -0.33 30 203362 3.10 3.20 1.11 3.93 6.17 1.93 2.23 1.10 2.85 1.23 0.31 0.27 -0.00 -0.26 31 GUTE 2.23 3.07 2.13 3.53 5.79 1.97 2.07 1.73 2.78 1.02 0.09 1.02 -0.15 -0.03 32 TADESSE 2.07 2.77 1.13 2.23 6.37 1.97 1.53 2.13 2.53 1.17 0.38 0.68 0.03 0.43 MEAN 2.63 2.64 1.96 2.86 5.50 1.72 1.75 1.44 2.56 0.99 0.53 3.32 0.001 0.001
G# = Genotype number, AN = Arsi Negelle, AS = Assosa, BK = Bako, GT = Gute, the number following each location indicates the year (12 = 2012, 13 = 2013), IPCA = Interaction Principal Component Axis, CV = Coefficient of variation, LSD = Least Significance difference, GEI = Genotype by Environment Interaction, Cumu.Int = cumulative
Dagnachew et al. J. Appl. Biosci. 2014. AMMI and GGE biplot analyses aid selection of high yielding and adapted finger millet varieties
Dagnachew et al. J. Appl. Biosci. 2014. AMMI and GGE biplot analyses aid selection of high yielding and adapted finger millet varieties
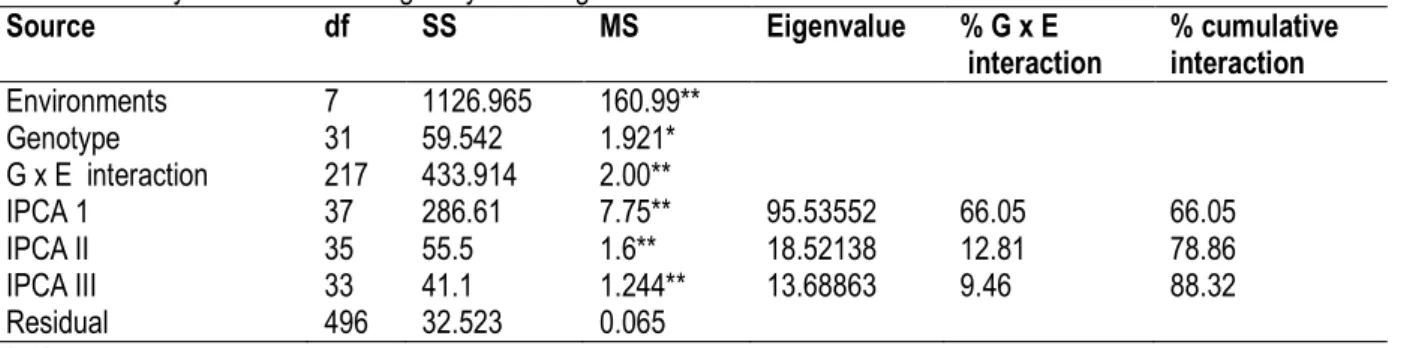
Additive Main Effects and Multiple Interaction (AMMI) model: Combined analysis of variance revealed highly significant (P≤0.01) variations among environments, genotype x environment interaction and IPCAs (Table 2). This result revealed that there was a differential yield performance among the finger millet genotypes across testing environments and the presence of strong genotype by environment (G X E) interaction. As G x E interaction was significant, further calculation of genotype stability is possible. Similarly, Farshadfar (2008) evaluated 20 bread wheat genotypes for four years under two different conditions and reported that significant variations among genotypes, environments and environment G X E interaction were recorded and thus necessitate stability analysis. Several authors also reported significant G x E interaction and thus stability analysis for bread wheat (Sial et al., 2000), rice (Panwar et al., 2008) and finger
millet (Misra et al., 2009).Substantial percentage of G x E interaction was explained by IPCA-1 (66.05%) followed by IPCA-2 (12.81%) and IPCA-3 (9.46%) (Table 2). The remaining five IPCAs axes contributed only 11.67% to G x E interaction. Because of their maximum , the first two principal components (IPCA-1 and IPCA-2) were used to plot a 2-dimensional GGE biplot. Gauch and Zobel (1996) suggested that the most accurate model for AMMI can be predicted by using the first two IPCAs. Several authors took the first two IPCAs for GGE biplot analysis since because the greater percentage of genotype by environment interaction (GEI), in most cases, were explained by the first IPCA such as for maize (Wonde and Labuschagne, 2005), bread wheat (Yuksel et al., 2002; Farshadfar, 2008; Asnake et al., 2013), common bean (Abeya et al., 2008), for finger millet (Misra et al., 2009) and field pea (Girma et al., 2011).
Table 2: Analysis of variance for grain yield using AMMI model
Source df SS MS Eigenvalue % G x E interaction % cumulative interaction Environments 7 1126.965 160.99** Genotype 31 59.542 1.921* G x E interaction 217 433.914 2.00** IPCA 1 37 286.61 7.75** 95.53552 66.05 66.05 IPCA II 35 55.5 1.6** 18.52138 12.81 78.86 IPCA III 33 41.1 1.244** 13.68863 9.46 88.32 Residual 496 32.523 0.065
*, ** significant at 0.05 and 0.01 probability levels, respectively.
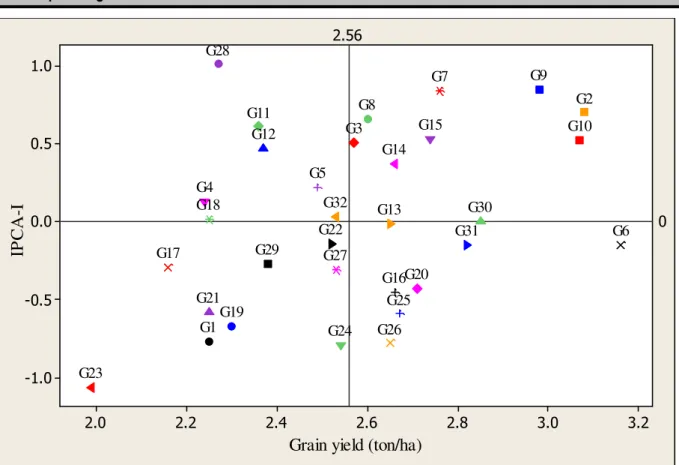
df= degree of freedom, SS=sum of squares, MS= mean squares, IPCA=Interaction Principal Component Axis Acc. 203544 (G6) produced the best average yield
(3.16 ton ha-1) and attained an IPCA-1 value relatively
close to zero (-0.15) indicating that it was a stable and widely adaptable cultivar (Table 1, Fig 2). Genotypic stability is crucial in addition to grain yield (Naroui et al., 2013). Acc. 203362 (G30) attained the lowest IPCA-1 score (-0.0002) and medium grain yield (2.85 ton ha-1)
(Table 1, Fig 2). Genotypes with below average yield, such as Acc. 242617, Tadesse, Acc. 229722 and Acc. BKFM0034 also showed IPCA-1 close to zero, indicating consistence in yield performance across locations. Acc. 242111 (3.08 ton ha-1), BKFM0051 (3.07
ton ha-1) and Acc. 229738 (2.99 ton ha-1) yielded better
than Gute (2.82 ton ha-1) but attained relatively high
IPCA-1 scores (0.70, 0.52 and 0.85, respectively) (Table 1, Fig. 2). Although these results indicated inconsistent yield performance across years and locations, they demonstrated site specific adaptability for these accessions. Acc. BKFM0028 (G23) yielded the least grain (1.99 ton ha-1) and attained the highest
IPCA-1 score (-1.06) implying that it was not adaptable (Fig 2; Table 1). Besides, Acc. 203546 (G17), Acc. 229722 (G4) and Acc. 230104 (G1) are among the low yielding genotypes (Table 2).
Dagnachew et al. J. Appl. Biosci. 2014. AMMI and GGE biplot analyses aid selection of high yielding and adapted finger millet varieties
Grain yield (ton/ha)
IP C A -I 3.2 3.0 2.8 2.6 2.4 2.2 2.0 1.0 0.5 0.0 -0.5 -1.0 2.56 0 G32 G31 G30 G29 G28 G27 G26 G25 G24 G23 G22 G21 G20 G19 G18 G17 G16 G15 G14 G13 G12 G11 G10 G9 G8 G7 G6 G5 G4 G3 G2 G1
Fig 2: Matrix plot of genotypes mean grain yield (ton ha-1) versus IPCA-1.
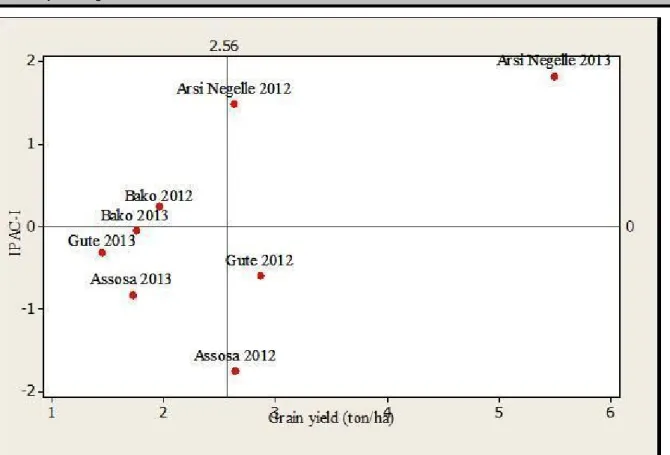
Except for Bako, all test environments exhibited fluctuating mean grain yields and IPCA scores in 2012 and 2013 (Fig 3). For instance, the overall mean grain yield at Arsi Negele during 2012 crop growing season was 2.63 ton ha-1, while the mean grain yield at the
same location during 2013 cropping season was 5.5 ton ha-1 (Fig 3; Table 1). The variation in weather
conditions, experimental plots and other edaphic factors could be the possible reason behind these fluctuations.
Dagnachew et al. J. Appl. Biosci. 2014. AMMI and GGE biplot analyses aid selection of high yielding and adapted finger millet varieties
Fig 3: Matrix plot of Environment focused mean grain yield versus Interaction Principal Component Axis (IPCA-1) scores.
AMMI Stability Value (ASV) : AMMI Stability Value aids selection of relatively stable high yielding genotypes. An ideal genotype should have high mean grain yield and small ASV. Accordingly, Acc. 203362 (G30), an introduced accession from Zimbabwe, showed the lowest ASV (0.266) and moderate grain yield (2.85 ton ha-1). Furthermore, Acc. 203544 (G6), an
introduced accession from Kenya, was the highest yielding genotype (3.16 ton ha-1) with relatively lower
ASV (1.18) (Table 1). These results revealed that those accessions are showing relatively better stability than the rest of accessions. However, stability needs to be considered in combination with yield (Farshadfar, 2008). Thus, Acc. 242111, Acc. BKFM0051 and Acc. 229738 had better grain yield (3.08 ton ha-1, 3.07 ton
ha-1and 2.99 ton ha-1, respectively) but with high ASV
(4.91, 3.66 and 5.97, respectively) were identified as good genotypes to validate for yield performance and specific adaptability. The results of ASV further confirmed that Acc. BKFM0028 was unstable and not adaptable and that Acc. 242617 and a released variety Tadesse were consistent low yielders across locations and years. Odewale et al., 2013 reported that two out of the five coconut genotypes grown across nine
environments in southern Nigeria showed smaller ASV and thus better stability. Farshadfar (2008) noted three out of the 20 bread wheat genotypes evaluated gave smaller ASV and higher grain yield than the grand mean and thus better relative stability.
Genotype and Genotype by Environment interaction (GGE) biplot analysis
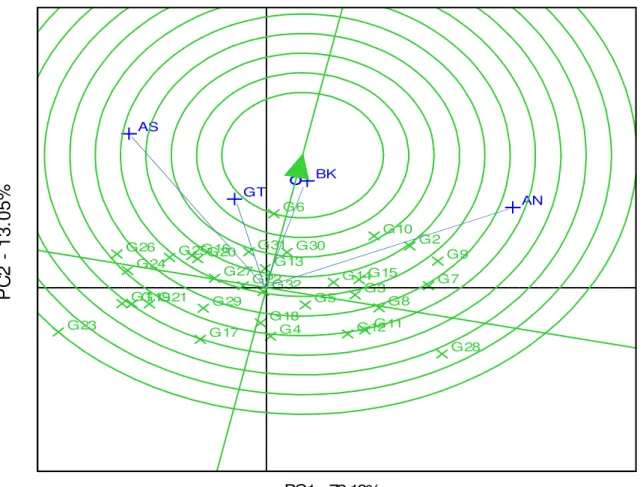
Relationship among test environments: Mean grain yield data of both years were used to assess the relationships between the different test environments and this was visualized by the line connecting each environment to the biplot origin or environment vectors (Fig 4). The cosine of the angle between two environments was used to calculate the correlation between them (Dehghani et al., 2009; Kaya et al., 2006). Environments, Bako (BK) and Gute (GT), correlated positively (acute angle), Assosa (AS) and Arsi Negele (AN) correlated negatively (obtuse angle), whereas AN and GT did not correlate (right angle). According to Yan and Tinker (2006), a strong negative correlation indicated high cross-over or GEI. Tukamuhabwa et al (2012) and Choukan (2010) reported that if two test locations correlated consistently across years, one could be dropped without significant
Dagnachew et al. J. Appl. Biosci. 2014. AMMI and GGE biplot analyses aid selection of high yielding and adapted finger millet varieties
loss of information about the genotypes. In the current study, variable environmental conditions among sites as well as within a given site from year to year resulted in inconsistent correlations between the test locations
(Fig. 3). This type of relationship was depicted by Gute and Bako, where positive correlation was observed in 2013, but negatively correlated in 2012.
G14 G17 G1 G26 G12 G27 G11 G28 G16 G29 G18 G3 G2 G30 G21 G31 G23 G32 G25 G4 G15 G5 G19 G6 G22 G7 G20 G24 G13 G8 G9 G10 GT AS AN BK
P
C
2
1
3
.0
5
%
PC1 - 73.13%Figure 4: GGE biplot based on test environments-focused comparison for their relationships Discriminating ability of the test environment and
genotype stability : The concentric circles on the biplot help to visualize the length of the environment vectors, which are proportional to the standard deviation within the respective environments and is a measure of the discriminating ability of the environments (Asnake et al., 2013). Environments and genotypes that fall in the central (concentric) circle are
environments (Yan, 2002; Asnake et al., 2013). In the present study, Bako was the most discriminating environment followed by Gute (Fig. 4). Arsi Negele and Assosa were non-discriminating and less representative sites although the former was high yielding and the latter a poor yielding environment (Fig. 3 and 4; Table 1). This implied that, varietal stability could be challenged not only due to the change in the
Dagnachew et al. J. Appl. Biosci. 2014. AMMI and GGE biplot analyses aid selection of high yielding and adapted finger millet varieties
were expected to have high mean grain yield with stable performance across all test locations. In practice, such genotypes are very rarely to be found. Therefore, high yielding and relatively stable genotypes can be considered as references for genotype evaluation (Yan and Tinker, 2006). Both environments-focused biplot and genotype-focused comparison of genotypes revealed that Acc. 203544 (G6) fell in the central circle indicating its high yield potential and relative stability compared to the rest of genotypes evaluated in this study (Figs. 4 and 5). Besides, Acc.242111 (G2) and
BKFM0051 (G10) fell close to the ideal genotype or around the center of concentric circle, suggesting their potential for specific adaptability with better grain yield performances. Among the genotypes, Acc. 203544 (G6), Acc.242111 (G2) and BKFM0051 (G10) were the top performing pipeline cultivars with 13.7%, 10.8% and 10.43%, yield advantages, respectively, over Gute (G31), and hence recommended for further verification and possible release. The GGE biplot analysis result also supported those obtained using AMMI and the Eberhart and Russell model.
G16 G24 G28 G11 G29 G13 G3 G15 G30 G17 G31 G19 G32 G20 G4 G22 G5 G10 G6 G26 G7 G12 G8 G9 G2 G1 G23 G27 G14 G18 G21 G25 GT BK AS AN PC1 - 73.13%
P
C
2
1
3
.0
5
%
Figure 5: GGE biplot based on genotype-focused scaling for comparison of genotypes for their yield potential and stability.
CONCLUSION AND RECOMMENDATION
Combined analysis of variance depicted highly significant variation for all characters between genotype, environments and GEI. GGE biplot analysis, AMMI and Eberhart and Russell model revealed that Acc. 203544 is a stable, high yielding (3.16 ton ha-1)
variety with yield advantage of 13.7% over the best
standard check, Gute (2.78 ton ha-1), thus should be
recommended for release with wider environmental adaptability in Ethiopia. Acc. 242111 (3.08 ton ha-1),
Acc. BKFM0051 (3.07 ton ha-1) and Acc.229738 (2.99
ton ha-1) were also high yielding, but inconsistent and
Dagnachew et al. J. Appl. Biosci. 2014. AMMI and GGE biplot analyses aid selection of high yielding and adapted finger millet varieties
possible release for adaptation in specific environments. With regards to the test environments, about 66.05% of GEI was explained by IPCA-I and a total of 88.33% GGE interaction by the first three IPCAs. GGE biplot based analysis on test environments-focused comparison for their consistence
revealed that, except at Bako, the test environments were inconsistent for mean grain yield and IPCA scores during 2012 and 2013. This observed instability might have been due to variation in weather conditions, soil and other uncontrolled edaphic factors.
ACKNOWLEDGEMENTS
This study was supported by the SIDA Bio-Innovate collaborative research project 01/2010. Staff members of Bako Agricultural Research Center, Asosa
Agricultural Research Center and Arsi Negele Research Sub site are acknowledged for field support.
REFERENCES
Abeya T, Chemeda D, Girma M, Dagnachew L, Negash G, 2008. Regression and Additive Main effects and Multiple Interactions (AMMI) in common bean (Phaseolus Vulgaris L.) genotypes. Ethiop. J. Biol. Sci. 7(1): 45-53
Agrobase, 2000. Agrobase TM, 71 Waterloo St.
Winnipeg, Manitoba R3NNOS4, Canada. Asnake W, Henry M, Temesgen Z, Girma T, 2013.
Additive main effects and multiplicative interactions model (AMMI) and genotype main effect and genotype by environment interaction (GGE) biplot analysis of multi-environmental wheat variety trials. African J. Agric. Res. 8(12):1033-1040.
Barbeau WE, Hilu KW, 1993. Protein, calcium, iron and amino acid content of selected wild and domesticated cultivars of Wnger millet. Plant Foods Hum Nutr. 43:97–104.
Bezaweletaw K, Sripichit P, Wongyai W, Hongtrakul V, 2006. Genetic variation, heritability and path-analysis in Ethiopian finger millet (Eleusine coracana (L.) Gaertn) landraces. Kasetsart J. Nat. Sci. 40: 322-334.
Central Statistical Authority, 2013. Agricultural sample survey. Report on the preliminary results of area, production and yield of temporary crops, (Meher season, private peasant holding), Addis Ababa.
Choukan R, 2010. Genotype, environment and
Dida M, Srinivasachary M, Ramakrishnan S, Bennetzen JL, Gale MD, Devos KM, 2007.The genetic map of finger millet, Eleusine coracana. TheorAppl Genet. 114:321–332.
Dogan R, Kacar O, Goksu E, Azkan N, 2011. Evaluation of triticale genotypes in terms of yield stability for the southern Marmara Region. Not.Bot.Horti. Agrobo. 39(2): 249-253 Eberhart SA, Russell WA, 1966. Stability parameters
for comparing varieties. Crop Sci. 6: 36–40. Farshadfar E, 2008. Incorporation of AMMI Stability
Value and Grain Yield in a Single Non-Parametric Index (Genotype Selection Index) in Bread Wheat. Pakistan J. Biol. Sci. 11: 1791-1796.
Farshadfar E, Sutka J, 2006. Biplot analysis of genotype-environment interactin in durum wheat using the AMMI model. Acta Agron. Hung. 54: 459-467.
Flores F, Moreno MT, Cubero JI, 1998. A comparison of univariate and multivariate methods to analyze G x E interaction. Field Crops Res. 56: 271–286.
Gauch HG, Zobel RW, 1996. AMMI analysis of yield trials. In: Genotype by environment interaction. pp. 85-122 (Kang, M. and Gauch, H. eds.). Boca Raton. CRC press, New York.
Girma M, Chemeda D, Abeya T, Dagnachew L, Negash G, 2011. Genotype x Environment interaction
Dagnachew et al. J. Appl. Biosci. 2014. AMMI and GGE biplot analyses aid selection of high yielding and adapted finger millet varieties
Seetheram, K.W. Rilley, G. Harinaryyana (eds.). Small Millet in Global Agriculture: Proceeding of the First International Small Millet Workshop. October 29-November 2, 1986. Bangalore, India.
Leung, W., Busson, F. &Jardin, C. (1968).Food composition table for use in Africa.FAO, Rome, Italy.Pp 306.
Misra RC, Das S, Patnaik MC, 2009. AMMI Model Analysis of Stability and Adaptability of Late Duration Finger Millet (Eleusine coracana) Genotypes. World App. Sci. J. 6 (12): 1650-1654
Mustapha AA, Showemimo FA, Aminu-kano A, 2001. Yield stability analysis of promising Triticale cultivars in Nigeria. J. Arid Agric. 11: 1–4. Naroui Rad MR, Abdul Kadir M, Rafii Hawa MY, Jaafar
Naghavi MR, Farzaneh Ahmadi, 2013. Genotype × environment interaction by AMMI and GGE biplot analysis in three consecutive generations of wheat (Triticum aestivum) under normal and drought stress conditions. Aust. J. Crop Sci. 7(7):956-961
Neves SS, 2011. Eleusine. (In Kole C. (ed.), Wild Crop Relatives: Genomic and Breeding Resources, Millets and Grasses, Springer-Verlag Berlin Heidelberg 2011
Odewale JO, Ataga CD, Agho C, Odiowaya G, Okoye
MN, Okolo EC, 2013. Genotype evaluation of
coconut (Cocos nucifera L.) and mega environment investigation based on additive main effects and multiplicative interaction (AMMI) analysis. Res.J. Agric.and Envi. Management Vol. 2(1): 001-010
Purchase JL, 1997. Parametric analysis to describe G X E interaction and stability in winter wheat. PhD thesis. Department of Agronomy, Faculty of Agriculture, University of the Orange Free State, Bloemfonten, South Africa.
Showemimo FA, Echekwu CA, Yeye MY, 2000. Genotype x environment interaction in Sorghum trials and their implication for future variety evaluation in Sorghum growing areas of northern Nigeria. The Plant Scientist 1: 24– 31.
Sial MA, Arain MA, Ahmad M, 2000. Genotype x Environment Interaction on bread wheat grown over multiple sites and years in Pakistan. Pak.J.Bot., 32(1): 85-91
Tadesse, M., Debelo, A., Gutema, Z. and Degu, E. 1995. Finger millet [Eleusine coracana (L.)
Gaertn]: A potential crop in Ethiopia, pp.124- 132. In: Proceeding of Workshop Organized to Re-establish Sorghum and Millet in Eastern and Central Africa. 6-9 November 1995. Kampala, Uganda
Tukamuhabwa P, Asiimwe M, Nabasirye M, Kabayl P, Maphosa M, 2012. Genotype by environment interaction of advanced generation soybean lines for grain yield in Uganda. Africa. Crop Sci. J. 20(2):107-115.
Wonde Abera, Labuschagne M, 2005. Stability analysis of Ethiopian maize varieties using AMMI model. Ethio. J. Agric. Sci. 18(2):173-180 Yan W, Hunt LA, Sheng Q, Szlavnics Z, 2000. Cultivar
evaluation and mega-environment investigation based on the GGE biplot. Crop. Sci. 40: 597-605.
Yan W, Rajcan I, 2002. Biplots analysis of the test sites and trait relations of soybean in Ontario. Crop. Sci. 42:11-20.
Yan W, Tinker NA, 2006. Biplot analysis of multi-environment trial data: principles and application. Canadian J. Plant Sci. 86:623-645 Yuksel Kaya, Cetin Palta, Seyfi Taner, 2002. Additive Main Effects and Multiplicative Interactions Analysis of Yield Performances in Bread Wheat Genotypes across Environments. Turk J Agric For. 26: 275-279