HAL Id: hal-02735278
https://hal.archives-ouvertes.fr/hal-02735278
Preprint submitted on 2 Jun 2020
HAL is a multi-disciplinary open access
archive for the deposit and dissemination of sci-entific research documents, whether they are pub-lished or not. The documents may come from teaching and research institutions in France or
L’archive ouverte pluridisciplinaire HAL, est destinée au dépôt et à la diffusion de documents scientifiques de niveau recherche, publiés ou non, émanant des établissements d’enseignement et de recherche français ou étrangers, des laboratoires
It Takes Two to Tango Income and Payroll Taxes in
Progressive Tax Systems
Victor Amoureux, Elvire Guillaud, Michaël Zemmour
To cite this version:
Victor Amoureux, Elvire Guillaud, Michaël Zemmour. It Takes Two to Tango Income and Payroll Taxes in Progressive Tax Systems: LIS working papers series - No. 779. 2019. �hal-02735278�
LIS
Working Paper Series
Luxembourg Income Study (LIS), asbl
No. 779
It Takes Two to Tango
Income and Payroll Taxes in Progressive Tax Systems
Victor Amoureux, Elvire Guillaud, Michaël Zemmour
October 2019
It Takes Two to Tango
Income and payroll taxes in progressive tax systems
Victor Amoureux
∗Elvire Guillaud
†Micha¨
el Zemmour
‡October 22, 2019
Abstract
The literature on tax systems generally considers each type of tax in a self-contained way, with its own distributive characteristics. While the income tax is considered as a progressive tax, social insurance contributions are seen as being re-gressive, namely because of ceilings. Using a database of comparative micro-data at the household level (LIS data, 22 OECD countries, 1999-2016 period), supplemented with OECD data on employer contributions, we measure effective tax rates over the entire income distribution. Our results jeopardize the conventional economic wisdom on the role of income and payroll taxes in tax progressivity, and on their respective impact on inequality reduction. We show that, in all countries of our sample, the progressivity of income tax increases as soon as the progressivity of social insurance contributions decreases. This implies that income and payroll tax schedules are not independent. Even more, they act in a complementary way. While payroll tax heavily compress inequalities at the bottom of the income distribution, income tax reduces inequalities at the top.
Keywords: income tax; social insurance contributions; inequality reduction; progressivity. JEL codes: D31; H30; I38.
∗INSEE, [email protected].
†University Paris 1 Panth´eon-Sorbonne, CES, and Sciences Po, LIEPP, [email protected]. ‡University Paris 1 Panth´eon-Sorbonne, CES, and Sciences Po, LIEPP,
1
Introduction
In general, the literature on tax systems considers each type of tax in a self-contained way, with its own distributive characteristics. Broadly speaking, the income tax is considered as a progressive tax, while social insurance contributions are seen as being regressive, namely because of ceilings which apply to the taxable wages. Scholars often classify countries as more or less progressive according to the relative weight that governments assign to payroll and income taxes.
The renewal of the literature on redistribution, following the multiplication of empirical data (Atkinson, 2004; Piketty, 2013; Sutherland and Figari, 2013), has produced analyses going a step further in international comparison. Rather than comparing tax scales or tax mixes, researchers can now measure effective tax rates over the entire income distribution. Effective tax rates are computed by recovering data on actual tax payments and income.
In this article, we look at the equalizing effect of taxes that directly affect the amount of resources available to households: personal income tax (PIT) and social insurance contribu-tions (SIC). Although there is an extensive literature on personal income tax progressivity (see, for example, Wagstaff et al., 1999), international comparative studies on the joint impact of PIT and SIC are rather scarce. Among recent papers, Verbist and Figari (2014) examine the overall redistributive effect of income taxes, including SIC, for 15 EU-countries. As the authors point out, the distinction between PIT and SIC has become increasingly blurred, justifying the inclusion of both types of taxes in the analysis of tax redistribution (Verbist and Figari,2014, p.8). Historically, SIC and PIT have been created to serve differ-ent purposes. Personal income tax was levied to finance the governmdiffer-ent budget over a fixed period (one year) and to redistribute between different income groups. Social contributions were closely tied to the social insurance system and therefore aimed at redistributing in-come over the entire life cycle. However, successive reforms of social security systems in
OECD countries, particularly in the 1990s, have increased the weight of personal income tax in the financing of social protection. At the same time, governments have gradually transformed social insurance contributions, so that they now take on the suit of income tax (Koreh and Zemmour 2019). From a policy point of view, it is therefore more interesting to investigate the redistributive role of direct taxes as a whole.
This is what we are doing in this article, using household survey data from the Luxem-bourg Income Study (LIS) after imputing missing payroll tax data for 22 OECD countries over the 1999-2016 period (this dataset has first being explored by Guillaud et al.,2019a). Our results jeopardize the conventional economic wisdom on the role of income and payroll taxes in tax progressivity, and on their respective impact on inequality reduction.
We show that, in all countries of our sample, the progressivity of income tax increases as soon as the progressivity of social insurance contributions decreases. This implies that income and payroll tax schedules are not independent. While payroll tax heavily acts as an income gap reducer at the bottom of the income distribution, income tax reduces inequalities at the top. In sum, income tax and social insurance contributions act in a complementary, rather than opposite, way: it takes two to tango, or to reduce income gaps through taxation.
2
Data
2.1
The Luxembourg Income Study dataset
We use micro data from the Luxembourg Income Study (LIS), a database on income received and taxes paid by households, collected at the national level for most OECD countries. These data mainly come from survey data and, for some countries, administrative data. It is harmonised ex post by the LIS team. Our sample includes 90 observations, covering 22
OECD countries over the period 1999-2016.
The LIS data is relatively close in spirit to EU-SILC data, which is an alternative dataset covering European countries, sometimes run by scholars in combination with the EUROMOD microsimulation model. For many European countries, the same survey is used to compile LIS and EU-SILC data (Marx et al., 2013).1 Given the importance of
non-European countries in welfare state analyses (United States, Canada, Australia in particular), we have chosen to use LIS data. In addition, LIS data has gradually become a baseline for comparative redistribution studies, demonstrating its quality (see Prasad and Deng, 2009; Kenworthy, 2011; Immervoll and Richardson, 2011; Brady and Bostic, 2015;
Caminada et al.,2017, for instance).
2.2
The imputation of social insurance contributions
We complete the data by imputing missing taxes: employee social contributions are missing for some country-years (France in particular), while employer social contributions are miss-ing for all country-years. Imputations have been constructed in a previous work (Guillaud et al., 2019a,b).2 These data on payroll taxes are simulated at the individual level,
apply-ing the statutory rates provided by the OECD Taxapply-ing Wages series to individual labour income.3
Implicitely, we assume the incidence of all payroll taxes to fall on the employee (see
1While the LIS data is harmonised ex post, the EU-SILC data is constructed from an ex ante harmonised
methodological framework. For example, the treatment of tax credits is not harmonized in LIS: for some countries (United Kingdom, United States) tax credits are considered as transfers; in other countries (France), they are considered as negative taxes but seem insufficiently documented (e.g. Prime Pour l’Emploi). These differences, in our opinion, marginally limit the scope of our results.
2Our data and the code to produce it are available at
https://www.redineq.com.
3Imputations for France are based on the more up-to-date schedules of the Institut des Politiques
Publiques (IPP). It has the advantage of including information on CSG and CRDS, a flat tax levied on labour and capital income, and social-insurance benefits. The tax revenue from CSG and CRDS is greater than that from income tax. The CSG/CRDS is imputed as follows: the part weighing on wages is considered as a social contribution, as the other proportional taxes; while the part levied on replacement and capital incomes is considered as an income tax, since it is not based on labour income.
Gruber, 1994, 1997; Anderson and Meyer, 1997, 2000; Murphy, 2007, for a survey). This assumption has also been made, for instance, by Immervoll et al. (2006) on international series, or Bozio et al. (2014) in their analysis of the French tax-benefit system.
By including employer’s contributions into the analysis, we follow the recommendation provided by the Canberra Group’s Handbook on Household Income Statistics (Canberra,
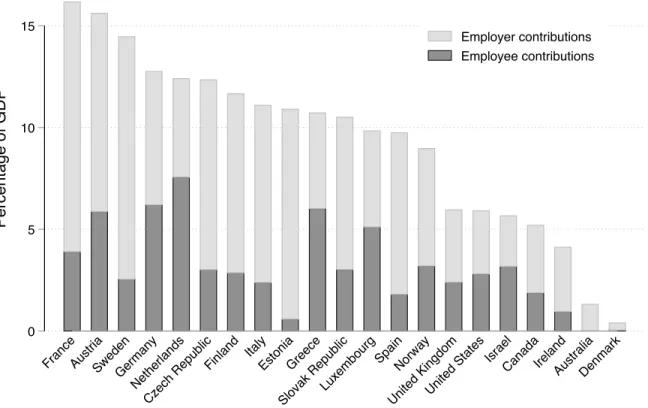
2001). As shown in Figure1, the split between employer and employee social contributions greatly varies from one country to another. While Sweden mostly relies on employer con-tribution (9.8% of GDP in 2005, versus 2.5% for employee concon-tributions), the Netherlands rely more on employee contributions (7.6% of GDP in 2013, versus 4.8% for employer con-tributions). Other countries, such as Germany, have an equal split between both (6.5% for employer contributions, and 6.2% for employee, in 2015).4
The imputation of missing social insurance contributions significantly increases the tax coverage of the dataset: after imputation, we cover up to 65% of national tax revenue (with a median at 55%), as opposed to 35% in the original LIS data. The remaining tax revenue is mainly due to consumption and corporate taxes.
2.3
The measurement of tax redistribution
Distributional analyses usually distinguish between several income levels: market income (labour and capital), gross income (including pensions and transfers) and disposable income (after contributions and taxes). Since our analysis concerns solely taxes, we rely on gross income (or super-gross as it is commonly understood), before any contributions and taxes, but after transfers. Many countries tax transfers and replacement incomes, which justifies
4We follow the OECD conventions to establish the scope of social insurance contributions: in particular,
we have excluded ”Non-tax Compulsory Payments” (NTCP). Among the NTCP, health insurance contri-butions (in the Netherlands for example) or pension contricontri-butions (in Switzerland) are the most frequent. The OECD excludes these contributions from the scope of social contributions because of the payment to a private fund, even when the private fund has an insurance obligation.
0 5 10 15 Pe rce n ta g e o f G D P FranceAust ria Swed en Germa ny Net herla nds Cze ch R epub lic
Finland ItalyEston ia Gre ece Slova k Rep ublic Luxe mbou rg Spai n Norw ay Unite d Ki ngdo m Unite d St atesIsrael CanadaIre land Aust ralia Den mark Employer contributions Employee contributions
Figure 1: The split between employer and employee social insurance contributions. Note: We omit Iceland from this graph because the OECD macro data does not separate Iceland’s social insurance contributions (3.9% of GDP in 2010) into employer and employee contributions. Social contributions of self-employed and others are not deferred. Reading: In Germany, employer contributions represented 6.5% of GDP in the reference year (2015) and employee contributions 6.2%. Source: Revenue Statistics, OECD.
including them in the base from which we compare the different taxes.
We conduct the analysis on the entire population, including pensioners in the sample. Our tax income therefore includes pension-related social contributions both in the pre-tax income of workers (in the form of social contributions) and in the income of pensioners (in the form of pensions). Although this involves a double counting issue, it is consistent with the microeconomic perception of households: before tax, working households earn a super gross salary, while pensioners receive their pensions. Another solution would have
been to remove pension-related social contributions from workers’ pre-tax income. This is done, for example, in the DINA methodology (Garbinti et al.,2018). But such an approach artificially reduces the redistributive role of social contributions - especially at the bottom of income distribution. Alternatively, we reproduce our analysis on a reduced sample that only includes households under the age of 60, as a robustness test (see AppendixC).
We divide the population of each country-year in the sample into 100 equal shares (percentiles).5 Within each percentile, we measure the average income received, and the contributions and taxes paid, in order to compute average payroll and income taxes.6 We do not address the issue of taxation of the very rich (the top percentile). Indeed, this debate requires specific data on high income and corporate taxes, as well as specific assumptions on how to allocate capital gains, retained earnings of corporations and the incidence of corporate taxes. The interested reader may refer to Piketty et al. (2017).
We calculate the contributions of payroll and income taxes to overall tax progressivity, and to inequality reduction. To do so, we use the logical order in which the different taxes are paid: payroll tax first, then income tax. The additivity of payroll/income tax contri-butions is obtained by measuring the difference between indicators, which are computed over different concepts of income. For example, the amount of Gini reduction that can be attributed to payroll tax is measured by the difference between the Gini before and after payroll tax. The impact of income tax on inequality reduction is measured by the difference between the Gini after payroll tax but before income tax, and the Gini after payroll and income taxes.
5A percentile usually indicates a threshold value between two hundredths. For the sake of simplicity,
percentiles here refer to hundredths of the population.
6We exclude the first and last percentile, whose averages are derived by extreme values. Within
per-centiles, effective tax rates are smoothed by weighted moving average using three lagged terms, three forward terms, and including the current observation in the filter.
3
Results
3.1
Are social insurance contributions truly regressive?
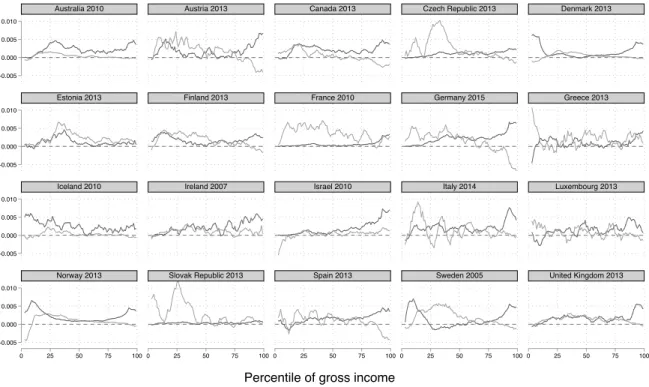
In many countries, the average effective contribution rate increases over most of the income scale, making it progressive, before decreasing after a certain threshold. This bell shape in payroll taxes is generally interpreted as a symbol of the regression of social insurance contributions: the average tax rate decreases for the highest income groups (see for instance
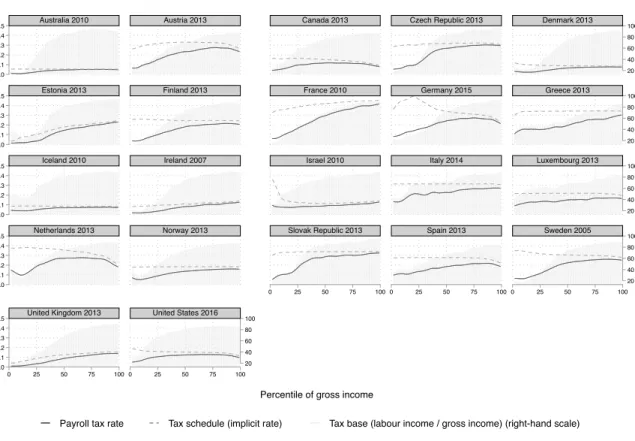
Landais et al., 2011). Yet, international comparison reveals several caveats to this thesis. Figure 2 reproduces the effective rates of income and payroll taxes by percentile of gross income. The graph displays, for each country-year, the percentile for which the social insurance contribution rate is at its maximum (vertical bars).7
First, some countries (France-2010, Estonia-2013, Greece-2013, Slovakia-2013 and Ireland-2007) have a fully progressive effective rate schedule.8 Second, even in countries where
contributions become regressive after a certain threshold, the maximum rate is generally reached late in the income scale. For all countries, except Canada-2013, the United States-2016 and the Netherlands-2013, the maximum contribution rate is reached beyond the 75th percentile of gross income. Over the entire sample (90 country-year), half of the observa-tions (1 per country-year) reaches the maximum contribution rate above the 84th percentile, and a quarter reaches it above the 91st percentile.
The inclusion of employer social contributions is important to capture the progressivity of social contributions, as shown in Figure A1 in the appendix. For France-2010 or the United Kingdom-2013, for example, employee contributions do have a bell-shaped form, but employer contributions are generally progressive, resulting in an overall progressivity
7Unless otherwise stated, all graphs have the same source: LIS data and authors’ calculations.
8It might be that, for these countries, contributions are regressive within the last percentile. Analysis at
the household percentile level (and the smoothing of effective tax rates) blurs these effects here, particularly because of the composition of households.
0.0 0.1 0.2 0.3 0.4 0.0 0.1 0.2 0.3 0.4 0.0 0.1 0.2 0.3 0.4 0.0 0.1 0.2 0.3 0.4 0.0 0.1 0.2 0.3 0.4 0 25 50 75 100 0 25 50 75 100 0 25 50 75 100 0 25 50 75 100 0 25 50 75 100
Australia 2010 Austria 2013 Canada 2013 Czech Republic 2013 Denmark 2013
Estonia 2013 Finland 2013 France 2010 Germany 2015 Greece 2013
Iceland 2010 Ireland 2007 Israel 2010 Italy 2014 Luxembourg 2013
Netherlands 2013 Norway 2013 Slovak Republic 2013 Spain 2013 Sweden 2005
United Kingdom 2013 United States 2016
Payroll tax Income tax Percentiles of gross income
Figure 2: Effective rates of income and payroll taxes by percentile of gross income. Note: We display the most recent year for each country, which is between 2010 and 2016 with two exceptions. For Ireland, we use the pre-crisis year of 2007, and the most recent year for Sweden is 2005. More details on the data is available at https://www.lisdatacenter.org/our-data/ lis-database/. The vertical bars represent, for each country-year, the percentile for which the social insurance contribution rate is at its maximum. Reading: In Germany, the maximum social insurance contribution rate is reached at the 75th percentile of gross income in 2015. The effective payroll tax rate for this percentile is 27.3% and the effective income tax rate is 12.2%.
of the contribution rate. Countries where employee social contributions show a marked progressivity are more rare, and generally go along with a progressivity of employer social contributions (Greece, Norway, Slovakia, for instance).
3.2
Sources of progressivity for social insurance contributions
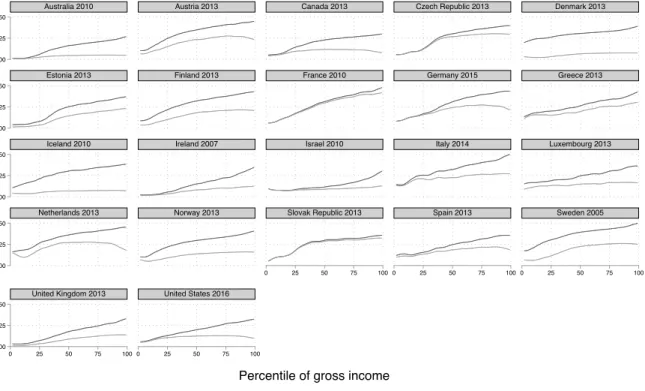
The progressivity of a tax can be decomposed into a base and a schedule effect. The effective rate of payroll tax is obtained by multiplying the payroll tax schedule and its tax base. The tax schedule refers to the implicit rate of contributions applied (after taking into account any reductions/discounts). It is calculated as the ratio of paid contributions to labour income at the household level. The tax base for payroll taxes is almost exclusively the labour income (which we express as a share of gross income). The effective payroll tax rate is expressed in relation to gross income.
As shown in Figure 3, countries such as Estonia, France, or the United Kingdom have a progressive schedule of social insurance contributions over the entire income distribution. Yet, in most countries the schedule is regressive. The observed progressivity in the effective rates of payroll tax is therefore due to the tax base, by a composition effect. Indeed, transfers weigh heavily on the gross income of households at the bottom of the distribution, while they are not subject to social contributions.9 At the very top of the distribution, it is
both the capping of rates and the relative importance of capital income that explains the regressive nature of the effective contributions (see Finland, Italy, or Norway, for instance).
3.3
The complementarity of social contributions and income tax
In all countries of our sample, the progressivity of income tax increases as soon as the progressivity of social insurance contributions decreases, thus promoting the progressivity of the tax system as a whole. This implies that income and payroll tax schedules are not independent.
Figure 4 shows the slopes in the effective rates of income tax and social insurance
9Even when transfers are subject to contributions, they do not enter into the employer contribution
0.0 0.1 0.2 0.3 0.4 0.5 0.0 0.1 0.2 0.3 0.4 0.5 0.0 0.1 0.2 0.3 0.4 0.5 0.0 0.1 0.2 0.3 0.4 0.5 0.0 0.1 0.2 0.3 0.4 0.5 20 40 60 80 100 20 40 60 80 100 20 40 60 80 100 20 40 60 80 100 20 40 60 80 100 0 25 50 75 100 0 25 50 75 100 0 25 50 75 100 0 25 50 75 100 0 25 50 75 100
Australia 2010 Austria 2013 Canada 2013 Czech Republic 2013 Denmark 2013
Estonia 2013 Finland 2013 France 2010 Germany 2015 Greece 2013
Iceland 2010 Ireland 2007 Israel 2010 Italy 2014 Luxembourg 2013
Netherlands 2013 Norway 2013 Slovak Republic 2013 Spain 2013 Sweden 2005
United Kingdom 2013 United States 2016
Payroll tax rate Tax schedule (implicit rate) Tax base (labour income / gross income) (right-hand scale) Percentile of gross income
Figure 3: The role of tax schedule and tax base in effective rates of payroll tax. Note: Effective tax rate = Tax schedule * Tax base. The tax schedule refers to the implicit rate of contributions applied (after taking into account any reductions/discounts). The tax base for payroll taxes is the labour income (which we express as a share of gross income). The effective payroll tax rate is expressed in relation to gross income. Reading: In Sweden, labour income averages 35.9% of gross income at the 25th percentile (right-hand scale). The implicit rate of contributions applied is 31.8% (left-hand scale). As a result, the effective rate is 11.4% (left-hand scale).
contributions in two typical cases: the Netherlands-2013 and the United States-2016.10 In
both countries, the crossing of the curves is marked. In the Netherlands, when contributions become less progressive (at the 25th percentile) and then straightforwardly regressive (at the 68th percentile), the income tax rate becomes progressive and continues to rise to the top of the distribution. In the United States, income taxes increase generally steadily
10The slope of the tax rate (first difference in rates) is not the marginal tax rate, which is calculated on
with income, before accelerating significantly when social insurance contributions become regressive (at the 77th percentile).
-0.010 -0.005 0.000 0.005 0.010 0 25 50 75 100 0 25 50 75 100
Netherlands United States
Slope of income tax rate Slope of payroll tax rate Percentile of gross income
Figure 4: Slopes of income and payroll tax rates, Netherlands and USA.
Note: Netherlands, year 2013; the United States, year 2016. The curves represent the slopes (first difference between two consecutive percentiles) of the effective tax rates (income tax or contributions). They measure a local progressivity of sampling: if the difference is positive, the n percentile has a higher rate than the n-1 percentile and the tax is locally progressive. Conversely, if the difference is negative, the tax is locally regressive. Reading: In the United States, households at the 50th percentile owe an income tax which is 0.0021 percentage points higher than for the 49th percentile, and a payroll tax rate which is 0.00056 percentage points higher than for the 49th percentile.
This mirror-like variation in contribution and income tax rates is observed in many countries (Figure B1 in Appendix B). Since both taxes are measured relative to the same base (gross income), the mirror image we see on these graphs is not likely to result from
compositional effects.11
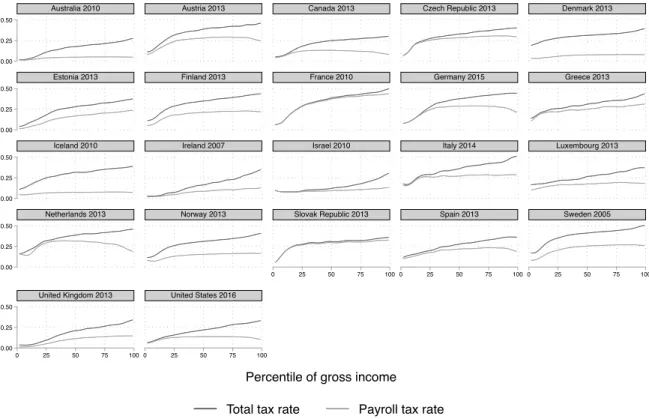
Figure 5 shows the overall progressivity resulting from the combination of income tax and payroll tax. Importantly, overall progressivity seems to follow a steady path, regardless of the contribution profile. Contributions clearly support progressivity on the first segment of income distribution, the extent of which varies from one country to another, before income tax takes over to ensure the progressivity of taxes as a whole. In all countries, the characteristics (in this case progressivity) adopted by income tax and social insurance contributions seem to be defined jointly, or at least relatively to each other.12 This holds even if we restrict the sample to individuals below the age of 60.13
11There are many tax feedback effects, particularly when social insurance contributions are deductible
from the income tax base (as in France). However, this effect is generally minor and does not explain the variation in rates when they are measured not according to the base of each tax but according to gross income as a whole.
12We observe a −35% correlation between the slope of the income tax and the slope of the payroll tax,
see FigureB2in the Appendix.
13By using this restricted sample, we get rid of double counting issues regarding pension-related
contri-butions and the payment of public pensions. As shown in Appendix C, the level of the effective rate of payroll tax is slightly increased in the first segment of income distribution, from the 10th percentile to the median income. This is due to a visible change in the composition of the tax base within the bottom deciles: by excluding pensions, the share of labour income over gross income is raised among poor households, but the first decile.
0.00 0.25 0.50 0.00 0.25 0.50 0.00 0.25 0.50 0.00 0.25 0.50 0.00 0.25 0.50 0 25 50 75 100 0 25 50 75 100 0 25 50 75 100 0 25 50 75 100 0 25 50 75 100
Australia 2010 Austria 2013 Canada 2013 Czech Republic 2013 Denmark 2013
Estonia 2013 Finland 2013 France 2010 Germany 2015 Greece 2013
Iceland 2010 Ireland 2007 Israel 2010 Italy 2014 Luxembourg 2013
Netherlands 2013 Norway 2013 Slovak Republic 2013 Spain 2013 Sweden 2005
United Kingdom 2013 United States 2016
Total tax rate Payroll tax rate Percentile of gross income
Figure 5: Total tax and social insurance contribution rates by percentile of gross income. Reading: In Germany, the effective social insurance contribution rate for the 50th percentile is 24.2% in 2015. The total effective tax rate (contributions + PIT) is 30.1%.
3.4
Consequences on inequality reduction
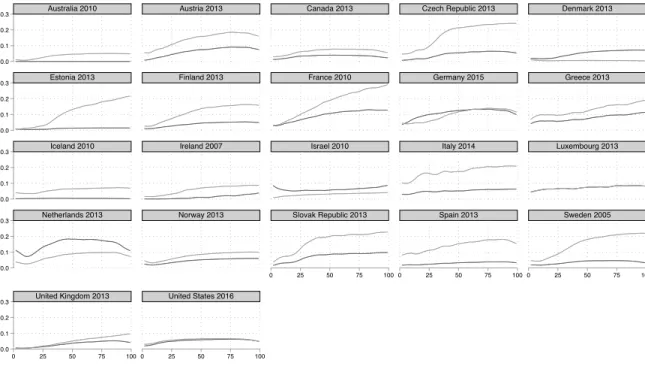
The complementarity between payroll and income taxes to promote a progressive tax system has straightforward consequences on inequality reduction. We measure the redistributive impact of both taxes using inter-quantile ratios of household income. Figure 6 shows the inequality reduction due to payroll and income tax, at the lower- and upper-half of the distribution (D5 over D1, and D9 over D5, respectively).14
Far from having antagonistic distributional effects, social contributions and income tax appear as complementary tools to achieve inequality reduction. In the lower half of the income distribution, the role of contributions is fundamental (left-hand chart). The D5/D1 ratio, which indicates the relative importance of the gross income held by the fifth (median) decile compared to that of the first decile, is much more reduced by social contributions than by income taxes, in most countries. In the upper half of the distribution (right-hand chart), income tax weighs more heavily on inequality reduction (D9/D5 ratio) than social contributions in almost all countries (except Estonia, France and Slovakia).
One can also compute the relative contribution of each type of tax, measured by the reduction in the Gini index before and after each tax is collected. Results are presented in Appendix D. The composition of the tax system (a larger proportion of income tax or social contributions) appears to be of little importance to explain the level of redistribution achieved overall. Many countries with different redistribution methods achieve comparable levels of redistribution.
14The first decile (D1) is the value that separates the richest 90% from the remaining 10% and the ninth
decile (D9) is the value that separates the richest 10% from the remaining 90%. The median (D5) is the value that separates the richest 50% from the poorest 50%.
at at at at at at at at at at at at at at at at at at at at at at at at at at at at at at at at at at at at at at at at at at at at at at at at at at at at at at at at at at at at at at at at at at at at at at at at at at at at at at at at at at at at at at at at at at at at at at at at at at au au au au au au au au au au au au au au au au au au au au au au au au au au au au au au au au au au au au au au au au au au au au au au au au au au au au au au au au au au au au au au au au au au au au au au au au au au au au au au au au au au au au au au au au au au au au au au au au au au ca ca ca ca ca ca ca ca ca ca ca ca ca ca ca ca ca ca ca ca ca ca ca ca ca ca ca ca ca ca ca ca ca ca ca ca ca ca ca ca ca ca ca ca ca ca ca ca ca ca ca ca ca ca ca ca ca ca ca ca ca ca ca ca ca ca ca ca ca ca ca ca ca ca ca ca ca ca ca ca ca ca ca ca ca ca ca ca ca ca ca ca ca ca ca ca ca ca cz cz cz cz cz cz cz cz cz cz cz cz cz cz cz cz cz cz cz cz cz cz cz cz cz cz cz cz cz cz cz cz cz cz cz cz cz cz cz cz cz cz cz cz cz cz cz cz cz cz cz cz cz cz cz cz cz cz cz cz cz cz cz cz cz cz cz cz cz cz cz cz cz cz cz cz cz cz cz cz cz cz cz cz cz cz cz cz cz cz cz cz cz cz cz cz cz cz de de de de de de de de de de de de de de de de de de de de de de de de de de de de de de de de de de de de de de de de de de de de de de de de de de de de de de de de de de de de de de de de de de de de de de de de de de de de de de de de de de de de de de de de de de de de de de de de de de dk dk dk dk dk dk dk dk dk dk dk dk dk dk dk dk dk dk dk dk dk dk dk dk dk dk dk dk dk dk dk dk dk dk dk dk dk dk dk dk dk dk dk dk dk dk dk dk dk dk dk dk dk dk dk dk dk dk dk dk dk dk dk dk dk dk dk dk dk dk dk dk dk dk dk dk dk dk dk dk dk dk dk dk dk dk dk dk dk dk dk dk dk dk dk dk dk dk ee ee ee ee ee ee ee ee ee ee ee ee ee ee ee ee ee ee ee ee ee ee ee ee ee ee ee ee ee ee ee ee ee ee ee ee ee ee ee ee ee ee ee ee ee ee ee ee ee ee ee ee ee ee ee ee ee ee ee ee ee ee ee ee ee ee ee ee ee ee ee ee ee ee ee ee ee ee ee ee ee ee ee ee ee ee ee ee ee ee ee ee ee ee ee ee ee ee es es es es es es es es es es es es es es es es es es es es es es es es es es es es es es es es es es es es es es es es es es es es es es es es es es es es es es es es es es es es es es es es es es es es es es es es es es es es es es es es es es es es es es es es es es es es es es es es es es fifififififififififififififififififififififififififififififififififififififififififififififififififififififififififififififififififififififififififififififififififififififififififififififififififi fr fr fr fr fr fr fr fr fr fr fr fr fr fr fr fr fr fr fr fr fr fr fr fr fr fr fr fr fr fr fr fr fr fr fr fr fr fr fr fr fr fr fr fr fr fr fr fr fr fr fr fr fr fr fr fr fr fr fr fr fr fr fr fr fr fr fr fr fr fr fr fr fr fr fr fr fr fr fr fr fr fr fr fr fr fr fr fr fr fr fr fr fr fr fr fr fr fr gr gr gr gr gr gr gr gr gr gr gr gr gr gr gr gr gr gr gr gr gr gr gr gr gr gr gr gr gr gr gr gr gr gr gr gr gr gr gr gr gr gr gr gr gr gr gr gr gr gr gr gr gr gr gr gr gr gr gr gr gr gr gr gr gr gr gr gr gr gr gr gr gr gr gr gr gr gr gr gr gr gr gr gr gr gr gr gr gr gr gr gr gr gr gr gr gr gr ie ie ie ie ie ie ie ie ie ie ie ie ie ie ie ie ie ie ie ie ie ie ie ie ie ie ie ie ie ie ie ie ie ie ie ie ie ie ie ie ie ie ie ie ie ie ie ie ie ie ie ie ie ie ie ie ie ie ie ie ie ie ie ie ie ie ie ie ie ie ie ie ie ie ie ie ie ie ie ie ie ie ie ie ie ie ie ie ie ie ie ie ie ie ie ie ie ie ilililililililililililililililililililililililililililililililililililililililililililililililililililililililililililililililililililililililililililililililililililililililililililililililililil isisisisisisisisisisisisisisisisisisisisisisisisisisisisisisisisisisisisisisisisisisisisisisisisisisisisisisisisisisisisisisisisisisisisisisisisisisisisisisisisisisisisisisisisisisisisisisisisisis it it it it it it it it it it it it it it it it it it it it it it it it it it it it it it it it it it it it it it it it it it it it it it it it it it it it it it it it it it it it it it it it it it it it it it it it it it it it it it it it it it it it it it it it it it it it it it it it it it lu lu lu lu lu lu lu lu lu lu lu lu lu lu lu lu lu lu lu lu lu lu lu lu lu lu lu lu lu lu lu lu lu lu lu lu lu lu lu lu lu lu lu lu lu lu lu lu lu lu lu lu lu lu lu lu lu lu lu lu lu lu lu lu lu lu lu lu lu lu lu lu lu lu lu lu lu lu lu lu lu lu lu lu lu lu lu lu lu lu lu lu lu lu lu lu lu lu nl nl nl nl nl nl nl nl nl nl nl nl nl nl nl nl nl nl nl nl nl nl nl nl nl nl nl nl nl nl nl nl nl nl nl nl nl nl nl nl nl nl nl nl nl nl nl nl nl nl nl nl nl nl nl nl nl nl nl nl nl nl nl nl nl nl nl nl nl nl nl nl nl nl nl nl nl nl nl nl nl nl nl nl nl nl nl nl nl nl nl nl nl nl nl nl nl nl no no no no no no no no no no no no no no no no no no no no no no no no no no no no no no no no no no no no no no no no no no no no no no no no no no no no no no no no no no no no no no no no no no no no no no no no no no no no no no no no no no no no no no no no no no no no no no no no no no se se se se se se se se se se se se se se se se se se se se se se se se se se se se se se se se se se se se se se se se se se se se se se se se se se se se se se se se se se se se se se se se se se se se se se se se se se se se se se se se se se se se se se se se se se se se se se se se se se sk sk sk sk sk sk sk sk sk sk sk sk sk sk sk sk sk sk sk sk sk sk sk sk sk sk sk sk sk sk sk sk sk sk sk sk sk sk sk sk sk sk sk sk sk sk sk sk sk sk sk sk sk sk sk sk sk sk sk sk sk sk sk sk sk sk sk sk sk sk sk sk sk sk sk sk sk sk sk sk sk sk sk sk sk sk sk sk sk sk sk sk sk sk sk sk sk sk uk uk uk uk uk uk uk uk uk uk uk uk uk uk uk uk uk uk uk uk uk uk uk uk uk uk uk uk uk uk uk uk uk uk uk uk uk uk uk uk uk uk uk uk uk uk uk uk uk uk uk uk uk uk uk uk uk uk uk uk uk uk uk uk uk uk uk uk uk uk uk uk uk uk uk uk uk uk uk uk uk uk uk uk uk uk uk uk uk uk uk uk uk uk uk uk uk uk us us us us us us us us us us us us us us us us us us us us us us us us us us us us us us us us us us us us us us us us us us us us us us us us us us us us us us us us us us us us us us us us us us us us us us us us us us us us us us us us us us us us us us us us us us us us us us us us us us -.2 0 .2 .4 .6 In e q u a lit y re d u ct io n d u e t o p a yro ll ta x -.2 0 .2 .4 .6
Inequality reduction due to income tax Inequality reduction at the lower-half (D5/D1)
at at at at at at at at at at at at at at at at at at at at at at at at at at at at at at at at at at at at at at at at at at at at at at at at at at at at at at at at at at at at at at at at at at at at at at at at at at at at at at at at at at at at at at at at at at at at at at at at at at au au au au au au au au au au au au au au au au au au au au au au au au au au au au au au au au au au au au au au au au au au au au au au au au au au au au au au au au au au au au au au au au au au au au au au au au au au au au au au au au au au au au au au au au au au au au au au au au au au ca ca ca ca ca ca ca ca ca ca ca ca ca ca ca ca ca ca ca ca ca ca ca ca ca ca ca ca ca ca ca ca ca ca ca ca ca ca ca ca ca ca ca ca ca ca ca ca ca ca ca ca ca ca ca ca ca ca ca ca ca ca ca ca ca ca ca ca ca ca ca ca ca ca ca ca ca ca ca ca ca ca ca ca ca ca ca ca ca ca ca ca ca ca ca ca ca ca cz cz cz cz cz cz cz cz cz cz cz cz cz cz cz cz cz cz cz cz cz cz cz cz cz cz cz cz cz cz cz cz cz cz cz cz cz cz cz cz cz cz cz cz cz cz cz cz cz cz cz cz cz cz cz cz cz cz cz cz cz cz cz cz cz cz cz cz cz cz cz cz cz cz cz cz cz cz cz cz cz cz cz cz cz cz cz cz cz cz cz cz cz cz cz cz cz cz de de de de de de de de de de de de de de de de de de de de de de de de de de de de de de de de de de de de de de de de de de de de de de de de de de de de de de de de de de de de de de de de de de de de de de de de de de de de de de de de de de de de de de de de de de de de de de de de de de dk dk dk dk dk dk dk dk dk dk dk dk dk dk dk dk dk dk dk dk dk dk dk dk dk dk dk dk dk dk dk dk dk dk dk dk dk dk dk dk dk dk dk dk dk dk dk dk dk dk dk dk dk dk dk dk dk dk dk dk dk dk dk dk dk dk dk dk dk dk dk dk dk dk dk dk dk dk dk dk dk dk dk dk dk dk dk dk dk dk dk dk dk dk dk dk dk dk ee ee ee ee ee ee ee ee ee ee ee ee ee ee ee ee ee ee ee ee ee ee ee ee ee ee ee ee ee ee ee ee ee ee ee ee ee ee ee ee ee ee ee ee ee ee ee ee ee ee ee ee ee ee ee ee ee ee ee ee ee ee ee ee ee ee ee ee ee ee ee ee ee ee ee ee ee ee ee ee ee ee ee ee ee ee ee ee ee ee ee ee ee ee ee ee ee ee es es es es es es es es es es es es es es es es es es es es es es es es es es es es es es es es es es es es es es es es es es es es es es es es es es es es es es es es es es es es es es es es es es es es es es es es es es es es es es es es es es es es es es es es es es es es es es es es es es fifififififififififififififififififififififififififififififififififififififififififififififififififififififififififififififififififififififififififififififififififififififififififififififififififi fr fr fr fr fr fr fr fr fr fr fr fr fr fr fr fr fr fr fr fr fr fr fr fr fr fr fr fr fr fr fr fr fr fr fr fr fr fr fr fr fr fr fr fr fr fr fr fr fr fr fr fr fr fr fr fr fr fr fr fr fr fr fr fr fr fr fr fr fr fr fr fr fr fr fr fr fr fr fr fr fr fr fr fr fr fr fr fr fr fr fr fr fr fr fr fr fr fr gr gr gr gr gr gr gr gr gr gr gr gr gr gr gr gr gr gr gr gr gr gr gr gr gr gr gr gr gr gr gr gr gr gr gr gr gr gr gr gr gr gr gr gr gr gr gr gr gr gr gr gr gr gr gr gr gr gr gr gr gr gr gr gr gr gr gr gr gr gr gr gr gr gr gr gr gr gr gr gr gr gr gr gr gr gr gr gr gr gr gr gr gr gr gr gr gr gr ie ie ie ie ie ie ie ie ie ie ie ie ie ie ie ie ie ie ie ie ie ie ie ie ie ie ie ie ie ie ie ie ie ie ie ie ie ie ie ie ie ie ie ie ie ie ie ie ie ie ie ie ie ie ie ie ie ie ie ie ie ie ie ie ie ie ie ie ie ie ie ie ie ie ie ie ie ie ie ie ie ie ie ie ie ie ie ie ie ie ie ie ie ie ie ie ie ie ilililililililililililililililililililililililililililililililililililililililililililililililililililililililililililililililililililililililililililililililililililililililililililililililililil is is is is is is is is is is is is is is is is is is is is is is is is is is is is is is is is is is is is is is is is is is is is is is is is is is is is is is is is is is is is is is is is is is is is is is is is is is is is is is is is is is is is is is is is is is is is is is is is is is it it it it it it it it it it it it it it it it it it it it it it it it it it it it it it it it it it it it it it it it it it it it it it it it it it it it it it it it it it it it it it it it it it it it it it it it it it it it it it it it it it it it it it it it it it it it it it it it it it lu lu lu lu lu lu lu lu lu lu lu lu lu lu lu lu lu lu lu lu lu lu lu lu lu lu lu lu lu lu lu lu lu lu lu lu lu lu lu lu lu lu lu lu lu lu lu lu lu lu lu lu lu lu lu lu lu lu lu lu lu lu lu lu lu lu lu lu lu lu lu lu lu lu lu lu lu lu lu lu lu lu lu lu lu lu lu lu lu lu lu lu lu lu lu lu lu lu nl nl nl nl nl nl nl nl nl nl nl nl nl nl nl nl nl nl nl nl nl nl nl nl nl nl nl nl nl nl nl nl nl nl nl nl nl nl nl nl nl nl nl nl nl nl nl nl nl nl nl nl nl nl nl nl nl nl nl nl nl nl nl nl nl nl nl nl nl nl nl nl nl nl nl nl nl nl nl nl nl nl nl nl nl nl nl nl nl nl nl nl nl nl nl nl nl nl no no no no no no no no no no no no no no no no no no no no no no no no no no no no no no no no no no no no no no no no no no no no no no no no no no no no no no no no no no no no no no no no no no no no no no no no no no no no no no no no no no no no no no no no no no no no no no no no no no se se se se se se se se se se se se se se se se se se se se se se se se se se se se se se se se se se se se se se se se se se se se se se se se se se se se se se se se se se se se se se se se se se se se se se se se se se se se se se se se se se se se se se se se se se se se se se se se se se sk sk sk sk sk sk sk sk sk sk sk sk sk sk sk sk sk sk sk sk sk sk sk sk sk sk sk sk sk sk sk sk sk sk sk sk sk sk sk sk sk sk sk sk sk sk sk sk sk sk sk sk sk sk sk sk sk sk sk sk sk sk sk sk sk sk sk sk sk sk sk sk sk sk sk sk sk sk sk sk sk sk sk sk sk sk sk sk sk sk sk sk sk sk sk sk sk sk uk uk uk uk uk uk uk uk uk uk uk uk uk uk uk uk uk uk uk uk uk uk uk uk uk uk uk uk uk uk uk uk uk uk uk uk uk uk uk uk uk uk uk uk uk uk uk uk uk uk uk uk uk uk uk uk uk uk uk uk uk uk uk uk uk uk uk uk uk uk uk uk uk uk uk uk uk uk uk uk uk uk uk uk uk uk uk uk uk uk uk uk uk uk uk uk uk uk us us us us us us us us us us us us us us us us us us us us us us us us us us us us us us us us us us us us us us us us us us us us us us us us us us us us us us us us us us us us us us us us us us us us us us us us us us us us us us us us us us us us us us us us us us us us us us us us us us -.2 0 .2 .4 .6 In e q u a lit y re d u ct io n d u e t o p a yro ll ta x -.2 0 .2 .4 .6
Inequality reduction due to income tax Inequality reduction at the upper-half (D9/D5)
Figure 6: Inequality reduction due to payroll and income tax, at the lower- and upper-half of the distribution.
Note: The forty-five degree line means an equal impact of payroll and income tax on inequality reduction. The D5/D1 ratio indicates the relative size of the gross income owned by the fifth decile (median) as compared to that of the first decile. The D9/D5 ratio indicates the relative size of the gross income owned by the ninth decile as compared to that of the fifth decile (median). Countries are represented by their ISO code (Germany: DE; Australia: AU; Austria: AT; Canada: CA; Denmark: DK; Spain: ES; Estonia : EE; United States: US; Finland: FI; France: FR; Greece: GR; Ireland: IE; Iceland: IS; Israel: IL; Italy: IT; Luxembourg: LU; Norway: NO; Netherlands: NL; United Kingdom: GB; Rep. Czech: CZ; Slovakia: SK; Sweden: SE). The years are identical to those presented in the previous graphs. Reading: In France, payroll taxes reduce the D5/D1 ratio by 0.55 in 2010. Income tax reduce the D5/D1 ratio by 0.05.
4
Conclusion
We have analysed the contribution of income tax and social insurance contributions (both employer and employee) to inequality reduction in 22 OECD countries over the 1999-2016 period. Our results challenge the standard economic view that payroll taxes are regressive, and undermine the income tax performance in reducing inequality.
We highlight a series of new stylised facts. First, while employee contributions do have a bell-shaped form in some countries, employer contributions are generally progressive, resulting in an overall progressivity of the contribution rate. The inclusion of employer social contributions is important to capture the progressivity of social contributions. Second, we demonstrate that the observed progressivity in the effective rates of payroll tax is due to the tax base, as in most countries the schedule of social contributions is regressive. Third, we show that the combination of income tax and payroll tax promotes the progressivity of the tax system as a whole, all along the income distribution. We reveal a mirror image of the variations in income tax and social contribution rates: in all countries of our sample, income tax progressivity increases as soon as the progressivity of social contributions decreases. Finally, while payroll taxes significantly reduce the income gap at the bottom of the income distribution, income taxes reduce inequalities at the top. Income tax and social insurance contributions are complementary, rather than opposed, in the fight against inequality.
This has important consequences from a comparative perspective. Looking solely at income tax provides a highly biased estimate of the progressivity of tax systems; adding employee contributions, without taking employer contributions into account, does not yield any better results. This is in line with the recommendation of the Canberra Group ( Can-berra, 2001), as well as recent studies by Guillaud et al. (2019a) and Bozio et al. (2018), which advocate the inclusion of employer contributions in the analysis of household taxa-tion. In addition, the composition of the tax system (a higher proportion of income tax
or social contributions) seems of little importance to explain the level of redistribution achieved overall. Many countries with different redistribution methods reach comparable levels of redistribution.
Our results lead to the sharp conclusion that income taxes and payroll taxes are not defined independently. The precise way in which this interaction works would require a specific analysis of tax policy making. However, we can already suggest two explanations for the interconnection of income tax and social insurance contributions. To begin with, the institutional role of social insurance has evolved over time. In a context of rising unemployment (at least in Europe) and limited fiscal policy room for manoeuvre, social insurance contributions are increasingly being used as an element of general taxation. Over time, in most OECD countries, more progressive features that were previously specific to income tax have been included in social security contributions (Koreh and Zemmour,2019). This includes a lower contribution rate for low-wage earners, or a generally more progressive design of contributions. Besides, when setting the income tax schedule and its possible evolution, governments do not ignore the social insurance scheme. Given that the economic literature, and economic policy recommendations, have long stressed the importance of the tax wedge, it is not surprising to note that income tax is actually defined in relation to the social insurance system.
References
Anderson, P. M. and B. D. Meyer, “The Effects of Firm Specific Taxes and Government Mandates with an Application to the US Unemployment Insurance Program,” Journal of Public Economics, 65(2), 119–145, 1997.
Anderson, P. M. and B. D. Meyer, “The Effects of the Unemployment Insurance Payroll Tax on Wages, Employment, Claims and Denials,” Journal of Public Economics, 78(1-2), 81–106, 2000.
Atkinson, A. B., “The Luxembourg Income Study (LIS): Past, Present and Future,” Socio-Economic Review, 2(2), 165–190, 2004.
Bozio, A., B. Garbinti, J. Goupille-Lebret, M. Guillot, and T. Piketty, “Inequality and Redistribution in France, 1990–2018: Evidence from Post-Tax Distributional National Accounts (DINA),” WID.world Working Paper Series, 2018/10, 2018.
Bozio, A., M. Guillot, Q. Laff´eter, and M. Tenand, “Le mod`ele de micro-simulation TAXIPP–version 0.3,” Guide m´ethodologique IPP, 2014.
Brady, D. and A. Bostic, “Paradoxes of Social Policy: Welfare Transfers, Relative Poverty, and Redistribution Preferences,” American Sociological Review, 80, 268–298, 2015. Caminada, K., J. Wang, K. Goudswaard, and C. Wang, “Income Inequality and Fiscal
Redistribution in 47 LIS-countries (1967-2014),” LIS Working Paper Series, 724, 2017. Canberra, Expert Group on Household Income Statistics: Final Report and
Recommenda-tions, Canberra Group, 2001.
Evidence from Distributional National Accounts (DINA),” Journal of Public Economics, 162, 63–77, 2018.
Gruber, J., “The Incidence of Mandated Maternity Benefits,” The American Economic Review, 622–641, 1994.
Gruber, J., “The Incidence of Payroll Taxation: Evidence from Chile,” Journal of Labor Economics, 15(S3), S72–S101, 1997.
Guillaud, E., M. Olckers, and M. Zemmour, “Four Levers of Redistribution: The Impact of Tax and Transfer Systems on Inequality Reduction,” Review of Income and Wealth, 2019a.
Guillaud, E., M. Olckers, and M. Zemmour, “REDINEQ data,”http://www.redineq.com, 2019b, (version: July, 2019).
Immervoll, H., H. Levy, C. Lietz, D. Mantovani, C. O’Donoghue, H. Sutherland, and G. Ver-bist, “Household Incomes and Redistribution in the European Union: Quantifying the Equalizing Properties of Taxes and Benefits,” in “The Distributional Effects of Govern-ment Spending and Taxation,” 135–165, Springer, 2006.
Immervoll, H. and L. Richardson, “Redistribution Policy and Inequality Reduction in OECD Countries: What has Changed in Two Decades?” OECD Social, Employment and Migration Working Papers, 122, 2011.
Kenworthy, L., Progress for the Poor, Oxford University Press, 2011.
Koreh, M. and M. Zemmour, “A Silent Revolution in the Contributory Social Insur-ance Method: A Comparative Analysis of OECD countries, 1980-2016,” Working paper, LIEPP Sciences Po, 2019.
Landais, C., T. Piketty, and E. Saez, Pour une r´evolution fiscale: Un impˆot sur le revenu pour le 21`eme si`ecle, Le Seuil, 2011.
LIS, “Luxembourg Income Study (LIS) Database,” http://www.lisdatacenter.org,
2018, (multiple countries; accessed June to August 2018). Luxembourg: LIS.
Marx, I., L. Salanauskaite, and G. Verbist, “The Paradox of Redistribution Revisited: And that it May Rest in Peace?” IZA Discussion Paper, 7414, 2013.
Murphy, K. J., “The Impact of Unemployment Insurance Taxes on Wages,” Labour Eco-nomics, 14(3), 457–484, 2007.
Piketty, T., Le capital au XXIe si`ecle, Le Seuil, 2013.
Piketty, T., E. Saez, and G. Zucman, “Distributional National Accounts: Methods and Estimates for the United States,” The Quarterly Journal of Economics, 133(2), 553–609, 2017.
Prasad, M. and Y. Deng, “Taxation and the Worlds of Welfare,” Socio-Economic Review, 7, 431–457, 2009.
Sutherland, H. and F. Figari, “EUROMOD: the European Union Tax-Benefit Microsimu-lation Model,” International Journal of MicrosimuMicrosimu-lation, 6(1), 4–26, 2013.
Verbist, G. and F. Figari, “The Redistributive Effect and Progressivity of Taxes Revis-ited: An International Comparison Across the European Union,” FinanzArchiv: Public Finance Analysis, 70(3), 405–429, 2014.
Wagstaff, A., E. Van Doorslaer, H. Van Der Burg, S. Calonge, T. Christiansen, G. Citoni, U.-G. Gerdtham, M. Gerfin, L. Gross, U. H¨akinnen, et al., “Redistributive Effect,
Pro-gressivity and Differential Tax Treatment: Personal Income Taxes in Twelve OECD countries,” Journal of Public Economics, 72(1), 73–98, 1999.
A
Effective rates of social contributions
0.0 0.1 0.2 0.3 0.0 0.1 0.2 0.3 0.0 0.1 0.2 0.3 0.0 0.1 0.2 0.3 0.0 0.1 0.2 0.3 0 25 50 75 100 0 25 50 75 100 0 25 50 75 100 0 25 50 75 100 0 25 50 75 100Australia 2010 Austria 2013 Canada 2013 Czech Republic 2013 Denmark 2013
Estonia 2013 Finland 2013 France 2010 Germany 2015 Greece 2013
Iceland 2010 Ireland 2007 Israel 2010 Italy 2014 Luxembourg 2013
Netherlands 2013 Norway 2013 Slovak Republic 2013 Spain 2013 Sweden 2005
United Kingdom 2013 United States 2016
Employee social insurance contribution Employer social insurance contribution Percentiles of gross income
Figure A1: Effective rates of employee and employer social insurance contributions by percentile of gross income.
Reading: In Germany in 2015, for the 75th percentile of the gross income distribution, the ef-fective rate of employee social contributions is 13.4%, and the efef-fective rate of employer social contributions is 13.9%.
B
Mirror-like variations in contribution and income
tax slopes
-0.005 0.000 0.005 0.010 -0.005 0.000 0.005 0.010 -0.005 0.000 0.005 0.010 -0.005 0.000 0.005 0.010 0 25 50 75 100 0 25 50 75 100 0 25 50 75 100 0 25 50 75 100 0 25 50 75 100Australia 2010 Austria 2013 Canada 2013 Czech Republic 2013 Denmark 2013
Estonia 2013 Finland 2013 France 2010 Germany 2015 Greece 2013
Iceland 2010 Ireland 2007 Israel 2010 Italy 2014 Luxembourg 2013
Norway 2013 Slovak Republic 2013 Spain 2013 Sweden 2005 United Kingdom 2013
Slope of income tax rate Slope of payroll tax rate Percentile of gross income
Figure B1: Slopes of income and payroll tax rates, all countries.
Note: The graph reads like Figure4in the main text, but the United States and the Netherlands have not been reproduced here.
-.01 -.005 0 .005 .01 Sl o p e o f in co me t a x ra te -.01 0 .01 .02
Slope of payroll tax rate
Figure B2: Correlation between slopes of income and payroll tax rates. Reading: The correlation coefficient between both slopes is negative: −35%.
C
Restricted sample of households under 60
Running the analysis on the sub-sample of households under 60 (excluding pensioners) does not affect our results: the effective rate of payroll tax is progressive, due to a base effect. As shown in FigureC1, the level of the effective rate of payroll tax is slightly increased in the first segment of income distribution, from the 10th percentile to the median income, while the payroll tax rate of the bottom 10% is left unchanged. This is due to a change in the composition of the tax base within the bottom deciles: by excluding pensions, the share of labour income over gross income is raised among poor households, but the first decile. As a consequence, the progressivity of the payroll tax rate appears even stronger at the very bottom of the income distribution (within the first decile). The combination of income tax and payroll tax still promotes the progressivity of the tax system all along the income distribution, as found in the main analysis.
0.00 0.25 0.50 0.00 0.25 0.50 0.00 0.25 0.50 0.00 0.25 0.50 0.00 0.25 0.50 0 25 50 75 100 0 25 50 75 100 0 25 50 75 100 0 25 50 75 100 0 25 50 75 100
Australia 2010 Austria 2013 Canada 2013 Czech Republic 2013 Denmark 2013
Estonia 2013 Finland 2013 France 2010 Germany 2015 Greece 2013
Iceland 2010 Ireland 2007 Israel 2010 Italy 2014 Luxembourg 2013
Netherlands 2013 Norway 2013 Slovak Republic 2013 Spain 2013 Sweden 2005
United Kingdom 2013 United States 2016
Total tax rate Payroll tax rate Percentile of gross income
Figure C1: Total tax and contribution rates by percentile of gross income, households under 60.
Note: By using this restricted sample, we get rid of double counting issues regarding pension-related contributions and the payment of public pensions. Reading: For households under 60, in Germany, the effective social insurance contribution rate for the 50th percentile is 28.5% in 2015. The total effective tax rate (contributions + PIT) is 37.5%.
D
Payroll and income tax on the Gini reduction
Figure D1 shows the relative contribution of each type of tax, measured by the reduction in the Gini index before and after each tax is collected.15 The forty-five degree line means
an equal impact of payroll and income tax on inequality reduction. The sum of the two variations gives the total variation of the Gini index obtained after taxation (taxes and contributions). Iso-redistribution lines are drawn from northwest to southeast of the plan. Four groups of countries differ according to their use of income tax or social contribution in tax redistribution. In the first group (Czech Republic, Estonia, France, and Slovakia), more redistribution is achieved through payroll tax than through income tax. In the second group (Finland, Greece, Spain, Sweden, and United Kingdom), which lies relatively close to the 45-degrees line, countries redistribute slightly more through income taxes. In the third group (Austria, Denmark, Germany, Ireland, Italy, Norway, and Spain), the most numerous, redistribution is mainly achieved through income tax. Finally, in the last group of countries (Australia, Canada, Iceland, Netherlands, and the United States), the redistributive impact of social insurance contributions is almost zero or even negative.
Many countries with different redistribution methods achieve comparable levels of re-distribution: these points are on the same iso-redistribution line. For example, a reduction in the Gini index of about 0.065 can be achieved by a high use of social contributions (as in France), or by a high use of income tax (as in Germany). Conversely, a smaller reduction in the Gini index (0.040) concerns countries that rely more heavily on income tax (Spain), as well as countries that rely more on social contributions (Slovakia). In other words, a tax system mainly based on income tax does not necessarily imply a greater tax redistribution.
15The redistribution obtained by social contributions is the difference between the Gini index of gross
income and that of income after contributions, and the redistribution obtained by income tax is the differ-ence between the Gini index of income after contributions and the Gini index of income after contributions and taxes (disposable income).