arXiv:hep-ex/9811015v1 10 Nov 1998
EUROPEAN LABORATORY FOR PARTICLE PHYSICS (CERN)
CERN-EP/98-101 17 June 1998
The Forward-Backward Asymmetry for Charm
Quarks at the Z
The ALEPH Collaboration1
Abstract
The data set collected with the ALEPH detector from 1991 to 1995 at LEP has been analysed to measure the charm forward-backward asymmetry at the Z. Out of a total of 4.1 million hadronic Z decays, about 36000 high momentum D∗+
, D+ and D0 decays
were reconstructed, of which 80% originate from Z → c¯c events. The forward-backward asymmetry was measured at three energy points:
Ac F B( √ s = 89.37 GeV) = (−1.0 ± 4.4)% Ac F B( √ s = 91.22 GeV) = (6.3 ± 1.0)% Ac F B( √ s = 92.96 GeV) = (11.0 ± 3.4)% .
From this analysis, a value of the effective electroweak mixing angle sin2θeff
W =
0.2321 ± 0.0016 is extracted.
The ALEPH Collaboration
R. Barate, D. Buskulic, D. Decamp, P. Ghez, C. Goy, J.-P. Lees, A. Lucotte, E. Merle, M.-N. Minard, J.-Y. Nief, B. Pietrzyk
Laboratoire de Physique des Particules (LAPP), IN2
P3
-CNRS, F-74019 Annecy-le-Vieux Cedex, France
R. Alemany, G. Boix, M.P. Casado, M. Chmeissani, J.M. Crespo, M. Delfino, E. Fernandez, M. Fernandez-Bosman, Ll. Garrido,15
E. Graug`es, A. Juste, M. Martinez, G. Merino, R. Miquel, Ll.M. Mir, I.C. Park, A. Pascual, I. Riu, F. Sanchez
Institut de F´isica d’Altes Energies, Universitat Aut`onoma de Barcelona, E-08193 Bellaterra (Barcelona), Spain7
A. Colaleo, D. Creanza, M. de Palma, G. Gelao, G. Iaselli, G. Maggi, M. Maggi, S. Nuzzo, A. Ranieri, G. Raso, F. Ruggieri, G. Selvaggi, L. Silvestris, P. Tempesta, A. Tricomi,3
G. Zito Dipartimento di Fisica, INFN Sezione di Bari, I-70126 Bari, Italy
X. Huang, J. Lin, Q. Ouyang, T. Wang, Y. Xie, R. Xu, S. Xue, J. Zhang, L. Zhang, W. Zhao Institute of High-Energy Physics, Academia Sinica, Beijing, The People’s Republic of China8
D. Abbaneo, U. Becker, P. Bright-Thomas,24
D. Casper, M. Cattaneo, F. Cerutti, V. Ciulli, G. Dissertori, H. Drevermann, R.W. Forty, M. Frank, R. Hagelberg, A.W. Halley, J.B. Hansen, J. Harvey, P. Janot, B. Jost, I. Lehraus, P. Mato, A. Minten, L. Moneta,21
A. Pacheco, F. Ranjard, L. Rolandi, D. Rousseau, D. Schlatter, M. Schmitt,20
O. Schneider, W. Tejessy, F. Teubert, I.R. Tomalin, H. Wachsmuth
European Laboratory for Particle Physics (CERN), CH-1211 Geneva 23, Switzerland
Z. Ajaltouni, F. Badaud, G. Chazelle, O. Deschamps, A. Falvard, C. Ferdi, P. Gay, C. Guicheney, P. Henrard, J. Jousset, B. Michel, S. Monteil, J-C. Montret, D. Pallin, P. Perret, F. Podlyski, J. Proriol, P. Rosnet
Laboratoire de Physique Corpusculaire, Universit´e Blaise Pascal, IN2
P3
-CNRS, Clermont-Ferrand, F-63177 Aubi`ere, France
J.D. Hansen, J.R. Hansen, P.H. Hansen, B.S. Nilsson, B. Rensch, A. W¨a¨an¨anen Niels Bohr Institute, DK-2100 Copenhagen, Denmark9
G. Daskalakis, A. Kyriakis, C. Markou, E. Simopoulou, I. Siotis, A. Vayaki Nuclear Research Center Demokritos (NRCD), GR-15310 Attiki, Greece
A. Blondel, G. Bonneaud, J.-C. Brient, P. Bourdon, A. Roug´e, M. Rumpf, A. Valassi,6
M. Verderi, H. Videau
Laboratoire de Physique Nucl´eaire et des Hautes Energies, Ecole Polytechnique, IN2
P3
-CNRS, F-91128 Palaiseau Cedex, France
E. Focardi, G. Parrini, K. Zachariadou
Dipartimento di Fisica, Universit`a di Firenze, INFN Sezione di Firenze, I-50125 Firenze, Italy M. Corden, C. Georgiopoulos, D.E. Jaffe
Supercomputer Computations Research Institute, Florida State University, Tallahassee, FL 32306-4052, USA13,14
A. Antonelli, G. Bencivenni, G. Bologna,4
F. Bossi, P. Campana, G. Capon, V. Chiarella, G. Felici, P. Laurelli, G. Mannocchi,5
F. Murtas, G.P. Murtas, L. Passalacqua, M. Pepe-Altarelli Laboratori Nazionali dell’INFN (LNF-INFN), I-00044 Frascati, Italy
L. Curtis, J.G. Lynch, P. Negus, V. O’Shea, C. Raine, J.M. Scarr, K. Smith, P. Teixeira-Dias, A.S. Thompson, E. Thomson
O. Buchm¨uller, S. Dhamotharan, C. Geweniger, G. Graefe, P. Hanke, G. Hansper, V. Hepp, E.E. Kluge, A. Putzer, J. Sommer, K. Tittel, S. Werner, M. Wunsch
Institut f¨ur Hochenergiephysik, Universit¨at Heidelberg, D-69120 Heidelberg, Germany16
R. Beuselinck, D.M. Binnie, W. Cameron, P.J. Dornan,2
M. Girone, S. Goodsir, E.B. Martin, N. Marinelli, A. Moutoussi, J. Nash, J.K. Sedgbeer, P. Spagnolo, M.D. Williams
Department of Physics, Imperial College, London SW7 2BZ, United Kingdom10
V.M. Ghete, P. Girtler, E. Kneringer, D. Kuhn, G. Rudolph
Institut f¨ur Experimentalphysik, Universit¨at Innsbruck, A-6020 Innsbruck, Austria18
A.P. Betteridge, C.K. Bowdery, P.G. Buck, P. Colrain, G. Crawford, A.J. Finch, F. Foster, G. Hughes, R.W.L. Jones, N.A. Robertson, M.I. Williams
Department of Physics, University of Lancaster, Lancaster LA1 4YB, United Kingdom10
I. Giehl, C. Hoffmann, K. Jakobs, K. Kleinknecht, G. Quast, B. Renk, E. Rohne, H.-G. Sander, P. van Gemmeren, C. Zeitnitz
Institut f¨ur Physik, Universit¨at Mainz, D-55099 Mainz, Germany16
J.J. Aubert, C. Benchouk, A. Bonissent, G. Bujosa, J. Carr,2
P. Coyle, F. Etienne, O. Leroy, F. Motsch, P. Payre, M. Talby, A. Sadouki, M. Thulasidas, K. Trabelsi
Centre de Physique des Particules, Facult´e des Sciences de Luminy, IN2
P3
-CNRS, F-13288 Marseille, France
M. Aleppo, M. Antonelli, F. Ragusa
Dipartimento di Fisica, Universit`a di Milano e INFN Sezione di Milano, I-20133 Milano, Italy R. Berlich, V. B¨uscher, G. Cowan, H. Dietl, G. Ganis, G. L¨utjens, C. Mannert, W. M¨anner, H.-G. Moser, S. Schael, R. Settles, H. Seywerd, H. Stenzel, W. Wiedenmann, G. Wolf
Max-Planck-Institut f¨ur Physik, Werner-Heisenberg-Institut, D-80805 M¨unchen, Germany16
J. Boucrot, O. Callot, S. Chen, A. Cordier, M. Davier, L. Duflot, J.-F. Grivaz, Ph. Heusse, A. H¨ocker, A. Jacholkowska, D.W. Kim,12
F. Le Diberder, J. Lefran¸cois, A.-M. Lutz, M.-H. Schune, E. Tournefier, J.-J. Veillet, I. Videau, D. Zerwas
Laboratoire de l’Acc´el´erateur Lin´eaire, Universit´e de Paris-Sud, IN2
P3
-CNRS, F-91898 Orsay Cedex, France
P. Azzurri, G. Bagliesi,2
G. Batignani, S. Bettarini, T. Boccali, C. Bozzi, G. Calderini, M. Carpinelli, M.A. Ciocci, R. Dell’Orso, R. Fantechi, I. Ferrante, L. Fo`a,1
F. Forti, A. Giassi, M.A. Giorgi, A. Gregorio, F. Ligabue, A. Lusiani, P.S. Marrocchesi, A. Messineo, F. Palla, G. Rizzo, G. Sanguinetti, A. Sciab`a, G. Sguazzoni, R. Tenchini, G. Tonelli,19
C. Vannini, A. Venturi, P.G. Verdini
Dipartimento di Fisica dell’Universit`a, INFN Sezione di Pisa, e Scuola Normale Superiore, I-56010 Pisa, Italy
G.A. Blair, L.M. Bryant, J.T. Chambers, M.G. Green, T. Medcalf, P. Perrodo, J.A. Strong, J.H. von Wimmersperg-Toeller
Department of Physics, Royal Holloway & Bedford New College, University of London, Surrey TW20 OEX, United Kingdom10
D.R. Botterill, R.W. Clifft, T.R. Edgecock, P.R. Norton, J.C. Thompson, A.E. Wright
Particle Physics Dept., Rutherford Appleton Laboratory, Chilton, Didcot, Oxon OX11 OQX, United Kingdom10
B. Bloch-Devaux, P. Colas, S. Emery, W. Kozanecki, E. Lan¸con,2
M.-C. Lemaire, E. Locci, P. Perez, J. Rander, J.-F. Renardy, A. Roussarie, J.-P. Schuller, J. Schwindling, A. Trabelsi, B. Vallage CEA, DAPNIA/Service de Physique des Particules, CE-Saclay, F-91191 Gif-sur-Yvette Cedex, France17
S.N. Black, J.H. Dann, R.P. Johnson, H.Y. Kim, N. Konstantinidis, A.M. Litke, M.A. McNeil, G. Taylor
Institute for Particle Physics, University of California at Santa Cruz, Santa Cruz, CA 95064, USA22
C.N. Booth, S. Cartwright, F. Combley, M.S. Kelly, M. Lehto, L.F. Thompson Department of Physics, University of Sheffield, Sheffield S3 7RH, United Kingdom10
K. Affholderbach, A. B¨ohrer, S. Brandt, C. Grupen, P. Saraiva, L. Smolik, F. Stephan Fachbereich Physik, Universit¨at Siegen, D-57068 Siegen, Germany16
G. Giannini, B. Gobbo, G. Musolino
Dipartimento di Fisica, Universit`a di Trieste e INFN Sezione di Trieste, I-34127 Trieste, Italy J. Rothberg, S. Wasserbaech
Experimental Elementary Particle Physics, University of Washington, WA 98195 Seattle, U.S.A. S.R. Armstrong, E. Charles, P. Elmer, D.P.S. Ferguson, Y. Gao, S. Gonz´alez, T.C. Greening, O.J. Hayes, H. Hu, S. Jin, P.A. McNamara III, J.M. Nachtman,23
J. Nielsen, W. Orejudos, Y.B. Pan, Y. Saadi, I.J. Scott, J. Walsh, Sau Lan Wu, X. Wu, G. Zobernig
Department of Physics, University of Wisconsin, Madison, WI 53706, USA11
1
Now at CERN, 1211 Geneva 23, Switzerland.
2
Also at CERN, 1211 Geneva 23, Switzerland.
3
Also at Dipartimento di Fisica, INFN, Sezione di Catania, Catania, Italy.
4
Also Istituto di Fisica Generale, Universit`a di Torino, Torino, Italy.
5
Also Istituto di Cosmo-Geofisica del C.N.R., Torino, Italy.
6
Supported by the Commission of the European Communities, contract ERBCHBICT941234.
7
Supported by CICYT, Spain.
8
Supported by the National Science Foundation of China.
9
Supported by the Danish Natural Science Research Council.
10
Supported by the UK Particle Physics and Astronomy Research Council.
11
Supported by the US Department of Energy, grant DE-FG0295-ER40896.
12
Permanent address: Kangnung National University, Kangnung, Korea.
13
Supported by the US Department of Energy, contract DE-FG05-92ER40742.
14
Supported by the US Department of Energy, contract DE-FC05-85ER250000.
15
Permanent address: Universitat de Barcelona, 08208 Barcelona, Spain.
16
Supported by the Bundesministerium f¨ur Bildung, Wissenschaft, Forschung und Technologie, Germany.
17
Supported by the Direction des Sciences de la Mati`ere, C.E.A.
18
Supported by Fonds zur F¨orderung der wissenschaftlichen Forschung, Austria.
19
Also at Istituto di Matematica e Fisica, Universit`a di Sassari, Sassari, Italy.
20
Now at Harvard University, Cambridge, MA 02138, U.S.A.
21
Now at University of Geneva, 1211 Geneva 4, Switzerland.
22
Supported by the US Department of Energy, grant DE-FG03-92ER40689.
23
Now at University of California at Los Angeles (UCLA), Los Angeles, CA 90024, U.S.A.
24
1
Introduction
The forward-backward asymmetry in Z → c¯c decays provides a direct and precise test of the coupling of the Z to up-type quarks. The asymmetry Af
F B in Z → f¯f decays
arises from parity violation in Z production and decay. In the Standard Model, the differential cross section, expressed as a function of the angle θ between the outgoing fermion and the incoming electron, is
1 σ dσ d cos θ = 3 8(1 + cos 2θ) + Af F Bcos θ (1)
At the Z pole, for unpolarised e+e−
beams, Af
F B is related to the pole asymmetry A 0,f F B,
defined in terms of the effective couplings in the improved Born approximation as A0,fF B = 3 4 2gVegAe (g2 Ve+ gAe2 ) 2gVfgAf (g2 Vf + g2Af) . (2)
The measurement can be interpreted in terms of the effective electroweak mixing angle sin2θeff
W = 1
4(1 − gVe/gAe).
The Z → c¯c decays provide a convenient way to directly test the Z coupling to up-type quarks, since the Z → u¯u events are much harder to isolate. In this paper a sample of Z → c¯c decays is selected using high energy D+, D0 and D∗+
, fully reconstructed from their decays products. The restricted number of usable decay channels limits the tagging efficiency. On the other hand, the high purity obtained in the selection, together with a minor dependence on the decay models, allow a measurement with small systematic uncertainties.
First the selection of charmed mesons is described, then the background estimate is discussed and the asymmetry is measured on the selected sample at three different centre of mass energies: at the Z peak and at ±2 GeV off-peak.
2
Reconstruction of D
(∗)mesons
A detailed description of the ALEPH detector and its performance can be found in Ref. [1, 2]. Charged particles are detected in the central part of the detector, consisting of a two-layer silicon vertex detector with double-sided (r-φ and z) readout, a cylindrical drift chamber and a large time projection chamber (tpc), which together measure up to 33 coordinates along the charged particle trajectories. Tracking is performed in a 1.5 T axial magnetic field provided by a superconducting solenoid. The tpc also provides up to 338 measurements of ionization (dE/dx) allowing particle identification. The electromagnetic calorimeter is a lead/wire-chamber sandwich operated in proportional mode. It is read out in projective towers of typically 15 × 15 mrad2 size segmented in
three longitudinal sections. The iron return yoke is instrumented with streamer tubes to provide a measurement of the hadronic energy. An energy flow algorithm [2] combines charged particles momenta and calorimetric energy measurements and provides a list of energy flow particles on which the analysis is based.
About four million hadronic Z decays are selected as described in Ref. [3], out of the data set collected by ALEPH during the 1991–1995 running period at the Z resonance.
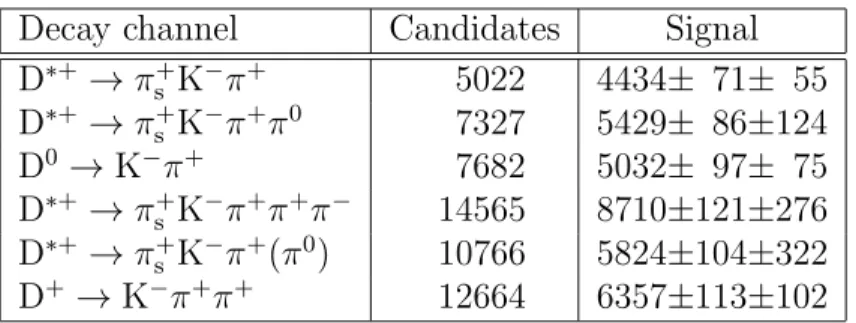
Table 1: Results of the D+, D0 and D∗+
reconstruction. The second column shows the number of candidates in the different channels, while the last column shows the number of signal events, after combinatorial background subtraction, together with the statistical and systematic uncertainties.
Decay channel Candidates Signal
D∗+ → π+ s K − π+ 5022 4434± 71± 55 D∗+ → π+ s K − π+π0 7327 5429± 86±124 D0 → K− π+ 7682 5032± 97± 75 D∗+ → π+ s K − π+π+π− 14565 8710±121±276 D∗+ → π+ s K − π+(π0) 10766 5824±104±322 D+ → K− π+π+ 12664 6357±113±102
Charmed mesons are reconstructed in the following decay modes (charge-conjugate modes are implied throughout the paper):
(i) D∗+ → D0π+ s (ii) D ∗+ → D0π+ s →K− π+ →K− π+π0 (iii) D0 → K− π+ (iv) D∗+ → D0π+ s →K− π+π+π− (v) D∗+ → D0π+ s (vi) D+→ K − π+π+ →K− π++ (π0)
where the soft pion from D∗+
decay is indicated as π+
s. Channel (v) is selected without
reconstructing the π0 by using the kinematic properties of the underlying resonances
in the D0 decay that make the K−
π+ invariant mass peak near 1.6 GeV/c2. The
reconstruction proceeds from channel (i) to channel (vi); once a candidate has been found in one event, this event is excluded in the following channels. Consequently, the D0 → K−
π+ decays from D∗+
are removed from the inclusive sample (iii ), thus avoiding double counting. The number of candidates for each selected sample is listed in Table 1.
All combinations of two and four tracks or two tracks and a π0, with total null
charge, are considered as D0 candidates, and all combinations of three tracks with
total charge +1 are considered as D+ candidates. The π0 candidates are selected from
two-photon combinations having a χ2 probability of at least 5% for a mass-constrained
kinematical fit [3]. The invariant mass of the D candidates, with mass assignment according to particle hypothesis, is required to be close to the D meson mass within two times the invariant mass resolution. The D0 → K−
π++ (π0) channel is reconstructed
as the D0 → K−
π+ decays, except that candidates are kept if the K−
π+invariant mass
is between 1.5 GeV/c2 and 1.7 GeV/c2.
D∗+
candidates from D∗+
→ π+
s D0 decays are selected by adding an extra track
with momentum less than 3.5 GeV/c to a D0 candidate. In the channels (ii), (iv) and
(v) the combinatorial background is reduced by requiring the D0 candidate to satisfy
| cos θ∗
| ≤ 0.8, where θ∗
, in the D0 rest frame, is the angle between the D0 direction
and the sphericity axis of the three (D0 → K−
π+π0) or four (D0 → K−
π+π+π−
) decay products, or the kaon direction in the decay D0 → K−
π+(π0) with an undetected π0.
The π+
s momentum is required to be greater than 1.5 GeV/c, favoring high momentum
D∗+
’s, in order to reject combinatorial background and Z → b¯b events in which a b hadron decays into a D∗+
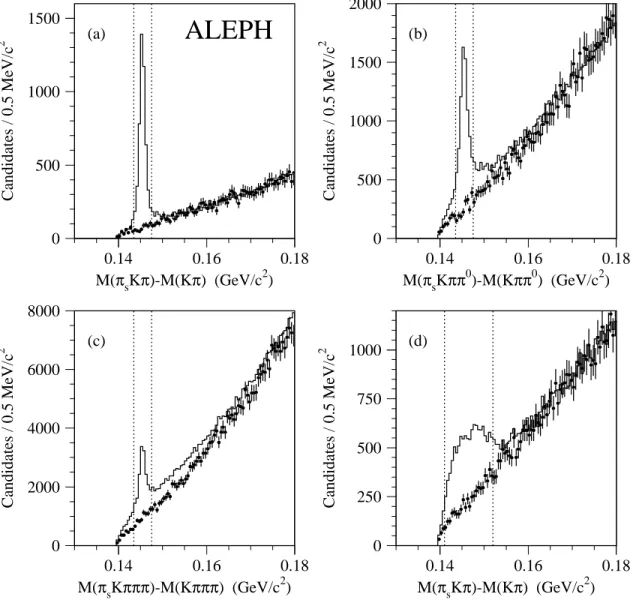
. In Figure 1 the mass difference ∆M = MD∗+ − MD0
distributions are shown. Candidates are selected in the ∆M region 143.5 MeV/c2 to
147.5 MeV/c2 for the channels (i), (ii) and (iv) and 141 MeV/c2 to 152 MeV/c2 for
channel (v).
Candidates from D0 → K−
π+ decays, channel (iii), are selected if the kaon track momentum is greater than 2.5 GeV/c and the pion track momentum greater than 1.5 GeV/c. A common vertex is searched for and candidates are kept if a vertex with a χ2 probability greater than 1% is found, and the projected decay length
significance is greater than unity. The asymmetry measurement in this channel suffers from the presence of a significant contribution of fake candidates due to incorrect mass assignments, which reverse the charge assignment of the charm quark. For a large fraction of these candidates, the correct mass assignment is also selected in the event. The dE/dx measurements of the two tracks are used to choose between the two mass combinations. The probability to be a kaon (PK) or a pion (Pπ) is computed
from the measured track ionization and the expectation for a kaon or a pion. The mass assignment which gives the highest probability PK × Pπ is kept. If no dE/dx
measurement is available for the tracks, the choice is made randomly. This criterion reduces the contribution from incorrect mass assignments to 4% in the signal region.
D+ candidates, channel (vi), are selected if the kaon track has a momentum greater
than 2.5 GeV/c and if the dE/dx measurement is more consistent with the expectation for a kaon than for a pion. One of the two pion tracks is required to have a momentum greater than 1.5 GeV/c, the other pion momentum being greater than 0.75 GeV/c. The three tracks are required to form a common vertex with a χ2 probability greater
than 1%, and a significance of the decay length, projected along the D+ momentum,
greater than 1.5. Finally, in case of multiple candidates, only the candidate with the largest decay length significance is kept.
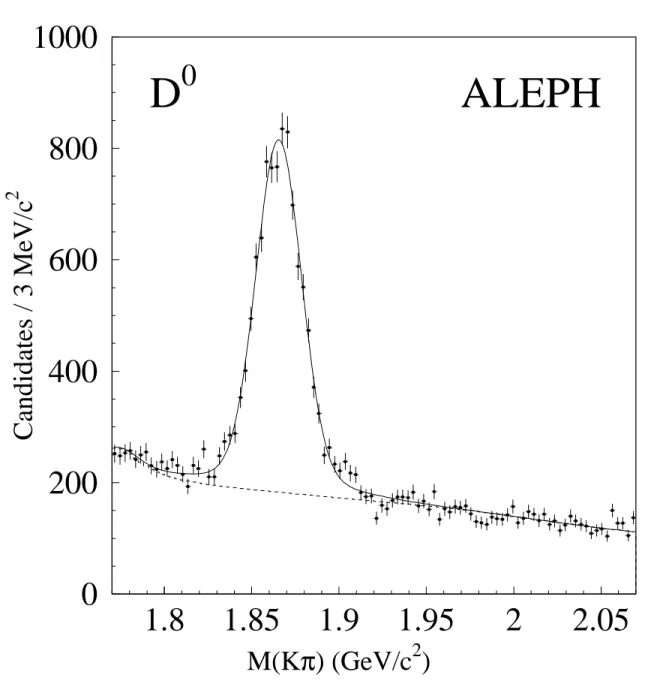
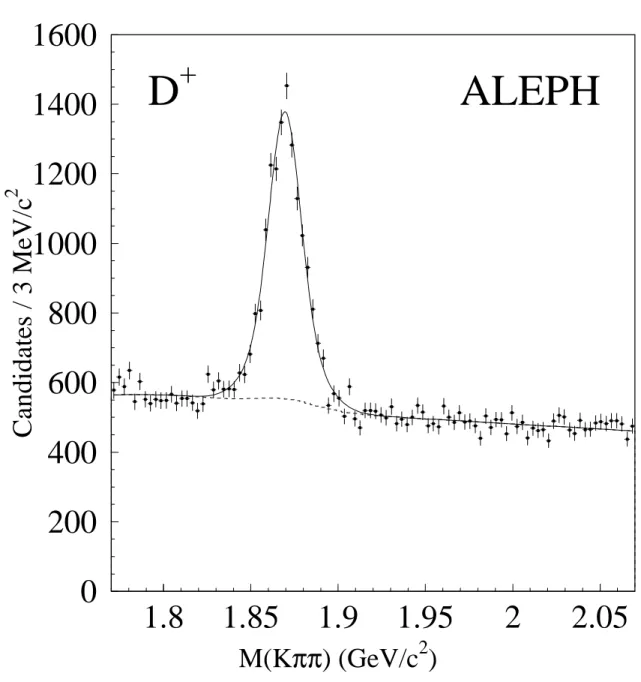
The contribution of the Z → c¯c process to the D0 → K−
π+ and D+ → K−
π+π+
signals is enhanced to 80% by selecting D0 and D+candidates with energy greater than
half the beam energy. The resulting invariant mass distributions are shown in Figure 2 for the D0 → K−
π+ sample and in Figure 3 for the D+ → K−
π+π+ sample.
3
Combinatorial background estimate
The fraction of combinatorial background events in the D∗+
sample is estimated from the mass difference distributions. The data sample contains, in addition to D∗+
’s which are correctly reconstructed, a combinatorial background and a fraction of D∗+
’s obtained from soft pions and partially reconstructed or fake D0’s. The
latter contribution, clearly seen in Figure 1(c), carries the correct charm quark charge, so it is treated as signal. The mass difference of the combinatorial background is obtained from D0 candidates in Monte Carlo simulated events in which no D∗+
’s have been produced. A track from fragmentation is added to such candidates and the combinatorial background is estimated from the resulting ∆M distribution, normalized to the data in the region ∆M > 0.16 GeV/c2. In the background normalisation
procedure reflections of the signal in the ∆M > 0.16 GeV/c2 region have to be taken
into account. This is done by using, both in data and in background Monte Carlo, only events in which a signal candidate is not found.
The fraction of combinatorial background events in the D0 and D+ samples is
extracted from a fit to the invariant mass distributions (Figures 2 and 3). The D0 and D+ signals are parametrized by two Gaussians with a common mean and
the combinatorial background by a polynomial function. Resonant background contributions, such as D0 → K−
K+, π+π−
(π0) and D0 → K−
π+ where the two mass
assignments are reversed (D0 channel), D± s → φπ ± and D± s → K ∗ K (D+ channel), are taken into account in the fit. Their shapes and sizes are fixed by the Monte Carlo simulation with branching ratio according to PDG values [4].
The fitted numbers of signal events in the different channels are shown in Table 1.
4
Measurement of the forward-backward asymmetry
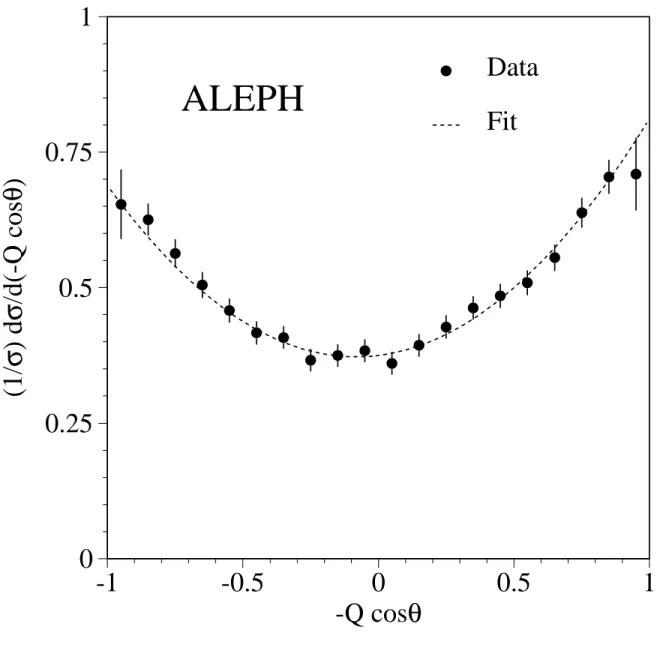
The measurement of the differential cross section for Z → c¯c events (Eq. 1) requires the evaluation of the angle θ between the charm quark direction and the incident electron beam. This is measured from the thrust axis, oriented along the candidate direction, cos θ = −Q cos θthrust, Q being the electric charge of the reconstructed K in the D0 or
D+ decays.
Together with charm events two possible sources contribute to the observed asymmetry: combinatorial background and charm mesons from Z → b¯b events. Therefore the observed asymmetry in the selected sample is
AobsF B = fsigfcAcF B + fsig(1 − fc)A b
F B + (1 − fsig)A bkg F B
where fsig is the fraction of D mesons in the sample, fc is the fraction originating
from direct charm production and AbkgF B is the forward-backward asymmetry of the combinatorial background.
The fraction, fc, of D mesons originating from direct charm production is measured
directly from data [5]. The event is divided into two hemispheres according to the thrust axis. A lifetime-mass tag [6] is applied on the hemisphere opposite to the D meson, to select b hemispheres with 99% purity. The fraction, fb-tag, of D mesons that
survive the b-tag cut is used to extract the charm fraction fc = ǫb¯ǫb− fb-tag
b¯b− ǫc¯c , where
ǫb¯b and ǫc¯c are the b-tag efficiency for b and charm events; ǫc¯c is obtained from Monte
Carlo simulation, while ǫb¯b is measured from an unbiased Z → b¯b data sample [6] and
corrected to take into account the presence of an energetic D meson in the opposite hemisphere. The systematic error on fc arises mainly from the uncertainty on this
correction [5]. The measured charm fractions are listed in Table 2. The b asymmetry Ab
F B is fixed to the Standard Model values at the three centre of
mass energies, as listed in Table 3, together with the dependence of the fitted charm asymmetry. The effective asymmetry that enters in this analysis is diluted by a factor (1 − 2χmix), due to the mixing of neutral b mesons. The mixing probability χmix
is different for each reconstructed D meson, since it depends on the fraction of such mesons produced in B0 decays among all b → D∗±
, D0, D+ decays. These fractions
are derived from Monte Carlo simulations and the associated errors are taken as the difference between the Monte Carlo prediction and an estimate based on experimental measurements in the semileptonic sector [7]. These values, together with the world average value of χd, are used to obtain the χmix values, shown in Table 2. The
contribution from the double-charm decays of b hadrons, in which the charge of 4
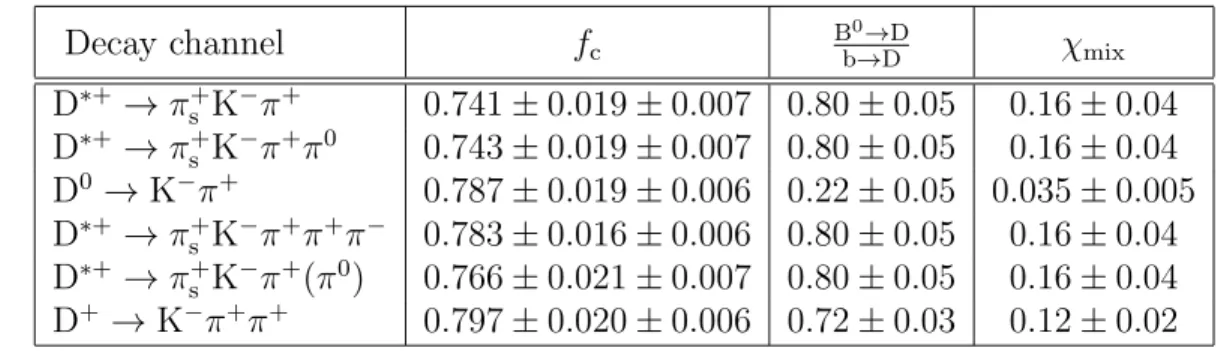
Table 2: Charm fraction and mixing probability used to extract the charm asymmetry from the observed asymmetry. The first column shows the charm fractions, as measured from data, with the statistical and systematic uncertainties. The second column shows the obtained fractions of D∗±
’s, D0’s and D+’s coming from B0 decays among all
b → D∗±
, D0, D+ decays. The resulting values of χ
mix are listed in the last column.
Decay channel fc B 0→ D b→D χmix D∗+ → πs+K − π+ 0.741 ± 0.019 ± 0.007 0.80 ± 0.05 0.16 ± 0.04 D∗+ → π+ s K − π+π0 0.743 ± 0.019 ± 0.007 0.80 ± 0.05 0.16 ± 0.04 D0 → K− π+ 0.787 ± 0.019 ± 0.006 0.22 ± 0.05 0.035 ± 0.005 D∗+ → π+ s K − π+π+π− 0.783 ± 0.016 ± 0.006 0.80 ± 0.05 0.16 ± 0.04 D∗+ → π+ s K − π+(π0) 0.766 ± 0.021 ± 0.007 0.80 ± 0.05 0.16 ± 0.04 D+→ K− π+π+ 0.797 ± 0.020 ± 0.006 0.72 ± 0.03 0.12 ± 0.02 Table 3: Value of Ab
F B at the three energy points, used to extract AcF B. These value
correspond to the Standard Model prediction with mt= 175 GeV/c2, mH = 127 GeV/c2
and αs = 0.120, without QCD correction in the final state (a discussion of the
corrections to the asymmetry in this analysis follows in the text). The last column shows the dependence of the charm asymmetry on the value of Ab
F B. √ s(GeV) Ab F B(%) dAcF B/dAbF B 89.37 5.7 −0.22 91.22 9.7 −0.22 92.96 12.1 −0.22
the reconstructed D(∗) has the opposite sign with respect to single-charm decays, is
negligible due to the low momentum of the decay products [8]. The doubly Cabibbo suppressed decay D0 → K+π−
, which affects both the charm and the b component of the inclusive D0 sample, has a negligible effect on the results.
The asymmetries are corrected to take into account the fraction of the selected D(∗)’s
that originate from gluon splitting, estimated to be (0.8 ± 0.4)% [5].
The asymmetry of the combinatorial background is measured from the upper side band of the mass peaks. Within the side bands, multiply-counted events are selected only once by choosing the candidate randomly. In the case of the D+, the contributions
of the resonant backgrounds are negligible in the upper side band region. On the other hand, in the case of the D0 → K−
π+ channel, the side band sample contains a
contribution where the two mass assignments of the D0 decay products are reversed.
This contribution induces an asymmetry opposite to the real asymmetry. Its size (around 5% of the side band sample) is estimated from the Monte Carlo simulation and then subtracted from the measured background asymmetry, using the Standard Model values for the charm and b asymmetries. The correction shifts the measured D0
background asymmetry by 0.004. The combinatorial background asymmetries for all channels, measured at the three centre of mass energies, are listed in Table 4.
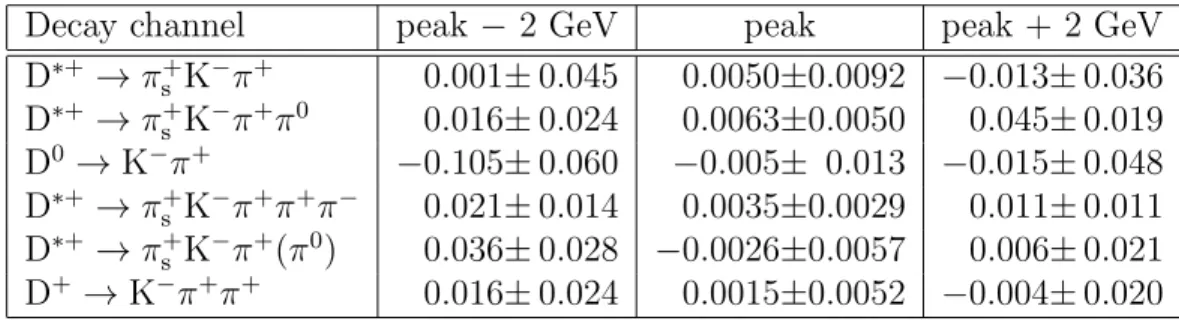
Table 4: Combinatorial background asymmetries, measured on data, at the three centre of mass energies, from the side band of the mass peaks.
Decay channel peak − 2 GeV peak peak + 2 GeV
D∗+ → π+ s K − π+ 0.001± 0.045 0.0050±0.0092 −0.013± 0.036 D∗+ → π+ s K − π+π0 0.016± 0.024 0.0063±0.0050 0.045± 0.019 D0 → K− π+ −0.105± 0.060 −0.005± 0.013 −0.015± 0.048 D∗+ → π+ s K − π+π+π− 0.021± 0.014 0.0035±0.0029 0.011± 0.011 D∗+ → π+ s K − π+(π0) 0.036± 0.028 −0.0026±0.0057 0.006± 0.021 D+ → K− π+π+ 0.016± 0.024 0.0015±0.0052 −0.004± 0.020
Table 5: Sources of systematic errors on the measured charm forward-backward asymmetry. The total errors are obtained summing in quadrature the relative contributions.
Source ∆Ac
F B (%)
peak − 2 GeV peak peak + 2 GeV Fraction of D mesons fsig ± 0.15 ± 0.10 ± 0.22
Charm fraction fc ± 0.10 ± 0.02 ± 0.12
b mixing ± 0.09 ± 0.17 ± 0.18
Comb. back. asymmetry ± 0.98 ± 0.20 ± 0.75
Gluon splitting — ± 0.03 ± 0.05
TOTAL ± 1.00 ± 0.28 ± 0.81
fit giving the following results at the three different centre of mass energies: Ac F B( √ s = 89.37 GeV) = (−1.0 ± 4.3 ± 1.0)% Ac F B( √ s = 91.22 GeV) = (6.3 ± 0.9 ± 0.3)% Ac F B( √ s = 92.96 GeV) = (11.0 ± 3.3 ± 0.8)% .
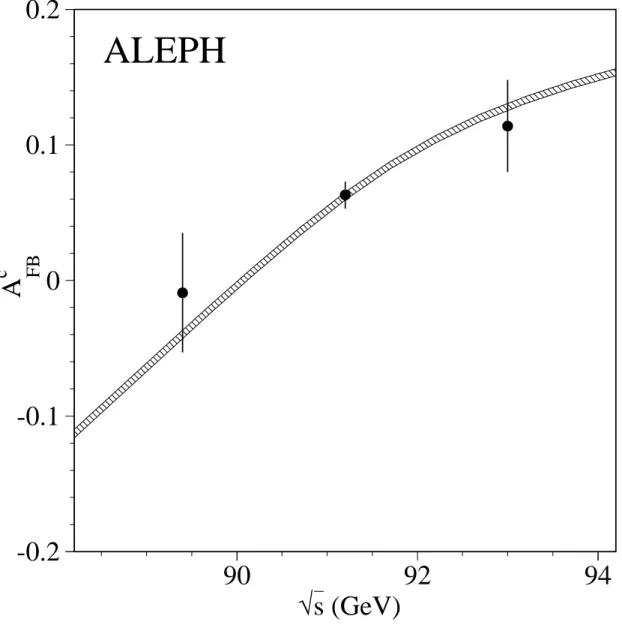
The first error is statistical and the second arises from systematic uncertainties as listed in Table 5. The angular distribution of the tagged Z → c¯c events at the Z is shown in Figure 4, after background subtraction and acceptance corrections. Figure 5 shows the measured asymmetries as a function of the centre of mass energy together with the predictions of the Standard Model.
The pole asymmetry as defined in Eq. 2 is extracted from the measured asymmetries at the three energy points by expressing them as a single measurement at the Z mass and applying a correction for the effect of initial and final state radiation, QCD corrections and photon exchange and interference. As pointed out in Ref. [9], the theoretical estimate of the QCD correction has to be rescaled to take into account the bias from the experimental cuts. In particular, the requirement of high momentum D(∗)s removes events in which hard gluon emission occurred, substantially reducing the
correction. As computed from Monte Carlo, the relative QCD correction after selection cuts are found to be consistent with zero within a 0.14% absolute uncertainty. The initial state radiation correction can also be biased by the selection cuts, which are less efficient at lower centre of mass energies. This correction, calculated to be 14.9% using the MIZA program [10], is lowered to (14.1 ± 0.1)% when the selection bias is taken
into account. The final relative correction to be applied to the measured asymmetry at the energy of the Z mass is (13.2 ± 0.2)%.
Within the Standard Model, the measured asymmetry can be used to extract a value of sin2θeff
W, taking into account the dependence of the b asymmetry on this quantity,
yielding
sin2θWeff = 0.2321 ± 0.0016 .
5
Conclusion
The forward-backward asymmetry in Z → c¯c decays has been measured at three different energies, at the Z peak and off-peak at ± 2 GeV:
Ac F B( √ s = 89.37 GeV) = (−1.0 ± 4.4)% Ac F B( √ s = 91.22 GeV) = (6.3 ± 1.0)% Ac F B( √ s = 92.96 GeV) = (11.0 ± 3.4)% . A Standard Model fit to the measured asymmetries yields sin2θeff
W = 0.2321±0.0016.
These measurements are in agreement with the Standard Model predictions and with the other determinations of these parameters at LEP [11].
Acknowledgements
We thank our colleagues from the accelerator divisions for the successful operation of the LEP machine and the engineers and technical staff in all our institutions for their contribution to the good performance of ALEPH. Those of us from non-member states thank CERN for its hospitality.
References
[1] ALEPH Collaboration, ALEPH: A Detector for Electron - Positron Annihilations at LEP, Nucl. Instr. Methods A294 (1990) 121.
[2] ALEPH Collaboration, Performance of the ALEPH detector at LEP, Nucl. Instr. Methods A360 (1995) 481.
[3] ALEPH Collaboration, Production of charmed mesons in Z decays, Z. Phys. C62 (1994) 1.
[4] R.M. Barnett et al.(Particle Data Group), Phys. Rev. D54 (1996) 1.
[5] ALEPH Collaboration, Measurement of the fraction of hadronic Z decays into charm quark pairs, CERN-EP/98-035, to be published in Eur. Phys. J. C
[6] ALEPH Collaboration, A Measurement of Rb using a lifetime mass tag, Phys.
Lett. B401 (1997) 150; A Measurement of Rb using mutually exclusive tags, Phys.
Lett. B401 (1997) 163.
[7] ALEPH Collaboration, Improved Measurement of the ¯B0 and B−
meson Lifetimes, Z. Phys. C71 (1996) 31.
[8] ALEPH Collaboration, Observation of doubly-charmed B decays at LEP, CERN-EP/98-037, submitted to Eur. Phys. J. C.
[9] D. Abbaneo et al.(LEP Heavy Flavour Working Group), CERN-EP/98-032, submitted to Eur. Phys. J. C.
[10] M. Martinez et al., Z. Phys. C49 (1991) 645.
[11] The LEP Collaborations ALEPH, DELPHI, L3, OPAL, the LEP Electroweak Working Group and the SLD Heavy Flavour Group, A Combination of Preliminary Electroweak Measurements and Constraints on the Standard Model, CERN-PPE/97-154.
0 500 1000 1500 0.14 0.16 0.18 0 500 1000 1500 2000 0.14 0.16 0.18 0 2000 4000 6000 8000 0.14 0.16 0.18 (a)
ALEPH
Candidates / 0.5 MeV/c 2 M(πsKπ)-M(Kπ) (GeV/c2) (b) Candidates / 0.5 MeV/c 2 M(πsKππ0)-M(Kππ0) (GeV/c2) (c) Candidates / 0.5 MeV/c 2 M(πsKπππ)-M(Kπππ) (GeV/c2) (d) Candidates / 0.5 MeV/c 2 M(πsKπ)-M(Kπ) (GeV/c2) 0 250 500 750 1000 0.14 0.16 0.18Figure 1: Mass-difference distribution for candidates of the decay channel D∗+
→ π+ s D0, followed by D0 → K − π+(a), D0 → K− π+π0(b), D0 → K− π+π+π− (c) and D0 → K−
π+(π0)(d) . The full histogram are the data while the dots with error bars
are the combinatorial background taken from Monte Carlo simulation. The error bars represent both the statistical error due to the limited Monte Carlo statistics and the systematic error in the normalisation. The dotted lines show the selected region.
0
200
400
600
800
1000
1.8
1.85
1.9
1.95
2
2.05
M(K
π
) (GeV/c
2
)
Candidates / 3 MeV/c
2
D
0
ALEPH
Figure 2: Mass distribution for candidates of the decay channel D0 → K−
π+. The
dots with error bars are data while the solid line represent the best fit to the distribution and the dashed line is the best fit to the background.
0
200
400
600
800
1000
1200
1400
1600
1.8
1.85
1.9
1.95
2
2.05
M(K
ππ
) (GeV/c
2
)
Candidates / 3 MeV/c
2
D
+
ALEPH
Figure 3: Mass distribution for candidates of the decay channel D+ → K−
π+π+. The
dots with error bars are data while the solid line represent the best fit to the distribution and the dashed line is the best fit to the background.
ALEPH
-Q cos
θ
(1/
σ
) d
σ
/d(-Q cos
θ
)
Data
Fit
0
0.25
0.5
0.75
1
-1
-0.5
0
0.5
1
Figure 4: Normalized angular distribution of the tagged Z → c¯c events at √s = 91.2 GeV, corrected for acceptance and background subtracted. The dots with error bars are data while the dashed line is the result of the fit.
√
s
–
(GeV)
A
c
FB
ALEPH
-0.2
-0.1
0
0.1
0.2
90
92
94
Figure 5: AcF B as a function of the centre of mass energy. The dots with error bars
are the measured asymmetries. The curve is the prediction of the Standard Model with mt= 175 GeV/c2, mH = [90, 1000] GeV/c2 and αs = 0.120.