Analysis of Airside Operations at Singapore
Changi Airport
by
Kai Ling Neo
MASSACHUSETS INSTITI ITE
OF TECHNOLOGY
JUL 1
0
2019
LIBRARIES
;0 0 C/)B.Sc. Economics, London School of Economics and Political Science
(2017)
Submitted to the Department of Civil and Environmental Engineering
in partial fulfillment of the requirements for the degree of
Master of Science in Transportation
at the
MASSACHUSETTS INSTITUTE OF TECHNOLOGY
June 2019
@
Massachusetts Institute of Technology 2019. All rights reserved.
Signature redacted
A u th o r ...
Department of Civil and Environmental Engineering
May 17, 2019
C ertified by ...
Signature redacted
Hamsa Balakrishnan
Professor of Aeronautics and Astronautics
A ccepted by ...
Thesis Supervisor
Signature redacted
Heidi Nepf
Donald and Martha Harleman Professor of Civil and Environnental
Engineering
Chair, Graduate Program Committee
Analysis of Airside Operations at Singapore Changi Airport
by
Kai Ling Neo
Submitted to the Department of Civil and Environmental Engineering on May 17, 2019, in partial fulfillment of the
requirements for the degree of Master of Science in Transportation
Abstract
Air travel demand has been on an upward trend in recent years, and airports have thus become increasingly congested. To alleviate airport congestion, building new infrastructure such as runways to improve capacity is an obvious solution but it is
highly expensive and has a long lead time. In the short term, airport managers
and operators have to learn to utilize current capacity more efficiently instead. This begins with the understanding of the current operations and then identifying areas for improvement to better utilize the available capacity.
In this thesis, we present a data-driven approach to analyze airport surface oper-ations. The methodology is presented using data from Singapore's Changi Airport, one of the busiest airports in the world and a major transportation hub for South-east Asia. The current operations at the airport is characterized using multiple data sources to identify inefficiencies such as surface congestion and unsatisfactory runway occupancy times. Using the airport characterization, we develop queuing models for the departure process to estimate congestion-related delays and taxi-out times. The taxi-out time estimates from the queuing models have the potential to improve pre-dictability as well as aid in the decision making process to reduce congestion on the airport surface. In order to reduce congestion, many major airports around the world, including Changi Airport, are improving their capacity by adding additional runways. To better understand the impact of additional runways, we present a detailed capac-ity analysis with Changi Airport as a case study. Using empirical and theoretical capacity estimates, along with historical data on the impact of airport expansion from similar airports such as Charlotte Douglas International Airport, we estimate the short-term and long-term improvements in throughput at Changi Airport.
The analysis and models built in this thesis thus aim to aid Changi Airport's efforts in alleviating congestion in both the short term and the long term, by providing insights on areas for improvement for current operations and potential impacts of future operational decisions.
Thesis Supervisor: Hamsa Balakrishnan
Title: Professor of Aeronautics and Astronautics
Acknowledgments
First and foremost, I'd like to thank my amazing advisor Prof Hamsa Balakrishnan, for her invaluable guidance these two years. Her kindness, patience, brilliance and strength are qualities I can only hope to emulate. I've learnt so much from her, and she has been a source of inspiration for me as a young woman.
I'd also like to thank Changi Airport Group. Their generous funding has not only enabled me to learn from the very best, but also allowed me to travel and experience what this world has to offer. I'd also like to thank them for kindly providing the data sets that made this thesis possible.
I am incredibly blessed to have beautiful friends, here in Cambridge and back in
Singapore, accompanying me on this journey. Without their support, I'd not have survived these two years of graduate school. I'd first like to thank my lab mates for all the laughter and fun these past two years. Max has been my happy pill this past year - he always offered a listening ear so readily and there's never a dull moment with him. I remember fondly our trip to Chicago, and I hope we can go on many more trips in the future. I'd also like to thank Sandeep - he laboriously read through my thesis and offered me so much help these two years. This thesis would not have been possible without him. I'm glad to have met a kind and steady friend like him.
I'd also like to thank my best friend back in Singapore, Minchih, for always lending
me a listening ear and offering me advice so readily. Here's to 11 years of friendship!
I'd also like to thank my friends, An and Kevin, for being my two constants in
Sidpac. Thank you for always making such good food for me, I'm very lucky to be your regular dinner guest. A big thank you to Kevin, for always being such a great listener and steady friend. Without a soju drinking buddy like you, grad school would have been a lot more sober. Thank you An, for always being there to support me in every way possible. Getting to know you so well this past year has been my utmost pleasure. I'll always remember all the fun crazy times we share together. I hope we can be in touch for years to come, no matter where we end up.
My two years at MIT wouldn't have been complete without my program mates (a 5
huge shout out to Akash and Shraddha) and also Leo, who taught me so much and is someone I hold very dear. I'm grateful to all the amazing people I have met at MIT - there's way too many for me to list but you guys know who you are. Thank you all for shaping my MIT experience so positively.
Last but not least, I'd like to thank my family. I had the privilege of growing up in such a great family that is always so keen to provide. I never felt limited - I could
try anything I wanted and I know they'll always be there to support me. My parents have been the best role models and my brother has been the dorkiest and kindest older brother I could ask for. Thank you so much for everything, I love you guys.
Contents
1 Introduction
1.1 M otivation. . . . . 1.2 Thesis O utline. . . . .
2 Changi Airport
2.1 Overview of Changi Airport . . . . 2.2 Data Sources from Changi Airport . . . .
2.2.1 Airport Operational Data . . . . 2.2.2 Aircraft Track Data . . . .
3 Characterization of Current Airport Surface Operations 3.1 General Statistics of Changi Airport . . . . 3.2 Surface Operations Analysis: Using Aircraft Track Data . . . 3.2.1 Runway Occupancy Times . . . .
3.2.2 Surface Congestion Hotspots . . . .
3.2.3 Runway Queues . . . . 3.2.4 Rapid Exit Taxiway Usage . . . .
3.2.5 Taxiway Routes . . . .
4 Queue Model for Airport Surface Operations
4.1 Literature Review: Airport Departure Process Modeling
4.2 Queueing Network Model . . . . 4.2.1 Single Class Queues . . . .
7 17 17 18 19 19 21 21 22 25 26 29 30 32 34 36 37 41 42 44 44
4.3
4.4
4.5
4.2.2 Queueing Network . . . . Queue Model for Changi Airport . . . . 4.3.1 Model Inputs and Outputs . . . . 4.3.2 Queueing Network . . . .
4.3.3 Analytical Queueing Network Model for Changi Airport . . .
Model Performance under North-flow . . . . 4.4.1 Model Performance: Original Model (Model 1) . . . .
4.4.2 Model Performance: Additional Conditioning on Departure Fleet
M ix (M odel 2) . . . .
4.4.3 Model Performance: Additional Conditioning on Arrival Fleet
M ix (M odel 3) . . . . Model Performance under South-flow . . . . 4.5.1 Model Performance: Original Model (Model 1) . . . .
4.5.2 Model Performance: Additional Conditioning on Departure Fleet
M ix (M odel 2) . . . .
4.5.3 Model Performance: Additional Conditioning on Arrival Fleet
M ix (M odel 3) . . . .
5 Airport Capacity Analysis: Impact of Additional Runway
5.1 Literature Review: Capacity Estimation and Representation
5.2 Current Achieved and Theoretical Capacity of SIN . . . . . 5.3 Future Achieved and Theoretical Capacity of SIN . . . . 5.3.1 Future Theoretical Capacity of SIN . . . .
5.3.2 Measuring the Difference between Achieved and Th C apacity . . . .
5.3.3 Case Study: CLT . . . .
5.3.4 Case Study: EWR and DFW . . . .
5.3.5 Inferring Future Achieved Capacity of SIN . . . .
6 Conclusion 6.1 Sum m ary . . . . 71 72 . . . 74 . . . 77 . . . 77 eoretical 78 82 90 94 99 99 8 46 47 47 48 50 53 53 55 58 63 63 65 66 . .
6.2 Extensions and future work . . . . 100
THIS PAGE INTENTIONALLY LEFT BLANK
List of Figures
2-1 Diagram of Changi Airport Terminal and Airside Layout [12] . . . . . 2-2 A histogram of fraction of time missing from arrival flight tracks . . .
2-3 A histogram of fraction of time missing from departure flight tracks .
3-1 Percentage of IMC weather throughout the day . . . .
3-2 Runway occupancy time of arrival flights in the dataset . . . . 3-3 Runway occupancy time of arrival flights in dataset without the outlier 3-4 Average speed (in knots) of arrival flights on the surface . .
3-5 Average speed (in knots) of departure flights on the surface
3-6 Runway Queues in Area 1 (02C) . . . . 3-7 Runway Queues in Area 1 (02L) . . . . 3-8 Rapid Exit Taxiway Usage . . . . 3-9 Example of several arrival flight tracks on the surface . . . . 3-10 Example of several departure flight tracks on the surface . .
4-1 Airport system diagram [13] . . . . 4-2 Singapore Airport Layout [31] . . . . 4-3 Queueing Network Representation of Changi Airport . . . . 4-4 Mean service rate and mean service time of departure runway queue . 4-5 Actual and predicted taxi-out time distributions under North-flow (Model
1)... ...
4-6 Actual and predicted queue length distributions under North-flow (Model
1)... ...
4-7 Fraction of heavy aircrafts (in 15-minute intervals) throughout the day
11 20 23 23 28 31 32 . . . . . 33 . . . . . 34 . . . . . 35 . . . . . 36 . . . . . 37 . . . . . 38 . . . . . 39 42 48 49 51 54 55 56
4-8 Relative demand of departures and arrivals throughout the day . . . 56
4-9 Actual and predicted taxi-out time distributions under North-flow (Model
2)... ... 57
4-10 Actual and predicted queue length distributions under North-flow (Model
2)... ... 58
4-11 Regression Tree . . . . 61
4-12 Actual and predicted taxi-out time distributions under North-flow (Model
3)... ... 62
4-13 Actual and predicted queue length distributions under North-flow (Model
3)... ... 62
4-14 Actual and predicted taxi-out time distributions under South-flow (Model
1)... ... 64
4-15 Actual and predicted queue length distributions under South-flow (Model
1) . . . . 6 4 4-16 Actual and predicted taxi-out time distributions under South-flow (Model
2)... ... 65
4-17 Actual and predicted queue length distributions under South-flow (Model
2)... ... 66
4-18 Regression Tree . . . . 68
4-19 Actual and predicted taxi-out time distributions under South-flow (Model
3)... ... 69
4-20 Actual and predicted queue length distributions under South-flow (Model
3 ) . . . . 6 9
5-1 Empirical and theoretical capacity envelopes for SIN with 2 runways . 76 5-2 Current and future empirical and theoretical capacity envelopes for SIN 79
5-3 Graphical Representation of Perpendicular Distance between Achieved
and Theoretical Envelope . . . . 81
5-4 Graphical Representation of Difference in Number of Departures
(Ver-tical Distance) between Achieved and Theore(Ver-tical Envelope . . . . 82
5-5 5-6 5-7 5-8 5-9 5-10 5-11 5-12 5-13 CLT airport layout [32] . . . .
Theoretical Capacity Before and After 3rd Parallel Runway .
Empirical and Theoretical Capacity in 2009 and 2010 . . . .
Theoretical and empirical capacity envelopes in 2010 . . . . Theoretical and empirical capacity envelopes in 2018 . . . .
EW R Airport [10] . . . .
DFW Airport [9] . . . .
EWR's achieved and theoretical capacity envelopes . . . . . DFW's achieved and theoretical capacity envelopes . . . . .
13 . . . . 83 . . . . 85 . . . . 86 . . . . 87 . . . . 88 . . . . 91 . . . . 92 . . . . 93 . . . . 94
THIS PAGE INTENTIONALLY LEFT BLANK
List of Tables
3.1 Top 8 airlines ranked by percentage of operations . . . . 26 3.2 Top 8 aircraft types ranked by percentage of operations . . . . 27 3.3 Percentage of departure and arrival operations on 02L and 02C under
N orth-flow . . . . 28
3.4 Percentage of departure and arrival operations on 20C and 20R under South-flow . . . . 29 3.5 Unimpeded and mean taxi-out and taxi-in times under North-flow . 29 3.6 Unimpeded and mean taxi-out and taxi-in times under South-flow . 29 3.7 Rapid Exit Taxiway Usage . . . . 38
4.1 Taxi-out time prediction performance under North-flow (Model 1) . . 54
4.2 Queue length prediction performance under North-flow (Model 1) . . 55
4.3 Taxi-out time prediction performance under North-flow(Model 2) . . 57
4.4 Queue length prediction performance under North-flow (Model 2) . . 58
4.5 Taxi-out time prediction performance under North-flow (Model 3) . . 59
4.6 Queue length prediction performance under North-flow (Model 3) . . 59
4.7 Taxi-out time prediction performance under South-flow (Model 1) . . 63
4.8 Queue length prediction performance under South-flow (Model 1) . . 63
4.9 Taxi-out time prediction performance under South-flow(Model 2) . . 65
4.10 Queue length prediction performance under South-flow (Model 2) . . 66
4.11 Taxi-out time prediction performance under South-flow (Model 3) . . 67
4.12 Queue length prediction performance under South-flow (Model 3) . . 67
5.1 Total arrivals and departures in CLT under VMC and figuration . . . .
5.2 Metric 1 (3-point ratio) across all 3 periods . . . . 5.3 Metric 2 (WANED) across all 3 periods . . . .
5.4 Metric 3 (WADD) across all 3 periods . . . .
5.5 Metric 1 (3-point ratio) for EWR and DFW . . . . . 5.6 Metric 2 and 3 for EWR and DFW . . . . 5.7 Metric 1 (3-point ratio) for SIN . . . . 5.8 Metric 2 and 3 for SIN . . . .
North-flow con-84 88 89 89 92 94 95 95 16
Chapter 1
Introduction
1.1
Motivation
With rising demand for air travel, airports are becoming increasingly congested and
passengers are experiencing growing delays. It is increasingly essential to alleviate congestion both in the short term and the long term, to minimize the negative impact on passengers and also to improve their experience. Greater efficiency in utilizing cur-rent capacity has to be achieved in the short term. To do so, it's important for airport operators and managers to first understand and characterize current operations, and then identify areas for improvement and implement remedial measures. Examining and analyzing the large amounts of airport operational data generated each day is a good place to start. An overwhelming amount of airport operational data is generated daily at airports from a number of sources such as aircraft, check-in counters, immi-gration checkpoints, airfields, and even toilets. The data from these sources have a significant potential for evaluating and improving the efficiency of airport operations.
However, such data-driven analysis of airport operations has largely been unexplored due to the inaccessibility of operational data to researchers.
To alleviate congestion in the long term, airport operators and managers have to look to increasing terminal and airfield capacity. Examining data from current
operations could shed light on the impacts of adding capacity at various checkpoints in airports, and could hence aid in the decision-making process for future operations.
Hence, in this thesis, we examine the data generated at Singapore Changi Airport, as it is one of the most congested airports in the region and it has plans for capacity expansion in the future. Its data is analyzed to first, understand current operations and identify areas for improvement. It is hoped that these analyses will not only provide fresh insights to airport operators and managers, but also serve as a proof-of-concept for how these data could be used in the future to improve current operations. Furthermore, given Changi Airport's plans to further expand its capacity, this thesis aims to utilize Changi Airport's data to infer the effects of capacity expansion and hence help guide operators in their decision-making process.
1.2
Thesis Outline
The outline of this thesis is as follows: Chapter 1 presents the motivation and outline of this thesis, while Chapter 2 provides an overview of Changi Airport and the various data sets its operators/managers have provided. In Chapter 3, aircraft track data are examined to characterize current airport surface operations. Various metrics are analyzed to provide a well-rounded understanding of current surface operations. They also provide guidance on how airport operators/ managers at Changi Airport could use this data to understand and track surface operations performance in the future. Subsequently, various queue models for airport surface operations are introduced in Chapter 4. These models aim to model airport surface operations and provide good forecasts of surface congestion at Changi Airport, which could prove to be useful in planning for future operations. The performance of these models are also assessed. Chapter 5 of this thesis aims to predict future achieved throughput after the planned addition of a third runway at Changi Airport. This analysis is conducted by examining the current theoretical and achieved throughput at Changi Airport, looking at case studies of other similar airports, and thereby inferring the future achieved throughput at Changi Airport. Lastly, Chapter 6 provides a summary of the analyses done in this thesis and the future research that could follow.
Chapter 2
Changi Airport
2.1
Overview of Changi Airport
Changi Airport is the main civilian airport of Singapore and one of the biggest trans-portation hubs in Southeast Asia. The airport serves more than 100 airlines, handling about 1,022 flights/day and 62.2 million passengers in 2017 [4]. Changi Airport is currently comprised of four main terminals, with a total capacity of about 82 million passengers per annum (mppa) [18]. The airport has two independent parallel runways and operates under two broad runway configurations: North-flow (02L, 02C I 02L,
02C) and South-flow (20C, 20R I 20C, 20R).
Given Changi Airport Group's philosophy of building capacity ahead of demand, adding capacity to the existing airport infrastructure has been in the planning. It has been predicted that the Asia Pacific region is set to be the main engine of growth in air travel demand in the next 20 years [16]. Such trends and forecasts necessitate capacity expansion in preparation for rapid air travel demand growth in the region. As such, the addition of a fifth terminal and a third runway to Changi Airport has been in the planning since 2013. The third runway (02R/20L) was previously a runway used by the military and is currently being converted into a civilian runway, while the fifth airport terminal is planned to be positioned between 02C/20C and 02R/20L. These developments are expected to push Changi Airport's capacity to more than 135 mppa.
A diagram of the future layout of Changi Airport with these new developments can 19
be seen in Figure 2-1.
Figure 2-1: Diagram of Changi Airport Terminal and Airside Layout [12]
Changi Airport has often been recognized as one of best airports in the world, a result of its strong focus on service and innovation. Changi Airport Group, the operator and manager of Changi Airport, often incorporates technology into its daily operations to not only improve business performance and efficiency, but also to de-liver personalized services to customers. The airport also aims to delight passengers with positively surprising experiences in the airport, and it believes in reinventing air-ports as a destination rather than a mere travel node. To that end, Changi Airport Group has hence built Jewel Changi Airport, a lifestyle destination within the air-port compound that provides an eclectic mix of retail and dining options with unique attractions. Given Changi Airport's strong focus on passenger experience, Changi Airport has won more than 580 airport awards to date, making it one of the most awarded airports in the world [5].
2.2
Data Sources from Changi Airport
In order to improve airside operations and enhance passenger experience, Changi Airport Group has been keen to analyze the vast amount of data generated at Changi Airport. There are two main sources of data provided by Changi Airport Group: Airport Operational Data and Aircraft Track Data. The analysis presented in this thesis is based on these two data sources. Brief descriptions of the data sets are presented next.
2.2.1 Airport Operational Data
The Airport Operational Data provides a wealth of information about airport-wide operations at key checkpoints. This data is obtained from the Flight Information Central System Upgrade (FCSU) in Changi Airport, which is the central system used to manage the end-to-end process for a flight. The FCSU is linked to various down-stream sub-systems to acquire different information such as the gate assignment for flights (from the Gate Management System), on-block times (from Aircraft Docking Guidance System), target times for Airport Collaborative Decision Making (A-CDM), and even the estimated arrival times (from airline systems).
The Airport Operational Data contains flight specific information that includes crucial surface data like wheels-on time, wheels-off time, gate-in time, and gate-out time for each flight. It also provides information on aircraft type, gate assignment, and runway assignment. Taxi-out and taxi-in times are also detailed in this data set, which helps to inform the level of congestion on the surface and the unimpeded taxi-out and taxi-in times in the absence of congestion. These data elements allow us to develop models for the traffic movement on the airport surface, which is discussed later in Chapter 4. Changi Airport Group has provided 8-months worth of airport
operational data (January - March 2017 and January - May 2018).
The aircraft type information in the Airport Operational Data is not available for a good fraction of flights. However, the aircraft type information is critical in determining fleet mix and estimating airport capacity. Attempts were made to impute
these missing entries with their corresponding aircraft types in the following way: For each flight, its airline and aircraft number were compared to that of other flights with known aircraft types and if there was a match, the flight with missing aircraft type would be imputed with this flight's aircraft type. This method has reduced the number of flights with missing aircraft type by more than 80%.
Not only does this dataset include airside surface data, it also includes data on baggage handling (e.g. first bag/last bag time), gate assignment and gate operations (e.g. gate open/ gate close time), and check-in counters. For the purpose of this thesis, we consider only the airside surface data to inform the discourse on current airside operations performance and future airside operations.
2.2.2
Aircraft Track Data
The Aircraft Track Data provides each aircraft's location on the airport surface via latitude and longitude coordinates, speed, heading and altitude, sampled at a fre-quency of 1Hz. The track data is obtained from the Advanced Surface Movement Guidance and Control system (A-SMGCS), which consists of a surveillance system that records the position of aircraft using multilateration sensors [20]. This data stream is similar to ASDE-X data. The track data could be used to infer many oper-ational parameters such as taxi-routes, congestion hotspots, runway occupancy time and rapid exit taxiway usage.
However, it is worth noting that the aircraft track data has its imperfections. First, only a limited amount of track data was provided by Changi Airport Group and hence the track analyses presented in this thesis are not conclusive. Second, a good proportion of flights have a significant proportion of their on-surface flight tracks missing, which could affect the resultant analysis. If more than half of a flight's track is missing, using just the small fraction of data available could be misleading when inferring queue sizes and hotspots. In order to assess the quality of the data, the fraction of time missing in each flight track provided is examined. For arrivals, the time between landing time and on-block time is the period of concern whereas for departures, it is the time between off-block time and takeoff time. Majority of arrival
flights have relatively complete flight tracks, with 65% of arrival flights with lesser than 50% of their flight tracks missing (as presented in Figure 2-2). Whereas for departing flights, only slightly more than 50% of flight have lesser than 50% of flight tracks missing (as presented in Figure 2-3). This could be attributed to the fact that many pilots do not turn on their transponders immediately after pushback. Hence, it is important to be cognizant of these data imperfections while conducting the analyses.
Fraction of time missing- Arrivals
0.1 0.2 0.3 04 0.5
fraction of time missing
Figure 2-2: A histogram of fraction of time missing from arrival flight tracks
Fraction of time missing- Departures
14
12
11)
0. 71.2 03 0.4 0.5 06 .7 0n8 0.9
Frrtion of time miss.ng
Figure 2-3: A histogram of fraction of time missing from departure flight tracks
23
20
10
THIS PAGE INTENTIONALLY LEFT BLANK
Chapter 3
Characterization of Current
Airport Surface Operations
Characterizing airside operations allows us to identify inefficiencies and develop strate-gies to improve performance. Improving efficiency is important, as building additional capacity takes time and hence enhancing efficiency in use of current capacity is a good short to medium term solution to rising delays associated with mounting demand. In this chapter, a general overview of Changi Airport's (SIN) airside operations will first be presented to gather a deeper understanding of the aircraft and airline mix at the airport, the weather conditions, the proportion of operations in each runway config-uration alongside many other metrics. Subsequently, the aircraft track data will be analyzed to assess things like runway occupancy times and rapid exit taxiway usage to gain understanding of the current state of airport surface operations. The analysis using the track data was done for just a four-hour period on a single day because of limited data availability, making it difficult to draw conclusions about current air-port surface operations. However, these analyses provide a good proof-of-concept, explicating how such aircraft track data could be used in the future to help with current and future airside operations planning. Hence, the aim of this chapter is to not only use current (albeit limited) data to characterize current operations, but also to demonstrate how such data could be used in the future to understand and improve operations.
3.1
General Statistics of Changi Airport
Changi Airport Group (CAG) constantly seeks to enhance its air hub connectivity, and it is currently serving more than 100 airlines and over 400 cities worldwide [6]. Table 3.1 shows the top 8 airlines, ranked according to their percentage of operations. Here, number of operations is defined as the total number of arrival and departure flights. These top 8 airlines are responsible for 62.5% of the operations in SIN. The top 3 airlines, which account for 44.5% of operations in SIN, are expectedly airlines owned and based in Singapore. Both Scoot TigerAir and SilkAir are subsidiaries of Singapore Airlines.
Rank Airline Percentage of Operations
1 Singapore Airlines 22.0
2 Scoot TigerAir 11.4
3 SilkAir 11.1
4 Jetstar Asia Airways 7.6
5 AirAsia Berhad 3.8
6 Garuda Indonesia 2.5
7 PT. Indonesia AirAsia 2.2
8 FlyFirefly Sdn. Bhd 1.9
Table 3.1: Top 8 airlines ranked by percentage of operations
The airport handles different aircraft types, with a significant fraction (44.7%) belonging to the 'Heavy' category under wake vortex separation rules. Table 3.2 shows the top 8 aircraft types, ranked according to their percentage of operations. The top 2 aircraft types belong to the 'Large' category and account for 42.2% of operations.
In addition to fleet mix, weather conditions can also greatly affect the capacity of an airport. Airport capacity is defined as the number of aircraft movements (arrivals and departures) that can be performed in the airport in a fixed time interval (e.g. an hour, 15 minutes). Hence, it is necessary to understand weather conditions at
SIN to characterize airside operations. There are two main weather categories -Visual Meteorological Conditions (VMC) and Instrumental Meteorological Conditions
26
Rank Aircraft Type Percentage of Operations 1 A320 27.5 2 B738 14.7 3 A333 9.0 4 B77W 7.0 5 B772 4.7 6 A359 3.9 7 A388 3.2 8 B773 2.5
Table 3.2: Top 8 aircraft types ranked by percentage of operations
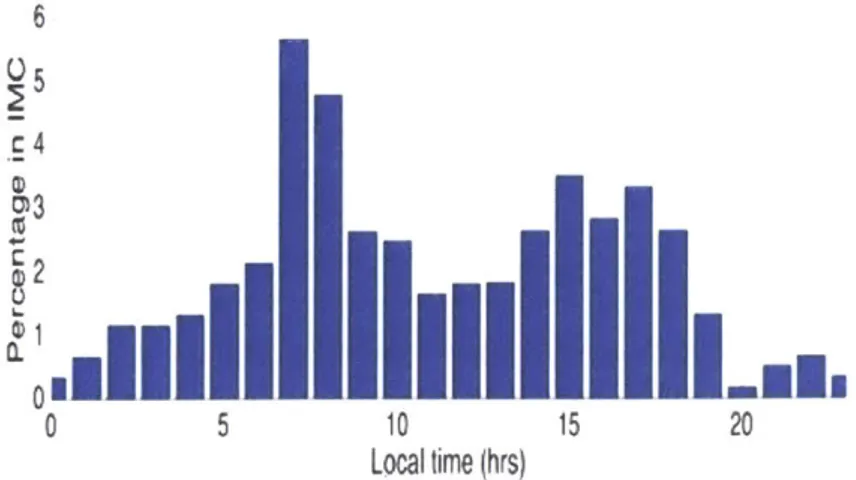
(IMC). The former refers to weather conditions where there's sufficient visibility for pilots to maintain visual separation from other aircraft, whereas the latter refers to weather conditions that necessitate the use of instruments to maintain separation. Data about weather at SIN was gathered from METAR reports and analyzed to learn the typical weather conditions at SIN throughout the day. Using two-year data from 31st December 2016 to 31st December 2018, the percentage of IMC weather in each hour of the day was calculated and presented in Figure 3-1. It is usually mostly VMC throughout the day in SIN, except for mornings (7.00 to 8.00 am) and evenings
(3.00 to 5.00 pm) where percentage in IMC is higher than usual. This could be due
to morning mists or afternoon thunderstorms, which are common in Singapore. The other important factor that drives the airport capacity is the runway configu-ration [15]. The airport operates under two broad runway configuconfigu-rations: North-flow (02L, 02C I 02L, 02C) and South-flow (20C, 20R
I
20C, 20R). North-flow is thepre-dominant runway configuration, with about 90% of the operations. In North-flow configuration, arrivals primarily use runway 02L whereas departures use 02R (Table
3.3) and mixed operations is a rare occurrence. Similarly, under South-flow, mixed
operations rarely occur, where most of the departure operations occur on runway 20C and most of the arrivals on 20R. As such, it is clear that most of the arrivals occur on the same runway on 02L/20R and most departures on 02C/20C.
After characterizing the percentage of operations on each runway under both runway configurations, we would want to then examine the performance of airside
6 0 5 .~4 C 82 01 0 5 10 15 20 Local time (hrs)
Figure 3-1: Percentage of 1MC weather throughout the day Runway Dept.(%) Arr.(%)
02L 13.3 82.3 02C 87.7 17.6
Table 3.3: Percentage of departure and arrival operations on 02L and 02C under North-flow
operations under each configuration by looking at the mean and unimpeded taxi times. Unimpeded taxi time is defined by the FAA as the taxi time under optimal
operating conditions, when neither congestion, weather nor other factors delay the aircraft during its movement from gate to runway or vice versa [8].
The unimpeded taxi-time for a particular gate-runway pair is determined by con-sidering the 10th percentile of the empirical taxi-time distribution for that pair. The average unimpeded time for a runway configuration is determined by computing the weighted average unimpeded time over all gate-runway combinations, with the weights representing the number of operations for a particular gate-runway pair. Table 3.5 and Table 3.6 present the unimpeded and mean taxi times under the two runway configurations. We see that taxi-in times tend to be shorter than taxi-out times un-der both runway configurations. In addition, the unimpeded taxi-out/ taxi-in times
Runway Dept.(%) Arr.(%)
20R 94.0 15.6
20C 6.0 84.4
Table 3.4: Percentage of departure and arrival operations on 20C and 20R under South-flow
under both runway configurations are similar, as expected given the terminal-runway layout. Mean taxi-out time is slightly longer under North-flow.
Statistics (North-flow) Taxi-Out Times (min) Taxi-In Times (min)
Unimpeded 12.5 3.2
Mean 17.1 6.3
Table 3.5: Unimpeded and mean taxi-out and taxi-in times under North-flow
Statistics (South-flow) Taxi-Out Times (min) Taxi-In Times (min)
Unimpeded 12.4 3.3
Mean 15.6 6.6
Table 3.6: Unimpeded and mean taxi-out and taxi-in times under South-flow
3.2
Surface Operations Analysis: Using Aircraft
Track Data
Improving efficiency is important, as building additional capacity takes time and hence enhancing efficiency in use of current capacity is a good short to medium term solution to rising delays associated with mounting demand. In this section, various aspects of airside operations will be analyzed using aircraft track data from SIN. With more data available in the future, such analyses could be emulated, and used to understand current state of airside operations at SIN and identify where and when inefficiencies or problems arise in airside operations.
3.2.1
Runway Occupancy Times
CAG has been concerned with reducing runway occupancy times (ROT), as it could
increase arrival throughput and efficiency in runway usage. ROT here refers to the time taken for an arriving aircraft to touch down and exit the runway. CAG has hence launched campaigns with its airline partners to encourage reduction in arrival ROT. As such, it is thought to be useful to analyze current arrival ROT, to track performance of each airline in terms of ROT and also introduce it as a new metric for airline performance at the airport eventually. It could also be used to assess the efficacy of these ROT improvement campaigns.
Using the aircraft track data, the time when each aircraft exits the runway is derived by interpolating each aircraft's track to get latitude and longitude coordinates per second and then identifying the instance where the aircraft's location is outside of the runway after touch down. Subsequently, the ROT is derived by taking the difference between the aircraft's runway exit time and its touch down time.
Mean arrival ROT is found to be 47.28 seconds and the median is 32.0 seconds. From Figure 3-2, there is an evident outlier in this dataset, where its ROT is as long as 526 seconds. This could be attributed to data collection error or some special circumstance, which would probably not translate to other flights.
Not all flights' ROT can be derived, as some flights have missing flight track on the runway and thus it is not possible to deduce how long they were on the runway. Furthermore, some flights have touch down times after the runway exit time, which is probably due to data collection error.
Since there's an outlier, further analysis is done without it to gain understanding of the usual arrival ROT performance. Without the outlier, the mean and median arrival ROT are 34.68 and 32.0 seconds respectively. Evidently and expectedly, the mean is now lower without the outlier.
Even though CAG is interested in improving arrival ROT performance to increase arrival throughput, it is evident from the mean and median ROT that any further improvement in the runway occupancy times of majority arrival aircraft will have no
30
Runway Occupancy Time (including outliers)
10 - 4I-2 0 0 100 200 300 400 500ROT (in seconds)
Figure 3-2: Runway occupancy time of arrival flights in the dataset
effect on arrival throughput. This is because the minimum separation time between two arriving aircrafts (of any aircraft type) exceeds the mean and median ROT at SIN. As such, it might be more helpful to look at the flights with high ROT that exceeds minimum separation time and have a more targeted ROT campaign that aims to reduce ROT of these flights. In our dataset, two aircraft have ROT more than 60 seconds, which is the minimum separation time between a leading 'Large' aircraft and a trailing 'Heavy' aircraft. However, both are 'Heavy' aircraft and hence no matter the type of the trailing aircraft, the minimum separation time is greater than their runway occupancy time. As such, in this dataset, it is evident that no further improvements in ROT will lead to improvements in arrival throughput.
Nonetheless, this analysis informs CAG of the need to focus their campaign efforts since most flights' ROT do not exceed the minimum separation time between arrivals and hence a reduction in ROT for most flights will not result in increased arrival
E Z4 8- 6- 4-0
Runway Occupancy Time
(without
outliers)
1-0
1 , , , .
10 20 30 40 50 60
ROT (in seconds)
Figure 3-3: Runway occupancy time of arrival flights in dataset without the outlier throughput. Instead, when analyzing ROT of flights, CAG should focus on the flights with high ROT and if the ROT does exceed the minimum time separation between that flight and its trailing flight, CAG should then have a more targeted campaign towards those flights' airlines to encourage ROT reduction.
3.2.2 Surface Congestion Hotspots
In order to identify the key congestion hotspots on the airport surface, a map of average speed of the aircraft on the airport surface is plotted. To do so, the aircraft track data was organized by latitude and longitude coordinates and for each unique latitude-longitude coordinate, the average speed of aircraft whose speed have been logged for those coordinates will be calculated. Speeds of greater than 30 knots are removed in the process of constructing these plots, as that would mean the flights are either accelerating for takeoff or decelerating after landing, which is of no concern for
the purpose of this analysis.
In such average speed plots, it's evident which areas on the airport surface have slower average speeds (as indicated by the color of the points in that area) and are hence congestion hotspots. The congestion hotspots for arrival operations tend to be around the taxiways that funnel directly from the rapid exit taxiways to other taxiways closer to the terminal area. Furthermore, average speed plots for arrivals in particular also reveal the rapid exit taxiways and runways used in arrival operations. As seen in Figure 3-4, the main rapid exit taxiways used can be easily identified with such a plot. The rapid exit taxiways are identified and labeled in red.
1 33 1 34 1 35 Latitude1 36 ' 37 143 9; 103 975 03 103 99 104
Figure 3-4: Average speed (in knots) of arrival flights on the surface
On the other hand, average speed plots for departures not only reveal areas of congestion on the taxiways while departing flights taxi-out, but also reveal areas where runway queues build up (indicated and labeled in red in Figure 3-5). It is useful to know where runway queues build up, as it aids the analysis of runway queues over time using aircraft track data, which will be detailed in the subsequent
33 20 16 14 -12 101 4 2 0 -- A-|
subsection. 1.33 1.34 1.35 Latitude 1.36 1.37 1.38 103.97 103.975 103.98-0103.985 103.99 103.995 104
Figure 3-5: Average speed (in knots) of departure flights on the surface
3.2.3
Runway Queues
Analyzing runway queues over time-of-day is essential in understanding the peak hours in airside operations, where taxi times are longer and more delays are expected. This could prove useful for current and future operations planning, where for example, pushback schedules could be adjusted either strategically or tactically in view of runway congestion at certain times of the day.
To model runway queues over time using aircraft track data, areas of the taxiways where runway queues are most likely to build up are first identified, as shown earlier in Figure 3-5, where the two red boxes represent the areas where runway queues build up. Subsequently, the aircraft tracks are used to determine the runway queue length by counting the number of aircraft in those queuing boxes.
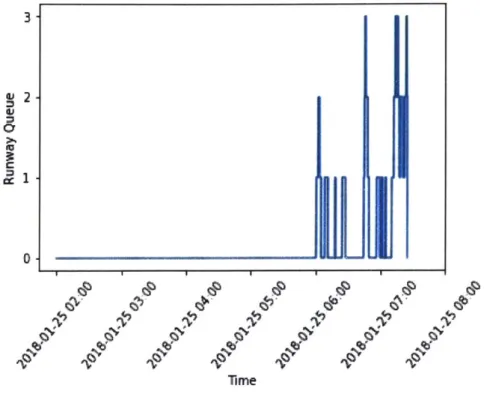
Figure 3-6 shows the runway queue length for 02C. There is no queue in that area 34 20 18 16 14 12 10 8 6 4 2 0
before 6.00 am. This is expected, as Changi Airport shuts down one runway from
3.00 to 6.00 am each day. From 6.00 to 7.30 am, queues of length 1, 2 or 3 (unit:
number of aircraft) are observed from the aircraft track data.
3-> 1 cc 0-QV 'V 'V Time lip If 'V
Figure 3-6: Runway Queues in Area 1 (02C)
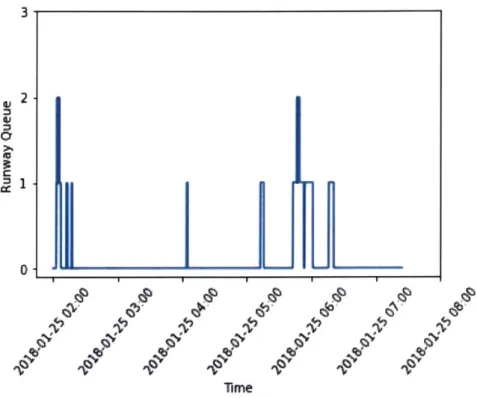
Subsequently, for area 2 where aircraft queue to depart from runway 02L, there are queues before 6.00 am (Figure 3-7), and the queues are at most of length 2. Since 02L is primarily used for arrivals, one would expect and observe a smaller queue length. Due to limited track data that does not span the entire day of operations, we are not able to look at queue length at other times of day.
35
_____BhILRIl
3-
2-1
0-I', Df~ ime
Figure 3-7: Runway
Queues
in Area 1 (02L)3.2.4
Rapid Exit Taxiway Usage
Rapid Exit Taxiway (RET) usage is of interest to CAG, as it helps them to understand trends in taxiway usage and hence use them to plan for future runway operations with the existing two runways and also the additional runway they are building.
Using the aircraft track data, each aircraft's track is interpolated to get latitude and longitude coordinates of each aircraft on the surface per second. Each of these aircraft's track is then combed through to see if any part of the track lies on any of the RETs. The coordinates of each RET is derived from the airport layout and then used in the aforementioned procedure to determine RET usage. It is worth noting that because the time period over which data is available is so short, only certain RETs seem to be used. A bigger time period could and most probably would include other existing RETs.
In this small set of data, we see that majority of the arrival flights use rapid exit taxiway W5, followed by W4. This is presented in Table 3.7 and Figure 3-8. Rapid exit taxiways W3 - W5 are more commonly used as compared to E3 - E5, since
35 - 4-.z
E
30 25 20 15 105-
0-Usage of rapid exit taxiways
W3 W4 W5 E3
Rapid exit taxiways
E5
Figure 3-8: Rapid Exit Taxiway Usage
arrivals primarily use 02L/20C. As W5 is the first exit, followed by W4 and then W3, runway occupancy times drop as more flights use W5 to exit. Hence, it is desirable for more flights to exit using W5 when landing on 02L/20C.
With more data, we can study trends in rapid exit taxiways usage more conclu-sively -for example, which rapid exit taxiways are used more frequently, what fraction of flights use which rapid exit taxiways, rapid exit taxiway usage over time-of-day and seasons. Knowing such trends in rapid exit taxiway could be beneficial in future air-side operations planning, especially when planning the addition of the third runway at SIN.
3.2.5
Taxiway Routes
Understanding the taxiway routes taken by pilots provides valuable information when planning future operations with the addition of the third runway and the transition
Rapid Exit Taxiways Count of Arrival Flights % of arrival flights (with RET usage data) W3 1 1.96 W4 12 24 W5 34 66.67 E3 1 1.96 E5 3 5.88
Table 3.7: Rapid Exit Taxiway Usage
period prior, so as to prevent potential disruptions to operations.
Figures 3-9 and 3-10 show the taxi-routes for five arrival flights and five departure flights, respectively.
Figure 3-9: Example of several arrival flight tracks on the surface
With more data, these aircraft track data could be used to study taxi route trends, and infer the impacts of adding a third runway on the route pilots may take and the consequent congestion spots on surface. We could also use this analysis to determine more efficient taxi-routes to reduce congestion on the airport surface.
38
Figure 3-10: Example of several departure flight tracks on the surface
THIS PAGE INTENTIONALLY LEFT BLANK
40
Chapter 4
Queue Model for Airport Surface
Operations
The airport surface is a complex system of taxiways, ramp areas and runways, with many working parts and factors that come into play and affect the performance of airport surface operations. The main components of the airport system are detailed in Figure 4-1, where it includes runways, gates, ramp area near gates and taxiway system connecting gates/ramp to runways. With Changi Airport building a third runway and the associated operational adjustments that will have to be made with the construction and transition, it is important to model current and future airport surface operations in order to understand and predict the impact on airport surface operations and its performance.
To that end, a queueing model is developed to model the airport surface, and to estimate taxi times as well as surface congestion in terms of the different queues on the surface. The queuing model of the existing 2-runway system is developed using eight
months of airport operational data (January - March 2017; January - May 2018).
The dataset is appropriately divided into a training set (for model development) and a test set (for validation). Such a model not only demonstrates the potential of such models in accurately representing current operations, but it is also useful for predicting impacts from any operational interventions. It is also essential for the planning of the third runway, where planners can extend this model to a 3-runway
- - I Entry Fix Arrival Paths Departure Paths Arrivals
unways Taxiways Ramp Gates
Departures
ATC
Figure 4-1: Airport system diagram [13]
model to understand and prepare for the associated impacts and operational changes. The queueing model built will be further illustrated in the following sections.
4.1
Literature Review:
Airport Departure
Pro-cess Modeling
There are two main categories of literature in airport departure process modeling. The first category centers on computing airport-related delays. Given that the run-way system is the main throughput bottleneck in the airport system
[15],
most of the literature in this category focuses on modeling runway-related delays with analytical queueing models. In these models, aircrafts taking off and landing are seen as cus-tomers to the runway queueing system and there's no consideration of any related delays in the other components of the airport system, e.g. taxiways. Kivestu [17] and Pyrgiotis et al. [23] computed delays in departures by considering delays at the42
runways under dynamic and stochastic conditions. Kivestu [17] modeled the runway system as a time dependent M/G/k queue and explored five different models to com-pute expected wait time in such a runway queueing system. Meanwhile, Pyrgiotis et al. [23] used a M(t)/Ek(t)/1 queueing system to model the runway system where service time is kth-order Erlang distributed and arrivals are a non-stationary Poisson process. Although such models cannot provide granular results/ analysis like predict-ing each aircraft's taxi-out time, they are advantageous for longer plannpredict-ing horizons as they produce quick and aggregate results on for example, expected decrease in de-lays from the addition of a new runway. There are also models that extend queueing analysis beyond the runway, where they incorporate other surface operations into the models, e.g. taxiway operations. Such models compute airport-related delays and are more representative of surface operations. An example of such a model is the De-tailed Policy Assessment Tool (DPAT), the first system-wide model that incorporates delays not only in the runways but also in the taxiways. There is also LMINET that incorporates taxiway delays by modeling it as a M/M/1 queue [19].
The second category focuses on predicting taxi-out times. In the initial papers, a lot of focus was placed on understanding the main factors that influence taxi-out times, and hence using them to predict taxi-out times. Shumsky [25] [26] identified several key explanatory variables such as departure demand and airline, and built a model using these variables to predict taxi times. However, the model presented does not consider stochasticity of the runway service process. Idris et al.[14] also looked at the causal factors that determine taxi-out time and created a statistical regres-sion model using these factors to predict taxi-out times. Despite understanding the main causal factors, these models do not consider the runway service process and the stochasticity of the departure process. Pujet et al. [22] developed a basic stochastic queueing model to address these concerns. In their paper, the runway service process is probabilistic and taxi time is defined as the combination of runway queueing time and travel time from gate to runway threshold. Taxi time for each airline in each runway configuration is modeled probabilistically. Simaiakis and Balakrishnan [27] further refined and built a more complete queueing model of the departure process,
where ramp and taxiway interactions were taken into consideration for a better reflec-tion of the complex departure process that involves multiple interacting queues. In their paper, new methods of deriving unimpeded taxi time, modeling runway service process and the ramp-taxiway interactions were introduced to better estimate runway and taxiway delays. Simaiakis and Pyrgiotis [30] then further extended this model
by incorporating the runway queueing engine by Kivestu [17] to create a powerful
model that generates the sequence at which aircrafts arrive at the runway, predicts the associated runway queueing delay and hence taxi-out times. Recently, Badrinath et al. [2] built an integrated surface-airspace model to produce a more complete rep-resentation of the departure process. The airport surface is represented as a queueing network, with consideration of queues at various points of the surface (e.g. taxiways/ ramps) and congestion due to both departures and arrivals. This allows prediction of not only taxi-out times, but also taxi-in times of arrivals as well as the various queues on the surface. The methodology used to model the airport surface in their paper will be adopted in this thesis to model Changi Airport.
4.2
Queueing Network Model
The pointwise stationary fluid flow approximation (PSFFA) model is adopted for the queueing network model in this thesis, and it draws on both the flow conservation principle as well as steady state queueing theory. This model was first presented by Badrinath and Balakrishnan [1] and further refined in Badrinath et al. [2], and it will be adopted and presented in the following section. In this section, the model for single queue will be presented first, followed by extension to queueing networks.
4.2.1
Single Class Queues
Let x(t) represent the average number of aircraft in the queue, and let fi(t) and f0(t)
represent the inflow and outflow rate of the queue at time t respectively.
i(t) = -fo(t) + fi(t) (4.1)
44
Equation (4.1) is derived from the flow conservation principle, and the terms in Equation (4.1) are all ensemble averages at a certain time instant. It illustrates that the change in average number of aircraft in the queue is the difference between inflow and outflow rate from the queue at time instant t.
The inflow rate into the queue at time t is equal to the average arrival rate into the queue, A(t). Meanwhile, the outflow rate depends on both the average service rate of the queue server as well as the average utilization of the server at time t. As such, fo(t) = p(t)p(t), where outflow rate is the product of average utilization (given
by p(t)) and average service rate (given by p(t)).
= -A(t)p(t) + A(t) (4.2)
G(x(t)) is then used to approximate average utilization, p(t). To approximate p(t), G(x(t)) must first fulfill the following conditions:
1. G(O) = 0 and G(oo) = 1
2. G(x) is strictly concave and non-negative, Vx
c
[0, oc)Condition 1 states that average utilization is 0 when average number of aircraft in queue is 0 and it is 1 when there is an infinite number of aircraft in the queue. On the other hand, Condition 2 represents congestion where average utilization of server increases at a decreasing rate with average number of aircraft in queue. As such, Equation (4.2) can be rewritten as:
=(t) -,p(t)G(x(t)) + A(t) (4.3)
where x(0) = xo To obtain an expression for G(x(t)), the Pollaczek-Khinchine formula (Equation (4.4)) is used and the steady state number of aircraft in the system is matched.
p2(1+C3)
Xs = P + (4.4)
2(1 - p)
Here, C, represents coefficient of variation, which is the standard deviation of service time distribution divided by the mean of service time distribution. Since G(x) approximates average utilization p(t), Equation (4.4) is manipulated such that
p is expressed in terms of x, giving us Equation (4.5).
x+l- fx2
+i2C~x+1
p(t) ~ G(x) = 1 - C (4.5)
G(x) is then further approximated by ix to get a simpler expression. The C
parameter is derived by minimizing the following expression:
min (G(x) - C )dx (4.6)
Here, Xm denotes the expected maximum number of aircraft in the queue. As such, we get the following ordinary differential equation (ODE) for queue length over time:
(t) = -(t) +t)x(t) A(t) (4.7) 1+C(t)x(t)
4.2.2
Queueing Network
As the airport surface is a complex system of interacting queues, it is important to extend the single queue model to a queueing network. Using the flow conservation principle, a queueing network is where the output of one queue is the input of another if they are connected. In this case, the ODE for queue length over time will look slightly different, where the routing of aircrafts from one queue to another would be considered. Let R be the routing matrix, and its elements ryj be the fraction of customers joining queue i after leaving queue
j.
CiX C Xj
xi(t)= -Pi(t) Cixi
+Ai(t)+
pI+ Cx rji (4.8) Furthermore, if we consider the travel time from one queue to another, we will then obtain the delay differential equation (Equation (4.9)), where Tji is the traveltime from server
j
to server Z.Cix- Cj(t - Tji)xj(t - -rii)
x -(t) +Ai(t)+Zp j(t-Tji) rCi(t-trji) (4.9)
1 + Ci I + Cj(t - --ri )x(t
(r.i)
4.3
Queue Model for Changi Airport
In this subsection, the queue model developed for Changi Airport will be elucidated. First, the model inputs and outputs and data sources will be detailed. Then, the model structure and the queueing network model specific to the airport surface layout of Changi Airport will be introduced.
4.3.1
Model Inputs and Outputs
The model structure is similar to the ones in Simaiakis and Pyrgiotis [30] and Badri-nath et al. [2]. The inputs of the model include:
1. Actual pushback times
2. Actual landing times
3. Gate location of departure flights
4. Runway used by departure flights
5. Runway configuration
6. Weather conditions
The model then generates a prediction of taxi-out time for each departing flight, as well as prediction of the queues on the airport surface.
The model inputs are obtained from multiple sources. Inputs 1 to 5 in the above list are retrieved from the set of airport operational data provided by Changi Airport Group, which includes data from January to March 2017 and from January to May
2018. Weather conditions are retrieved from METAR reports.
4.3.2
Queueing Network
To build a queueing model specific to Changi Airport, one has to first model the existing airport surface layout. There are two runways: 02L/20R and 02C/20C, and there are two possible runway configurations in Changi Airport: North-flow (02L,
02C I 02L, 02C) and South-flow (20C, 20R I 20C, 20R). Terminals 1 - 4 lie between the two runways. This can be seen from Figure 4-2 where the image captures the airport layout. This layout is fairly simple, as compared to airports like Charlotte Douglas International Airport (CLT) which involves more complex operations like runway crossing [2]. Evident from Figure 4-2, departing flights from all terminals would not have to cross any runways to get to either runways.
Singapore, Singapore WSSS
At-V
Map not to state. Not to be used for navigational purposes. Figure 4-2: Singapore Airport Layout [31]
Runway Queue
(a) Queueing Network for SIN: North-flow (b) Queueing Network for SIN: South-flow
Figure 4-3: Queueing Network Representation of Changi Airport
Figure 4-3 presents a diagrammatic representation of the queueing network in Changi Airport in both North-flow and South-flow configurations (shown in Figure 4-3a and Figure 4-3b respectively). The blue arrows in both diagrams represent the departure process, whereas the orange arrows represent the arrival process. In both North-flow and South-flow configurations, departures push back from their respective gates and make their way to either runway queues, depending on runway assignment. Whereas for arrivals, flights land on either runway depending on runway assignment and make their way directly to the gates, encountering no ramp queues. Unlike the queueing network presented in Badrinath et al.[2], the queueing model for Changi Airport does not include taxi-in and taxi-out ramp queues and is hence not presented as a queueing network, because Changi Airport's simple airfield layout allows easy maneuver from respective terminals to runways without arriving flights significantly obstructing flights taxiing-out. Furthermore, aircraft track data from Changi Airport has also revealed little to no ramp queues.
Having provided queuing network representations for the airport surface, the sub-sequent subsection will introduce the analytical model for Changi Airport.
![Figure 2-1: Diagram of Changi Airport Terminal and Airside Layout [12]](https://thumb-eu.123doks.com/thumbv2/123doknet/13957668.452700/20.917.154.776.220.593/figure-diagram-changi-airport-terminal-airside-layout.webp)