HAL Id: hal-02998130
https://hal.archives-ouvertes.fr/hal-02998130
Submitted on 10 Nov 2020
HAL is a multi-disciplinary open access
archive for the deposit and dissemination of
sci-entific research documents, whether they are
pub-lished or not. The documents may come from
teaching and research institutions in France or
abroad, or from public or private research centers.
L’archive ouverte pluridisciplinaire HAL, est
destinée au dépôt et à la diffusion de documents
scientifiques de niveau recherche, publiés ou non,
émanant des établissements d’enseignement et de
recherche français ou étrangers, des laboratoires
publics ou privés.
Late-Pleistocene catchment-wide denudation patterns
across the European Alps
Romain Delunel, Fritz Schlunegger, Pierre Valla, Jean Dixon, Christoph
Glotzbach, Kristina Hippe, Florian Kober, Stéphane Molliex, Kevin Norton,
Bernhard Salcher, et al.
To cite this version:
Romain Delunel, Fritz Schlunegger, Pierre Valla, Jean Dixon, Christoph Glotzbach, et al..
Late-Pleistocene catchment-wide denudation patterns across the European Alps. Earth-Science Reviews,
Elsevier, 2020, 211, pp.103407. �10.1016/j.earscirev.2020.103407�. �hal-02998130�
Earth-Science Reviews 211 (2020) 103407
Available online 16 October 2020
0012-8252/© 2020 The Author(s). Published by Elsevier B.V. This is an open access article under the CC BY-NC-ND license
(http://creativecommons.org/licenses/by-nc-nd/4.0/).
Review Article
Late-Pleistocene catchment-wide denudation patterns across the
European Alps
Romain Delunel
a,*, Fritz Schlunegger
a, Pierre G. Valla
b,a, Jean Dixon
c, Christoph Glotzbach
d,
Kristina Hippe
e, Florian Kober
f, St´ephane Molliex
g, Kevin P. Norton
h, Bernhard Salcher
i,
Hella Wittmann
j, Naki Akçar
a, Marcus Christl
eaInstitute of Geological Sciences, University of Bern, Switzerland
bISTerre, Univ. Grenoble Alpes, Univ. Savoie Mont Blanc, CNRS, IRD, IFSTTAR, 38000 Grenoble, France cDepartment of Earth Sciences, Montana State University, USA
dDepartment of Geosciences, University of Tübingen, Germany eLaboratory of Ion Beam Physics, ETH Zurich, 8093 Zurich, Switzerland fNagra, Hardstrasse 73, 5430 Wettingen, Switzerland
gLaboratoire G´eosciences Oc´ean, UMR 6538, CNRS, IUEM, Place N. Copernic, 29280 Plouzan´e, France hVictoria University of Wellington, Wellington, New Zealand
iUniversity of Salzburg, Department of Geography and Geology, Hellbrunnerstrasse 34, 5020 Salzburg, Austria jGerman Research Centre for Geosciences GFZ, Earth Surface Geochemistry, Telegrafenberg, 14473 Potsdam, Germany
A R T I C L E I N F O Keywords: Geomorphology Denudation rates Cosmogenic nuclides Catchment Data compilation Surface uplift European Alps A B S T R A C T
We compile detrital 10Be concentrations of Alpine rivers, representing the denudation rates pattern for 375
catchments across the entire European Alps. Using a homogeneized framework, we employ state-of-the-art techniques for inverting in-situ 10Be concentrations into denudation rates. From our compilation, we find that
(i) while lithologic properties and precipitation/runoff do influence erosion mechanisms and rates at the scale of individual catchments and in some specific Alpine regions, such controls do not directly stand for the entire Alps, (ii) as also previously suggested, catchment-wide denudation rates across the entire European Alps closely follow first-order Alpine topographic metrics at the scale of individual catchments or selected Alpine sub-regions. However, in addition to previous local-scale studies conducted in the European Alps, our large-scale compila-tion highlights a funccompila-tional relacompila-tionship between catchment-wide denudacompila-tion and mean catchment slope angle. Catchment-wide denudation positively correlates with mean catchment slope up to a threshold angle (25–30◦).
Above this threshold, any correlation between catchment-wide denudation and slope as well as other catchment metrics breaks apart. We can reconcile these systematic patterns by proposing a regional erosion model based on diffusive-transport laws for catchments located below the slope threshold angle. In oversteepened catchments situated above-threshold slopes, erosion is stochastic in nature, as glacial carving likely caused a partial decoupling between hillslope and fluvial domains with complex topographic relationships and sediment con-nectivity patterns.
Finally, we identify a first-order positive relationship between modern geodetic rock uplift and catchment- wide denudation for the European Alps. The observed spatial pattern is highly variable and possibly reflects the surface response to deep geodynamic mechanisms prevailing in the different Alpine regions. We conclude that today’s topography and geomorphic features of the entire Alps are the result of a millenial-scale geomorphic response to past glacial processes and active rock uplift, highlighting a link between external and internal drivers for mountain erosion.
* Corresponding author.
E-mail addresses: [email protected], [email protected] (R. Delunel).
Contents lists available at ScienceDirect
Earth-Science Reviews
journal homepage: www.elsevier.com/locate/earscirev
https://doi.org/10.1016/j.earscirev.2020.103407
1. Introduction
The formation and evolution of mountain reliefs represent striking evidence of the interplay between internal (i.e. tectonics) and external (climate and erosion) driving processes (e.g. Whipple, 2009; Champa-gnac et al., 2012, 2014). Yet, constraining these processes and their relative contributions to mountain dynamics is challenging, mainly because of the various spatial and temporal scales involved (e.g.
Whipple, 2001; Willett et al., 2006; Tomkin and Roe, 2007; Herman et al., 2018). Some studies have succeeded in showing the role of climate and tectonics in overall moutain topographic evolution such as for the Andes (Montgomery et al., 2001; Thomson et al., 2010). For the Olympic Mountains, a long-term “steady-state” has been proposed between tec-tonics and climate-driven erosion (e.g. Willett and Brandon, 2002), and a significant topographic (slope) control on erosion patterns has been evidenced (Montgomery and Brandon, 2002). However, such functional relationships between erosion and topography have remained elusive for other mountain ranges, especially for those where steady-state conditions have not been fully demonstrated. During the past decades, terrestrial cosmogenic nuclides, and in particular concentrations of in- situ produced 10Be in river sediments, have been widely used to
quan-tify spatially-averaged catchment denudation rates over centenial to millenial timescales (see Granger and Schaller, 2014 for a review). Scientific research using this approach was conducted in various geological settings characterized by contrasting geodynamic as well as climatic settings (e.g. review in Codilean et al., 2018). These studies have provided major outcomes regarding the influence of topography and rock strength (e.g. DiBiase et al., 2010; Scharf et al., 2013; Olivetti et al., 2016), runoff variability (e.g. DiBiase and Whipple, 2011), or crustal processes (e.g. Wittmann et al., 2007; Legrain et al., 2015) on landscape erosion. In addition, large-scale studies have also evidenced the coupling between topographic pre-conditioning and climate forcing, such as for the Andes (Carretier et al., 2013; 2018; Reber et al., 2017) and the Indian Peninsula (Mandal et al., 2015). The European Alps are particularly well studied, with the density of sampling sites being currently the highest worldwide. Previous studies addressed various scientific scopes including but not limited to (i) tracing of the detrital material provenance (e.g. Delunel et al., 2014a; Savi et al., 2014), (ii) exploring the litho-tectonic controls on denudation rates (e.g. Norton et al., 2010, 2011; Cruz Nunes et al., 2015; Glaus et al., 2019), (iii) quantifying the impact of the landscape’s transcience on erosion and sediment flux (e.g. Salcher et al., 2014; Dixon et al., 2016; Grischott et al., 2017a), (iv) investigating the relationhips between climate, orography and denudation (e.g. Chittenden et al., 2014; Delunel et al., 2010) and (v) searching for the rock-uplift controls on erosion and landscape relief (e.g. Wittmann et al., 2007; Glotzbach et al., 2013). The main outcomes from most of these studies converged towards a general picture where rock uplift, bedrock erosional resistance, landscape relief, catchment suceptibility to frost-cracking, sediment connectivity and also the degree of landscape transience best explain the spatial distri-bution of in-situ 10Be concentrations measured in river sediments and
therefore associated catchment-wide denudation rates. However, most of the above studies were conducted on a rather local scale (i.e. regionalization approach for base levels together with morphometric, uplift and climate variables), and concentrations of in-situ 10Be
measured in river material have generally been converted into denu-dation rates using different 10Be production rates and scaling schemes,
as well as digital elevation models of various resolutions. In addition, most of the calculated denudation rates were not consistently corrected for snow cover (Schildgen et al., 2005; Delunel et al., 2014b). As a result, the interpretation of inferred denudation rates in terms of underlying controls and driving mechanisms has been often site specific. Therefore, in order to assess and deconvolve large-scale mechanisms and processes controlling the observed Alpine denudation rates and their spatial variability, methodologically-consistent and regional-scale in-vestigations of catchment-wide denudation variability for each Alpine
region (i.e. for the Western, Central and Eastern Alps) are much needed. Here, we present a compilation of published and new in-situ 10Be
concentrations measured in Alpine river sediments and use them to investigate catchment-wide denudation across the entire European Alps. Our main objective is to go beyond previous investigations at the scale of individual catchments or Alpine sub-regions, and to rather characterize the dominant landscape and/or environmental parameters controlling both the spatial distribution and rates of millenial denudation at the scale of the entire Alpine mountain range. We therefore employ inver-sion techniques for converting in-situ 10Be concentrations measured in
river sediments into catchment-wide denudation rates. We then assess whether the inferred spatial patterns in catchment-wide denudation can be explained by characteristic topographic metrics, environmental var-iables, and we explore to what extent this pattern can be linked to modern geodetic rock uplift.
2. Material and methods
2.1. In-situ 10Be concentration and inferred catchment-wide denudation
Detrital 10Be concentrations available for Alpine rivers (i.e. whose sources are located within the European Alps and uplifted forelands), were compiled from the OCTOPUS database (Codilean et al., 2018; n = 293) and complemented with recently-published (Grischott et al., 2017b, Stutenbecker et al., 2018, Glaus et al., 2019; n = 44) and new (n = 38) data, totalizing 375 catchments (Table S1, Fig. 1). Given the characteristic attenuation length of secondary cosmic-ray particles responsible for the in-situ production of 10Be, it is generally accepted
that catchment-wide denudation rates integrate over the time period required to erode the uppermost c. 60 cm of Earth’s surface (e.g. von Blanckenburg, 2006). Therefore, our compilation of denudation rates for the European Alps generally yield millennial integration timescales. We will thus report catchment-wide denudation rates in “mm/ka” throughout the present study. These rates were all recalculated using the CAIRN algorithm (Mudd et al., 2016) following the same procedure as in
Codilean et al. (2018) but in an original approach specific to the Euro-pean Alps and described hereafter. Our calculations included a renormalization of measured 10Be concentrations to the 07KNSTD 10Be
AMS standard (Nishiizumi et al., 2007), and a 10Be half-life of 1.387 ±
0.012 Ma (Chmeleff et al., 2010; Korschinek et al., 2010). We have also considered the approximation of Braucher et al. (2011) for the cosmo-genic production pathways due to neutrons and muons, which yield a sea-level, high-latitude, total in-situ 10Be production rate of 4.3 atoms
g−1y−1 once considered within the CAIRN algorithm. Local in-situ 10Be
production rates were calculated at the scale of each catchment pixel using a 90-m resolution SRTM digital elevation model (DEM; Jarvis et al., 2008). This was accomplished using the time-independent Lal/ Stone scaling scheme (Stone, 2000) with an atmospheric pressure interpolation that results from the reanalysis of the NCEP2 data (Compo et al., 2011). Topographic shielding was estimated following the method of Codilean (2006) for horizontal and vertical scanning angles (i.e. θ = 8◦ and ϕ = 5◦, respectively). We note that DiBiase (2018) recently
suggested no need for topographic shielding correction when estimating catchment-wide denudation rates. In the European Alps, using a 90-m resolution DEM, the obtained topographic shielding correction factors are all above 0.90 with a median value of 0.96 (Table S1). Therefore, we agree with the outcomes of DiBiase (2018) in the sense that neglecting such a correction would only slightly change the inferred catchment- wide denudation rates without perturbing the spatial pattern. Omit-ting the topographic-shielding would result in faster rates that are generally within error of our calculations. We thus decided to maintain this correction, considering that our approach is rather conservative. River catchments were delineated from the CAIRN algorithm procedure thereby using each individual sampling point coordinates as catchment outlet. Output results of these processing steps are reported as “raw” denudation rates in Table S1. Following the same procedure as in
Codilean et al. (2018), no correction was applied for possible quartz- content variability (i.e. mineral fertility) between catchment bedrock lithologies. We note that significant corrections were required in other mountainous regions such as the Andes where the spatial distribution of different lithological units is not random but often elevation-dependent (Carretier et al., 2015a). In the European Alps, however, we considered that (i) both catchments of previous studies and the newly-reported ones contain a dominating proportion of quartz-bearing lithologies and (ii) these lithologies are homogeneously distributed throughout the Alpine topography and do not show a systematic dependency with elevation (e. g. Kühni and Pfiffner, 2001; Schmid et al., 2004; Handy et al., 2010). In that sense, we consider that our selected approach does not significantly affect the quantification of catchment-wide denudation from riverine in- situ 10Be concentrations. However, we acknowledge that using a GIS- based database including quartz-fertility estimates for Alpine lithol-ogies (e.g. building on the IGME 5000 database; Asch, 2005), could offer the basis for better evaluating the possible effect of quartz fertility on Alpine denudation rates in future research.
Both the topography and climate characteristics of the European Alps entail significant seasonal snowfalls and active modern glaciers that can affect the production of in-situ cosmogenic nuclides (e.g. Schildgen et al., 2005; Zweck et al., 2013; Delunel et al., 2014b). Shielding results in a decrease of in-situ cosmogenic nuclide production rates, with the consequence that denudation rates could be overestimated if snow and glacier cover are not accounted for. Shielding factors due to ice cover were determined by setting 10Be production rate to zero (e.g. Wittmann
et al., 2007; Delunel et al., 2010) for areas covered by modern glaciers (database extracted from the Randolph Glacier Inventory; Pfeffer et al., 2014). Our modern-glacier correction factors vary from 1.0 (i.e. no glacier within the catchment) to 0.36, with 16th and 84th percentiles of
0.81 and 1.0, respectively. Shielding factors for snow cover were based on the combination of snow-thickness records available for the Swiss Alps (Auer, 2003) and snow-water equivalent (SWE) thickness for the French Alps (1958–2017; Durand et al., 1999, 2009). Snow-thickness data within the Swiss Alps were then converted to a SWE thickness using the empirical model of Jonas et al. (2009). These two datasets provide annual snow-water equivalent thicknesses for each 300-m elevation bin (Fig. 2). Given that both datasets yielded similar snow shielding factors (<3% difference) for altitudes between c. 1000 and 2400 m a.s.l., we regard them as representative of mean catchment el-evations for our compilation. We thus combined them and produced an original dataset using a second-order polynomial function to estimate snow shielding factors (e.g. Schildgen et al., 2005) as a function of the mean catchment elevation (Fig. 2). The resulting snow shielding factors vary between 1.0 and 0.82, with 16th and 84th percentiles of 0.85 and
0.95, respectively. Combining the modern glacier coverage and seasonal snow-cover effect results in total shielding corrections of c. 10% (me-dian). Such corrections are spatially highly variable, reaching up to c. 70% at maximum and with 16th and 84th percentiles of 7% to 29%,
respectively. We report the resulting denudation rates in Table S1 as “corrected” denudation rates and use these values in the following sec-tions for our investigation at the scale of the entire European Alps.
2.2. Landscape metrics, environmental variables and geodetic rock uplift
We aim to evaluate spatial relationships between catchment-wide denudation rates and (1) topographic, (2) environmental and (3) rock- uplift metrics over the entire Alps. To this extent, we have numerically processed the large databases in a geographic information system (GIS approach using ArcGIS and QGIS softwares).
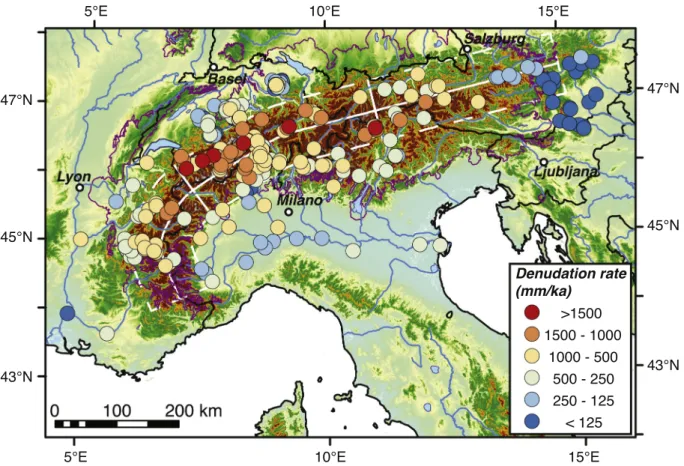
Fig. 1. Map of the European Alps showing the sample locations used in the compilation. Circles are color-coded relative to the inferred catchment-wide denudation
rates. White-dashed box (width = 100 km) highlights the area considered as the core of the orogen whereas the white line represents the profile onto which the mean- catchment denudation rates are projected in Fig. 3B. Note that this transect across the Alps uses the same coordinates as in Sternai et al. (2019). Segments perpendicular to this line delimit the location of the Western, Central and Easter Alps, respectively. Purple line marks the extent of the Last Glacial Maximum ice extent as in Mey et al. (2016). (For interpretation of the references to color in this figure legend, the reader is referred to the web version of this article.)
Topographic analyses (Table S1) were conducted using the 90-m resolution SRTM DEM (Jarvis et al., 2008), which is available for the entire European Alps. All considered spatial datasets were added to a common GIS project using the UTM32 reference system. Basic topo-graphic parameters such as the catchments’ drainage areas, mean ele-vations and mean slope angles were directly extracted within the CAIRN procedure (Mudd et al., 2016). Using GIS tools, we also calculated the geophysical relief (sensu, Small and Anderson, 1998) using a 5-km radius as proposed by Champagnac et al. (2007, 2014). Finally, we evaluated the relative abundance of basin slopes above 40◦, as hillslopes
with such topographic gradients can be considered as oversteepened and thus are prone to mass-wasting processes (DiBiase et al., 2012).
Environmental variables were extracted from different sources and are reported in Table S1. Bare-rock abundance within each individual catchment was estimated using the 100-m resolution CORINE Land Cover (CLC 2018, class 31) inventory. Modern mean annual precipita-tion (MAP) was derived from the EURO4M (1971–2008) c. 5-km reso-lution daily-precipitation grids (interpolated from >5000 daily rain- gauge records) distributed within the European Alps (Isotta et al., 2014). Extremes in monthly precipitation were extracted from this same database and defined as the upper 99th percentile of monthly values
(referred as “MM99P” thereafter and in Tables S1–S2). We then evalu-ated a “storminess” index from the precipitation datasets (i.e. the ratio between MM99P and a theoretical monthly precipitation rate derived from the MAP data) for each individual catchment; catchments affected by high-intensity and low-frequency rain episodes would yield relatively large (>2) index values. Mean annual runoff was estimated at first order as the product of drainage area and mean annual precipitation rate, thereby not considering any possible loss due to water intake or evapotranspiration. We considered runoff loss as being limited and not showing any particular spatial pattern for the European Alps (maximum of 20% loss that was estimated for a selection of Swiss rivers studied by
Wittmann et al., 2007). We also considered paleo-environmental vari-ables, and particularly paleo-glacial information. This includes both the areal extent and surface elevation of the Alpine ice cap during the last glacial maximum (LGM at around 20–25 ka; Mey et al., 2016). This allowed us to estimate a first-order mean LGM ice-thickness for each individual catchment by subtracting the ice-surface elevation from the modern topography. We acknowledge that such an approach is
oversimplified but conservative. It may indeed underestimate the LGM ice thickness, as it does not consider overdeepened basins that are ubiquitous in the Alps (e.g. Preusser et al., 2010; Dürst Stucki and Schlunegger, 2013; Magrani et al., 2020). We additionally estimated the relative areal proportion of each catchment located above the LGM equilibrium-line altitude (ELA) reported by Mey et al. (2016) in their Supplementary Figure 6. We acknowledge that this LGM ELA spatial distribution is a first-order estimate based on ice-flow modeling and mapped external moraines and internal trimlines (Mey et al., 2016). Such ice-flow modeling is not incorporating paleo-precipitation data for the European Alps (Viˇsnjevi´c et al., 2020), and non-dated geomorpho-logical markers may also be representative of older glacial stages in some Alpine areas (although recent compilation by Wirsig et al., 2016
highlights a LGM timing for these markers around the European Alps). The obtained metrics could then be used as proxy for the erosional power of LGM glaciers, since significant glacial conditioning has been proposed to promote efficient postglacial erosion and landscape’s transience (Norton et al., 2010; Valla et al., 2010). In general, one may expect that catchments with >50% of their area above the LGM-ELA could have generated larger and longer-lasting glaciers during both the LGM and older glacial stages of the Quaternary (Pedersen and Egholm, 2013), having thus a more significant impact on the topography than in lower-lying catchments.
Regional geodetic rock uplift at the scale of the Alps was obtained from the recent contribution of Sternai et al. (2019) who produced a 30- km resolution interpolated grid using vertical GPS/GNNS data (1998–2016, 555 stations throughout the Alps and its direct vicinity). The original grid was resampled to a c. 600-m resolution to extract mean catchment rock-uplift rates. In this context, we acknowledge the cautionary statements by Sternai et al. (2019) who noted that other interpolations could yield different results, mainly because the outcome heavily depends either on (i) the selection of interpolation parameters and/or (ii) whether surface-levelling records are included or discarded (as in our case) in the interpolation. Here, we infer that such differences would likely be negligible when considering mean catchment rock-uplift for regions and/or catchments at spatial scales of 10–100 km2 (Tables S2 and S3), or at least they will not affect the spatial patterns we observe.
Fig. 2. (A) Mean annual snow-water equivalent thickness (SWE) plotted as a function of elevation and for 23 moutainous massifs along the French Alps (Durand et al., 1999, 2009). Color-coded points represent the mean annual SWE values calculated over 60 years (1958–2017) for each of the monitored Alpine massifs and over 300-m elevation bins. Black solid curve represents the second order polynomial function that best fits the observations for the French Alps. The dashed curve illustrates the best fit obtained for the Swiss Alps using data reported by Auer (2003) and converted to SWE with the empirical model of Jonas et al. (2009). (B) Prediction of snow-shielding factor as a function of elevation for the French (black curve) and Swiss (dashed curve) Alps that have been combined to produce a composite model for the whole European Alps (Model Alps, blue dotted curve). The model allows predicting a snow-shielding factor (SF) as a function of the mean
elevation (Zm) of the considered catchment using: SF = −3.54e-9 x Zm2–5.96e-5 x Zm. The grey square represents the extent of mean catchment elevations within our
2.3. Statistical analyses and binning of data
As most of the extracted landscape/environmental metrics and catchment-wide denudation rates follow skewed rather than normal distributions, data are often reported as median (i.e. 50th percentile)
together with the range bracketed by the 16th and 84th percentiles
(Table S2). This range thereby represents c. 68% of the entire popula-tion, which is usually referred as 1σ standard deviation for normally-
distributed datasets. Most data being non-normally distributed, spatial relationships between catchment-wide denudation rates and catchment metrics were evaluated through non-parametric statistical tests (Kendall rank correlation coefficient and related p-value matrices) using in-built functions of the MATLAB software. Detailed outcomes of this analysis are reported in Table S2, where correlations were considered significant at p-values <0.01 and with a Kendall-tau coefficient > 0.5. Correlation and p-values are shown in Table S2 for all data (n = 375) and also for different catchment groups, such as large catchments >100 km2 (n =
145) or steep ones with mean slope angles above 30◦(n = 42).
Given the large number of investigated catchments, we followed a binning approach with the aim of identifying the first-order processes or driving mechanisms at a rather large spatial scale, i.e. trying to step away from potential small-scale perturbations that may cause noise in such a large dataset. We thus binned the obtained data by catchment- averaged gradient classes, using an equal bin width of 30 m/km (c. 1.5◦in average) over the entire range of topographic gradients in the
Alps. With such an approach, we can calculate and report the mean and standard deviations of selected metrics for each catchment-averaged gradient bin. We selected this strategy to best illustrate how catchment-wide denudation and topographic, (paleo-)environmental, and geodetic metrics, depend at first order on mean catchment slope angle. We also performed sensitivity tests with bin widths of 15, 60 and 90 m/km (Figs. S1–S4 in Supplementary Material) to explore any possible bias introduced by binning the dataset in our analysis. In particular, according to Towers (2014), averaged values might somehow appear arbitrary for such bin selections (here catchment-averaged gradient bins) that contain a limited number of observations and data with a large scatter (as for the catchment-wide denudation dataset). An alternative statistical approach would be to extract the most probable central values for each of the selected variables through the analysis of a kernel-probability distribution within each gradient bin (e.g. Bowman and Azzalini, 1997). We thus conducted related tests by extracting the mode (i.e. the highest probable value) of these kernel probability dis-tributions, and we compared the outcome values with the calculated arithmetic mean denudation value (Fig. S5 in Supplementary Material). We find that the kernel-derived modes and arithmetic means yield relatively similar results, with kernel-derived values remaining within the reported standard deviations of arithmetic means and thus consis-tently plotting near the 1:1 relationship. Therefore, we considered the catchment-wide denudation patterns and landscape/environmental metrics reported in this study to be statistically robust and meaningful for investigating first-order processes or large-scale driving mechanisms over the entire European Alps.
3. Results and interpretation
3.1. Spatial patterns of catchment-wide denudation
10Be-based catchment-wide denudation rates across the European
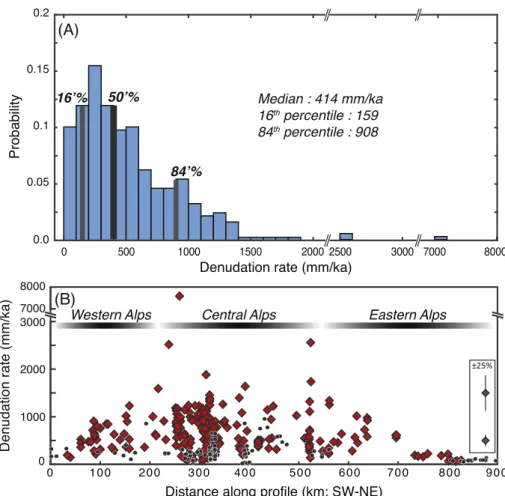
Alps (Fig. 1) range from 14 mm/ka (“GO1”; Thur river in NE- Switzerland; Buechi et al., 2014) to 7585 mm/ka (“LS2014-14”; Ill-graben catchment in SW-Switzerland; Stutenbecker et al., 2018). The whole Alpine dataset (see Table S1) shows a right-skewed distribution (Fig. 3A) with a median denudation rate of 414 mm/ka and 16th and 84th
percentiles of 159 and 908 mm/ka, respectively. Converted into apparent ages, catchment-wide denudation rates integrate in general the latest c. 4 ka, while slowly-eroding catchments integrate longer
timescales extending to the last 40 ka (Table S1). Alpine catchments for which averaged denudation rates exceed 1500 mm/ka (n = 7, <2% of the total population; Table S1) reveal from both field-mapping and satellite-imagery observations that erosion in these specific basins ap-pears significantly affected by mass-wasting processes including recur-rent debris flows. Such processes, which have been shown to significantly dilute the cosmogenic 10Be concentration in river
sedi-ments (e.g. Savi et al., 2014; Cruz Nunes et al., 2015; Stutenbecker et al., 2018), result in overestimated and temporally variable denudation rates (e.g. Kober et al., 2012). We decided, however, to keep all the compiled data within our compilation for our morphometric/environmental analysis since they are also important for understanding active geomorphic processes in the modern European Alps. Only two catch-ments known to be severely affected by mass-wasting events have not been considered in the following sections: the Illgraben (LS2014-14, Swiss Alps; Stutenbecker et al., 2018) and a very small debris-flow catchment (S09, Italian Alps; Savi et al., 2014), which were already characterized as outliers in the original publications.
The spatial distribution along the European Alps reveals that the highest density of catchment-wide denudation data as well as the largest observed variability are found in the Central Alps, whereas both data density and variability in denudation rates are lower in the Western and Eastern Alps (Fig. 3B). Along strike, catchment-wide denudation rates generally increase from the Western/Eastern Alpine margins towards the Central Alps where the highest rates are recorded (Fig. 3B, Table S1). Denudation rates for catchments outside the swath profile, i.e. mainly within the southern/northern foreland basins (Fig. 1), tend to be lower than for catchments located in the core of the Alps.
From a process and mechanical point-of-view, erosion and sediment transfer both on hillslopes and in channels should be controlled at first order by three individual and independent parameters that are (1) water runoff, (2) bedrock erosional resistance and (3) slope angle (e.g., Tucker and Slingerland, 1994, 1997). In the following sections, we thus explore the possible relationships between catchment-wide denudation rates and precipitation, water runoff, bedrock erosional resistance (using lithology-based erodibility map as a first-order proxy; Kühni and Pfiff-ner, 2001), before investigating relationships with slope angle and other landscape/environmental metrics.
3.2. Denudation, precipitation/runoff and bedrock erosional resistance
Previous studies conducted along the northern foothills of the Alps have illustrated that precipitation (Frei and Sch¨ar, 1998), but also catchment-wide denudation rates (e.g. Wittmann et al., 2007), present distinct dependencies to orographic conditions. Furthermore, precipi-tation and associated runoff have been shown to exert a first-order control on erosion and sediment transport patterns at the scale of indi-vidual Alpine massifs and drainage catchments (e.g. Chittenden et al., 2014). However, at the scale of the entire Alps our correlation tests (Table S2) suggest that such relationships are weak or non-existent. Using a data-binning approach for MAP and runoff climatic variables (Fig. 4), we have explored whether these parameters can somehow explain the observed variability in catchment-wide denudation across the Alps. Interestingly, while binned catchment–wide denudation rates are independent of precipitation (MAP), there seems to exist a threshold in annual precipitation (i.e. >2100 mm, Fig. 4A) with a step increase in catchment-wide denudation rates. Although this observed increase is statistically not significant, it might also likely be biased due to the spatial locations of the related dataset involved in this increase. In particular, these data mainly stem from the eastern part of the Bernese Oberland and upstream part of the Rhˆone catchment, where 2/3 of the considered data is actually collected in the framework of a long-term monitoring of a debris-flow catchment (Kober et al., 2012). Finally, we observe a gradual increase in catchment-wide denudation with annual runoff (Fig. 4B) until ~10 km3, followed by a clear drop in
linked to a possible threshold effect in catchment size, where erosion decreases for large (and generally low-lying) catchments (also reported for the Central Alps sub-region by Wittmann et al., 2007). However, we stress that all these qualitative observations and possible relationships are statistically not significant (Table S2). Therefore we do not consider that modern climate and related parameters (i.e. MAP or storminess index and runoff) have a significant predictive power on catchment- wide denudation and landscape dynamics, at least at the scale of the Alpine mountain belt and for the timescales integrated by our database (Table S1).
Bedrock lithology, and its associated erosional resistance, has long been shown to strongly condition the erosional magnitude and the na-ture of hillslope processes such as hillslope creep or mass failure pro-cesses (e.g., Gilbert, 1877; Davis, 1899; Stock and Montgomery, 1996;
Hurst et al., 2013). At the scale of individual Alpine catchments, such lithology-dependent processes leave distinct signals in the lithological composition of river bedload and suspension loads (Glaus et al., 2019) and in the riverine detrital concentrations of in-situ 10Be (Van den Berg et al., 2012; Cruz Nunes et al., 2015; Kober et al., 2019). However, our compilation of in-situ 10Be in stream sediments at the scale of the entire
European Alps documents that lithology does not appear to exert a first- order control on the 10Be-based denudation rate patterns, following
previously-reported observations at a large scale (e.g. Norton et al., 2011; Salcher et al., 2014). In particular, the lowest denudation rates (below c. 250 mm/ka) are obtained for catchments situated in sedi-mentary foreland basins surrounding the Alpine orogen where the clastic sedimentary lithologies are assigned to the highest erodibility (Kühni and Pfiffner, 2001). In contrast, highest denudation rates are found in the core of the Alps where crystalline bedrock lithologies (gneiss and granites) are considered to offer the highest resistance to erosion. From a rock-mechanical point of view, these lithologies can also sustain topographic slopes up to 60◦ provided that bedrock is not
dissected by weakness zones such as faults, fractures and schist planes, and that the pore space is not saturated with water (e.g., Schlunegger et al., 2013). Alternatively, as we further explore below, this observed pattern could be explained by the glacial overprint on the Alpine topography, with the core of the Alps hosting steep and high-relief catchments, while the forelands are relatively flat.
3.3. Denudation rates and slopes
Our previous observations resulted in excluding the direct role of precipitation, runoff (Table S2) and bedrock erodibility in controlling the observed distribution of denudation at the scale of the Alps. We thus explored slope as a potential first-order driver. Plotting catchment-wide denudation against mean catchment slope (Fig. 5) reveals that there is no clear trend in the overall dataset. Correlation parameters point to-wards a significant, yet rather weak relationship (Table S2). It appears, however, that both the intensity and the variability in measured denu-dation rates are generally increasing with catchment mean slopes up to a threshold at c. 25–30◦ (grey area in Fig. 5). Above this threshold,
denudation rates and their variability tend to significantly drop. Despite an apparent noisy signal when looking at the dataset as a whole, a general relationship between denudation rates and slopes appears more clearly with our binning approach using 30-m/km gradient classes (Fig. 5) or any of the other tested bin-widths (Fig. S1). In particular,
Fig. 5 shows that binned denudation increases linearly with mean slope angle up to c. 25◦, and then appears to rise non-linearly up to c. 30◦,
where averaged denudation rates reach 700–750 mm/ka. Monte-Carlo simulations conducted with a diffusive-transport model (Montgomery and Brandon, 2002) clearly underline the non-linear evolution of catchment-averaged denudation rates until a slope angle of 30◦. Beyond
that threshold slope, catchment-wide denudation rates significantly drop to c. 500 mm/ka on average. In addition, for slope angles >30◦
Fig. 3. (A) Histogram of compiled catchment-wide
denudation rates. Bin intervals are 100 mm/ka. Note that the x-axis is cut at 2000–2500 and 3000–7000 mm/ka for clarity. Main statisctics are indicated in panel and shown on histogram. (B) Swath profile showing the spatial distribution of catchment-wide denudation rates along the European Alps (with three main regions: Western, Central and Eastern Alps, see Fig. 1 for location and extent). Black circles show catchments located outside the core of the oro-gen (n = 134) as defined in Fig. 1. Note that the dis-tance (x-axis) is estimated by projecting the centroid of each catchment along the profile represented in
Fig. 1. The y-axis is cut between 3000 and 7000 mm/ ka for clarity. The inset provides a visual expression of the ±25% relative uncertainties that are gernerally associated with the catchment-wide denudation rates. Examples at 500 mm/ka and 1500 mm/ka are shown.
denudation rates clearly depart from the simulated diffusive-transport model (Fig. 5). Based on this observed pattern, we decided to group our dataset into two catchment subpopulations (type I and type II, inset in Fig. 5). Type-I catchments (n = 329) are characterized by slopes <30◦,
where denudation and slope are positively correlated and follow a diffusive-transport law. Type-I basins can further be subdivided into type-Ia catchments (n = 168) where denudation rates generally bracket c. 100–400 mm/ka (25th and 75th percentile, respectively; see Fig. 5 and
Table S3) and increase linearly with slope angles until 25◦. Accordingly,
type-Ib basins (n = 165) have slopes between 25◦and 30◦, averaged
denudation rates reach their maximum values (c. from 400 to 1000 mm/
ka) and increase non-linearly with slope. Type-II basins (n = 40) have mean catchment slopes >30◦ and display averaged denudation rates
between c. 300 and 650 mm/ka (25th and 75th percentile, respectively).
3.4. Morphometric data, environmental variables and slopes
Following our classification into three slope-dependent catchment types (Fig. 5), we further evaluate the possible inter-relationships be-tween mean catchment slope angles, denudation rates, and other land-scape metrics or environmental variables (Fig. 6). Mean catchment slope distribution reveals a clear linkage to the mean catchment elevation
Fig. 4. Catchment-wide denudation rate plotted as a
function of mean annual precipition (A) and runoff (B). Blue dots represent the population of the entire catchments, Grey circles are mean denudation rates obtained for 80 mm/a class-intervals in (A) and log- scale class-intervals (i.e. 4e-3 to 5e1 km3/a) in (B).
Vertical error bars illustrate the standard deviation. Color coding is used for denudation rates. (For inter-pretation of the references to color in this figure legend, the reader is referred to the web version of this article.)
(Fig. 6A, Table S2). Most type-II catchments (>30◦) tend to be located at
high elevations, i.e. between 1500 m to 2500 m a.s.l. (mean catchment elevation), although these metrics appear weakly correlated to each other for that catchment type (Table S2). The 1500-2500-m elevation range has been considered to overlap with the Equilibrium Line Altitude of the Last Glacial Maximum (LGM-ELA) and possibly during earlier glaciations due to the complexities that are related to the positioning of the ELA, both in space and time (e.g. Ivy-Ochs et al., 2008; Salcher et al., 2014; Schlunegger and Norton, 2013; Mey et al., 2016; Viˇsnjevi´c et al., 2020). On contrary, type-Ia catchments (<25◦) display a consistent
linear trend between mean catchment elevation and slope, with overall elevations lower than c. 2000 m a.s.l. Interestingly, for type-Ib catch-ments, mean elevation appears to be negatively correlated to mean slope (Fig. 6A). In summary, a significant transition appears between type-Ia and Ib while mean catchment elevation for type-Ib and type-II basins falls in the same range (Fig. 6A, Table S3). A similar pattern also emerges for the 5-km geophysical relief (Fig. 6B), which generally increases from 100 to c. 1300 m with mean catchment slopes. Mean geophysical relief does increase linearly with slope for type-Ia catchments, while it tends to slightly decrease with slope for type-Ib basins. For type-II catchments, similar to type-Ib ones, geophysical relief stabilizes at c. 1000 m and does not significantly change with increasing slope (Fig. 6B, Table S2). A
clear different pattern emerges when investigating the proportion of
>40◦hillslopes within each catchment type. Type-Ia catchments show a
typically-low and spatially homogeneous abundance of >40◦hillslopes
(i.e. around 15%, Fig. 6C), while this parameter increases non-linearly for type-Ib and -II catchments, reaching up to c. 40% in relative extent for steep slopes (Fig. 6C; Table S2).
Concerning environmental parameters, we observe a sharp differ-ence in the relative abundance of bare-rock exposure between catch-ment types (Fig. 6D) with values <5% for type-Ia catchments (extensive soil and vegetation cover associated to non-consolidated sediment ma-terial) while reaching up to 35–40% for type-II catchments. Within type- Ib catchments, land cover is highly variable with a marked transition from soil/vegetation cover to bare-rock exposure (Fig. 6D). Finally, we also evaluated the potential topographic imprint of glaciations using the LGM ice thickness (Fig. 6E) and the catchment proportion above the LGM-ELA (Fig. 6E), thereby acknowledging the uncertainties that are associated with ELA reconstructions, as outlined above. While the LGM ice cover was generally <100-m thick within type-Ia catchments, average LGM ice thickness exceeded 300–400 m for type-Ib and –II catchments (Fig. 6E). Moreover, type-Ib and -II catchments have a high relative proportion of catchment area above the LGM-ELA (>80%), while type-Ia catchments have generally mean elevations that are lower
Fig. 5. Catchment-wide denudation plotted as a
function of mean catchment slope. Blue dots represent the population of the entire catchments, grey circles are mean denudation rates obtained for 30 m/km class-intervals, with vertical error bars illustrating the standard deviation. Diamonds represent the median values within each bin. Note that the plot is cut at 1500 mm/ka (y-axis) for a better visualisation but binned values do take into account the 5 catchments
>1500 mm/ka in the calculation of mean and median
values. Black thick curve (median), blue envelope (25th to 75th percentile) as well as dashed curves (1st
and 5th percentiles, respectively) result from the
Monte-Carlo predictions (n = 104 draws) of a non-
linear diffusive transport model built on the formu-lation reported by Montgomery and Brandon (2002)
(see main text): E = E0+K S
1− (S/Sc)2. Here, the
back-ground denudation rate (E0) is randomely drawn
within a uniform distibution [20–100 mm/ka] based on the chemical-weathering contribution to denuda-tion rates reported by Hinderer et al. (2013) for c. 80 Alpine rivers. The transport coefficient (K = 600 mm/ ka) is set to the value reported by Montgomery and Brandon (2002) for the Olympic Mountains and associated to a relative standard deviation of ±20%. This uncertainty is chosen to account for possible differences in the European Alps. The critical slope gradient (Sc) is drawn randomely within a uniform
distribution [35–40◦] based on values commonly
re-ported in the literature (e.g. Montgomery and Bran-don, 2002; DiBiase et al., 2010) and consistent with the distibution of slope angles accross the European Alps (Robl et al., 2015). Grey bar highlights mean catchment slope of 25–30◦ that characterize type-Ib
catchments and mark the transition between type-Ia (left) and type-II catchments (right). Inset illustrates the box-and-whisker plots, y-axis representing denu-dation rates [0–3000 mm/ka], for three catchment- gradient classes (n indicates the number of catch-ments in each individual class). Boxes represent the 25th to 75th percentiles’ space including the median
value. Wiskers represent the most extreme values. Outliers (red crosses) are not considered by wiskers. (For interpretation of the references to color in this figure legend, the reader is referred to the web version of this article.)
than the LGM-ELA (<50–60%). The transition between the catchment types is well marked for this environmental parameter (Fig. 6F).
While it appears difficult to disentangle clear statistical relationships between catchment-wide denudation rates and topographic metrics or environmental variables when considering the dataset as a whole, a clearer pattern emerges from our binning approach that allows parti-tioning the dataset into 3 slope-dependent catchment types. In partic-ular, it seems that there is a general and rather linear increase for both topographic metrics (Fig. 6A–B) and environmental variables (Fig. 6D–F) with mean slope angle from type-Ia to type-Ib catchments. This observed trend is then followed by a relative stabilization or slight decrease for the different metric characteristics for type-II catchments. This general picture does not apply for the relative amount of >40◦(i.e.
beyond-critical threshold) hillslopes that are showing a non-linear in-crease for all catchment types (Fig. 6C).
3.5. Geodetic rock uplift and denudation
We explore the relationship between geodetic rock uplift and 10Be-
based denudation rates across the European Alps. We note here that because geodetic uplift has been repeatedly measured on fixed reference points (see Sternai et al., 2019 for details), these measurements record
the movement of the upper crust relative to a reference station. These rates can thus be considered as the vertical velocity of bedrock, or rock uplift. We therefore test whether rock uplift at the scale of the Alps is in equilibrium with millennial denudation. Considering the entire dataset from all catchments (i.e. type-I and type-II), mean geodetic rock uplift shows a general yet rather weak correlation with catchment-wide denudation (Table S2, Fig. 7). However, when considering type-II catchments only, mean geodetic rock uplift appears independent from catchment denudation (Table S2 and Fig. 7), while a possible correlation appears much clearer and statistically significant when considering catchments that are larger than 100 km2 (Table S2). In addition, specific
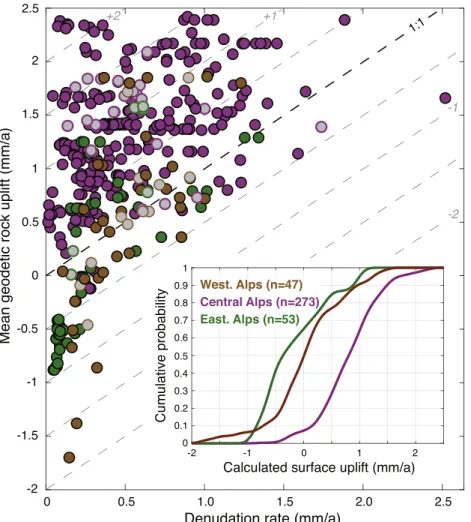
relationships between geodetic rock uplift and denudation are likely spatially variable (Fig. 7) although our compilation is largely dominated by catchments within the Central Alps where such a possible relation-ship between geodetic rock uplift and denudation seems less evident. In any case, one striking observation is that most of the data (c. 80% of the catchments) plot above the 1:1 line, suggesting the occurrence of a general net surface uplift (as defined by England and Molnar, 1990) in the European Alps. We tried to estimate the magnitude of such surface uplift by comparing denudation/rock uplift pairs (inset in Fig. 7). Accordingly, we first estimated the relative probability of surface uplift occurrence at a 0.1-mm/a resolution within the range from − 2.0 to
Fig. 6. Scatter plots showing the distribution of mean catchment denudation rates with different morphometric (A,B,C) and environmental (D,E,F) parameters as a
function of mean catchment slope. Note that our aim here is not to regress bi-linear relationships but rather to qualitatively illustrate how these variables vary accross the European Alps. Blue dots represent individual catchments (n = 373) while the position of color-coded circles shows the mean values obtained for each 30 m/km class-intervals and the vertical error bars their respective standard deviations. Black diamonds illustrate the calculated median values. Color coding represents catchment-wide denudation rates. Grey bar illustrates mean catchment slope of 25–30◦as in Fig. 5. Insets show the box-and-whisker plots for morphometric/
environmental parameter distribution within the three catchment-gradient classes (similar to Fig. 5). (For interpretation of the references to color in this figure legend, the reader is referred to the web version of this article.)
Fig. 7. Relationship between mean catchment geodetic rock
uplift (extracted from the interpolation reported by Sternai et al., 2019) and catchment-wide denudation. Note that both catchment-wide denudation rates and mean catchment geodetic rock-uplift rates are represented in “mm/a”. Colored circles are individual catchments within the three regions as delimited in Fig. 1: Western Alps (brown, 47 catchments), Central Alps (purple, 273 catchments) and Eastern Alps (green, 53 catchments). Note that the attribution to a region is based on the projection of the centroid of each catchment along the profile represented in Fig. 1. Black dashed line represents the 1:1 line with thinner ones representing 1:1 linear relationships at various intercepts. Open grey circles represent catchments with mean slope angle >30◦. Inset shows the cumulative
dis-tributions of calculated surface uplift (i.e. catchment-wide denudation substracted from mean geodetic rock uplift for each catchment) in the three spatial regions. See text for dis-cussion. (For interpretation of the references to color in this figure legend, the reader is referred to the web version of this article.)
+2.5 mm/a and also fitted a kernel distribution to the calculated surface uplift. For each defined Alpine region, the individual probability was then converted into a cumulative probability. Our results (inset in Fig. 7) further illustrate the spatial differences between Alpine regions, where the Central Alps widely show the occurrence of surface uplift (i.e. for c. 90% of studied catchments), while this picture is more dispersed for the Western (50%) and Eastern Alps (35%).
4. Discussion
Our compilation of 375 catchments throughout the European Alps has revealed that 10Be-based denudation rates, landscape metrics,
environmental variables and geodetic rock-uplift rates are generally interconnected with a high spatial variability (Figs. 1 and 3, Table S1). More interestingly, a functional relationship between slope and denu-dation emerges from the dataset with the occurrence of a slope threshold at around 25–30◦ (Fig. 5). This threshold is maintained for different
landscape and environmental metrics (Fig. 6), and is most prominent when partitioning the dataset between type-Ia (mean catchment slope < 25◦), type-Ib (25–30◦) and type-II (>30◦) catchments (section 3.3).
Finally, we observed a specific yet spatially variable pattern between mean geodetic rock uplift and catchment-wide denudation, where c. 80% of the studied catchments (mainly located in the Central Alps) show apparent surface uplift over millennial timescales (Fig. 7). We discuss below our results in terms of (1) a general erosion model for the entire European Alps, (2) possible hypotheses for the occurrence of type-II catchments, and finally (3) the implications for our understanding of the Late-Pleistocene Alpine topographic evolution under external and internal forcing.
4.1. General erosion model: Type-I catchments
Type-I catchments, which are characterized by mean catchment slopes <30◦, constitute by far the largest group in our compilation (c.
90%, 333 catchments in total, Tables S1–S3). As such we consider these catchments as representative for inferring a general erosion model at the scale of the European Alps. For these catchments, the above-explored relationships reveal a significant control of topographic slope on mean catchment denudation (Fig. 5, Table S2). Landscape metrics and envi-ronmental variables such as the abundance of bare rock or the basin proportion above the LGM-ELA are also showing a positive correlation with slope (Fig. 6). In general, denudation in type-I catchments can be described using the empirical model proposed by Montgomery and Brandon (2002) and adapted here from a non-linear diffusion erosion mechanism (e.g. Andrews and Bucknam, 1987; Roering et al., 1999) where denudation rates increase non-linearly with slope angle until a threshold (usually referred as the critical slope). A similar functional relationship has already been reported for the Swiss Alps (Norton et al., 2010) and also for different orogens across the world, in particular, the Olympic Mountains (Montgomery and Brandon, 2002), the San Ber-nardino (Binnie et al., 2007) and San Gabriel mountains (DiBiase et al., 2010), the Himalayas (Ouimet et al., 2009) and the western Andean margin of Peru and northern Chile (e.g. Carretier et al., 2013; Reber et al., 2017). Such a non-linear diffusive erosional mechanism likely requires either a pre-existing regolith cover (e.g., LGM till, para/peri-glacial deposits) or other type of non-consolidated material at low ele-vations for the European Alps, or equilibrium conditions between soil production and erosion (e.g. Heimsath et al., 1997). Such a regolith cover is indeed available in all type-Ia basins with non-consolidated materials mantling significant proportions of the landscape (Fig. 6D, Tables S2–S3). In such a system, landscape erosion and sediment evac-uation are accomplished through a continuous down-slope directed transport of the regolith cover over 102–103 years timescales where the
material flux is predicted to correlate positively and linearly with hill-slope gradient (e.g., Tucker and Slingerland, 1997; Schlunegger et al., 2013). This mechanism has been primarily proposed for non-linear
hillslope diffusion (e.g., Roering et al., 1999) and finally results, at a larger scale, in the exponential relationship between denudation and mean catchment slope for type-I catchments (Fig. 5). Under these con-ditions, eroded regolith is thus continuously replaced by on-going sili-cate weathering (e.g., Norton et al., 2016), possibly supported by a positive feedback with vegetation cover (Larsen et al., 2014). We thus propose that the 10Be-derived denudation rates for type-I catchments
reflect the combination of regolith replenishment through weathering processes and the down-slope material transport from hillslopes to river channels. This is especially true for type-Ia catchments, while type-Ib catchments are situated at generally higher elevations/lower vegeta-tion cover (Fig. 6). These catchments start to deviate from a linear relationship between catchment denudation and slope by showing a significant non-linear increase in denudation between 25 and 30◦
(Fig. 5) when approaching the critical slope (30◦). Type-Ia catchments
are overall situated below the LGM-ELA and are thus in a position to host glacial till or other periglacial deposits constituting a ‘special’ regolith with non-consolidated material. Admittedly, type-Ib basins also host glacial and periglacial material (e.g. rock glaciers, scree deposits, allu-vial and debris flow fans and other types of non-consolidated materials), as shown by detailed mapping in e.g., the Italian (e.g., Scotti et al., 2013;
Savi et al., 2014, 2015) and French Alps (Delunel et al., 2014a). How-ever, our analysis has illustrated that type-Ib hillslopes preferentially expose bedrock compared to type-Ia basins, which indicates that non- consolidated materials are likely less available for mobilization at higher elevation (Fig. 6, Table S3). Furthermore, the relatively low el-evations of type-Ia catchments also favour silicate weathering, possibly promoted by the existing vegetation cover. Precipitation rates in the European Alps are high enough for the establishment of a vegetation cover on hillslopes provided that a soil or regolith is present, which is actually expected given the relatively low denudation rates (Norton et al., 2014). Therefore, because precipitation appears not to be a rate- limiting factor for regolith production and erosion in the European Alps, as observed in other settings (e.g. Mandal et al., 2015), this could explain the absence of a clear correlation between modern climate variables and catchment-averaged denudation rates.
4.2. Beyond threshold: Type-II catchments
Type-II catchments (40 catchments, Tables S1–S3) have higher mean catchment elevations within the range of LGM-ELA (Fig. 6E and F), and they also tend to be smaller in size than the type-I catchments (Table S3). Moreover, we have observed no significant correlation between denu-dation and landscape, environmental and geodetic metrics for these oversteepened catchments (Figs. 5, 6 and 7 and Table S2). The only striking observation for type-II catchments is that while mean slopes increase further, denudation rates stay constant or even decrease (Fig. 5). Based on these results, we propose that erosion and sediment transfer are governed by highly stochastic processes such as debris flows, landslides and hillslope mass-failure where the corresponding recurrent time intervals strongly vary and heavily depend on site- specific conditions (see Bovis and Jakob, 1999, for debris flows; and
Korup et al., 2010, for landslides). It has been shown that for very steep catchments, 10Be concentration measured in fine-sand sediments may
underestimate the denudation rate if landsliding generate a large pro-portion of coarse material (Carretier et al., 2015b; Lupker et al., 2017;
van Dongen et al., 2019). Accordingly, it may be possible that with an increasing proportion of coarse material generated in steeper catch-ments, fine-sand sediments may appear less appropriate to infer a cor-rect denudation rate. However, we cannot evaluate these effects with our present dataset and quantitatively assess this potential bias. This would indeed need further research beyond the scope of the present study. Alternatively, for landsliding and particularly for large rock- avalanche events, the corresponding recurrent time intervals could also exceed the time scale captured by cosmogenic 10Be in riverine
leave highly transient signals in the landscape such as hillslopes that may be poorly connected with the drainage network (Korup et al., 2010). The combination of these effects results in a perturbation of the detrital cosmogenic nuclides’ signals because of their stochastic nature (Clapuyt et al., 2019), thereby inducing a potential bias in the apparent denudation rates as effective denudation rates are possibly under-estimated (Yanites et al., 2009). Such underestimates may be illustrated by our 10Be-derived denudation rates for type-II catchments (Fig. 5). However, we observe this specific behaviour for type-II catchments not only for denudation rates (Fig. 5), but a clear transition also exists in the landscape and topographic metrics for type-II catchments (Fig. 6). While topographic relief and bedrock abundance is similar between type-Ib and type-II catchments (Fig. 6B,D), the proportion of oversteepened reaches (>40◦) increases significantly (Fig. 6C) whereas the estimated
LGM ice thickness decreases (Fig. 6E). We interpret these patterns of topographic conditions and denudation rates as an expression of the reinforcement of the stochastic nature of erosion where (periglacial) slope processes are dominant. Alternatively, such oversteepened catch-ments may also reflect transient topographic conditions, with high slopes and low denudation rates inherited from glacial imprint that are not re-adjusted to post-glacial hillslope and fluvial conditions. We thus propose that repeated carving and valley widening during Quaternary glaciations (e.g. Valla et al., 2011) has resulted in a high connectivity between U-shaped valleys and the low-elevation hillslopes due to downward curving of the valley flanks. On the other hand, glacial carving is likely to have caused a partial decoupling between hillslopes, sediment reservoirs and streams above the ELA where steepened to oversteepened hillslopes alternate with local depressions, cirques and steps over short distances. Salcher et al. (2014) proposed that the re-lationships between landscape forms, channel metrics and erosional mechanisms were strongly conditioned by glacial erosion during the LGM and previous glaciations. Fluvial processes dominate catchment erosion at (mean catchment) elevations below the LGM ELA by imposing the local base level and regulating the sediment transfer, which results in denudation rates increasing with slope and drainage density. However such relationships break down for catchment elevations above the ELA (Fig. 6).
Understanding the main drivers for the erosional pattern in the 40 type-II catchments requires further analyses of site-specific conditions, including a detailed inventory of non-consolidated material in these basins, an assessment of the connectivity between these sediment res-ervoirs and the trunk channel network, and an investigation of local precipitation patterns or other modern climate variable (e.g., frost- cracking processes, Delunel et al., 2010). In addition, Mair et al. (2019, 2020) focused on a type-II setting in the Central Alps, and re-ported that understanding the denudation mechanisms and rates for oversteepened landscapes requires the consideration of site-specific bedrock properties (i.e. spacing and orientation of fractures, faults, and schistosity) together with the slope orientation (insolation and associated temperature conditions). Such field of research has yet been poorly investigated, particularly for the European Alps: bedrock with a homogenous lithologic fabric such as limestones and granites may be capable to sustain slopes as steep as 60◦, even at steady state,
consid-ering rock-mechanical aspects (Schlunegger et al., 2013). Indeed, set-tings where bedrock without any fault, fracture or foliation and with very low pore-fluid pressure ratio would, in theory, break at slope angles up to 60◦if deviatoric stresses exceed a threshold. As a consequence,
under such circumstances where bedrock is massive and dry, over-steepened hillslopes can be stable over millennia without failing, as recently shown for the Lauterbrunnen valley, Bernese Alps of Switzerland (Mohadjer et al., 2020). Finally our results for type-II catchments could also witness the lithological impact on denudation rates, with the high erosional resistance of plutonic rocks (e.g. granites) modulating denudation rates in a context where fast and efficient erosional processes would be expected based on landscape/environ-mental metrics (e.g. Molnar et al., 2007; Scharf et al., 2013).
4.3. Late-Pleistocene dynamics of the European Alps
A close correlation between modern rock uplift and millennial catchment denudation was reported for the Central Alps by Wittmann et al. (2007) and further investigated by Champagnac et al. (2009). Such relationship, where sub-region datasets within the Alps have shown a ratio of 0.83 between rock uplift and denudation, has suggested that modern uplift follows the Alpine isostatic response to long-term erosional unloading and topographic evolution (e.g. Champagnac et al., 2007, 2009; Norton et al., 2011). Our Alpine dataset also reveals an apparent link between rock uplift and denudation, yet with a large scatter (Fig. 7). We explain this difference by the larger dataset employed here, which not only allows us to disclose the existing cor-relation between uplift and denudation at the scale of the Alps, but it also unravels spatial variations in denudation rates and more interest-ingly that overall rock uplift rates outpace denudation rates in the Eu-ropean Alps (Fig. 7).
Additional geodynamic mechanisms have also been proposed to explain the spatial patterns in rock uplift across the European Alps: (1) the crustal response to post-LGM ice melting (e.g. Norton and Hampel, 2010; Mey et al., 2016), (2) mantle upwelling (Sternai et al., 2019) and (3) mantle delamination particularly beneath the Western (Baran et al., 2014; Fox et al., 2015) or the Eastern Alps (e.g. Genser et al., 2007). Our
10Be-derived denudation dataset allows to illustrate these mechanisms
at work. In particular, although both rock uplift and catchment denu-dation are spatially highly variable, rock-uplift rates are in general higher than spatially averaged denudation rates, thereby pointing to the occurrence of a surface-uplift signal across most of the Alps. We can further precise this geodynamic picture given the spatial extent and resolution of our dataset: while the Western Alps appear roughly in “equilibrium” between denudation and uplift, the Central Alps appear to rise up significantly, and the Eastern Alps appear to experience a topo-graphic decay (Fig. 7).
The observed surface uplift patterns cannot be explained by an isostatic response to glacial and erosional unloading alone, mainly because the largest signal would be expected in the Eastern Alps where the glacial cover was thickest (Mey et al., 2016) and where long-term erosional unloading is significant (Sternai et al., 2012). We therefore propose to relate the surface-uplift pattern, and especially the significant surface uplift for the Central Alps, to the deep crustal/mantle structures and associated geodynamic processes underneath the European Alps. Seismo-tomographic analyses have shown that the subducted European lithospheric mantle slab, whose loads have been considered as the major driving force for the Alpine tectonic development including uplift of crustal material (Kissling and Schlunegger, 2018), is still attached to the European plate beneath the Central Alps, while it has been delaminated beneath the Western and Eastern Alps (Lippitsch et al., 2003), although this issue is still being discussed for the Western Alps (Zhao et al., 2015). In this context, we can imagine that the Central Alps would still expe-rience active surface uplift and orogenic as well as topographic growth, whereas these processes would have ceased in the Western and Eastern Alps, where uplift would mainly occur through an isostatic response to surface unloading.
5. Summary and conclusions
We compiled published and original in-situ 10Be concentrations
measured in river sediments at the scale of the entire European Alps and inverted this dataset into catchment-averaged denudation rates following a homogenized protocol. While lithology and precipitation controls cannot be identified, or at least play a minor role on catchment denudation at the scale of the entire Alps, a related influence of these variables has been proposed by previous studies at the scale of indi-vidual basins or Alpine sub-regions. Our results reveal a rather high spatial variability in catchment denudation across the European Alps, with no clear influence of modern climate but a first-order control of