Automated Bathymetry Mapping Using an
Autonomous Surface Craft
by
Claudia Doria Rodriguez-Ortiz S.B. Ocean Engineering (June 1996) Massachusetts Institute of Technology
Submitted to the Department of Ocean Engineering in Partial Fullfillment of the Requirements for the Degree of
Masters of Engineering at the
MASSACHUSETTS INSTITUTE OF TECHNOLOGY September 1996
© 1996 Massachusetts Institute of Technology. All rights reserved.
FFEB
1
0
1997
Lm ". a ,' . , a •:': s' "
Author
...
cez neering...
eartment of Ocean Engineering September 3, 1996 I)/'
/i7<
-7
Certified by Accepted by ... "' ... /.. ... . ...:.. .. .. '... . tom.. l''s C ssostomos Chryssostomidis Professor of cean Science and Engineering Thesis Supervisor...
:...
. .. ...
...
... ...
A. Douglas Charmichael
Automated Bathymetry Mapping Using an Autonomous Surface Craft
by
Claudia Doria Rodriguez-Ortiz
Submitted to the Department of Ocean Engineering on September 3, 1996 in partial fulfillment of the requirements for the Degree of Masters of Engineering in
Ocean Engineering
Abstract
In this research, a need for autonomous, economic, time-efficient and accurate bathymetry surveying is identified. To meet this need, ARTEMIS, a prototype Autonomous Surface Craft (ASC), was developed to perform automated bathymetric-data-collection. ARTEMIS contains all the components required to generate bathymetric maps autonomously in real-time. The systems in ARTEMIS were tested individually (with an emphasis on the navigation, guidance and control systems - critical elements for bathymetry surveying) and then integrated into the total system. The GPS-based navigation technique employed in ARTEMIS was found to be adequate for typical bathymetric surveys. A waypoint-following controller based on fuzzy logic was used to guide and control the vehicle. The waypoint-following strategy proved very useful for transect-defined bathymetry surveying. The controller was robust to large external disturbances even on complex survey paths. ARTEMIS has performed automated bathymetry mapping in real-time, creating a high-resolution bathymetry map of a portion of the Charles River in Cambridge, MA. It is demonstrated that real-time automated bathymetry mapping using ASC have the potential to perform high-quality bathymetry surveys faster and more economically than conventional methods.
Thesis Supervisor: Chryssostomos Chryssostomidis Title: Professor of Ocean Science and Engineering
A mi abue Margarita, la mas linda de todo el universo, y a mis maravillosos papas, Doria y Orlando.
Acknowledgements
First of all, I would like to acknowledge my thesis advisor, Dr. Thomas Vaneck, who was patient enough throughout these experiments despite all of Murphy's' attempts to fail us. Thanks, Tom, it has been great working with you.
I am most grateful to Prof. Chryssostomos Chryssostomidis for his support, understanding and guidance. Thank you, Chryss, for keeping me on track at all times, and for looking into the future better than anybody.
The successful completion of these experiments were possible thanks to the contributions of Mads Schmidt.
This work was supported by the M.I.T. Sea Grant College Program. Thanks to Dr. Jim Bellingham, who kindly provided equipment for this project, and Bob Grieve, for helping with operations and equipment loans. I truly appreciate the support and the comments on my thesis of Dr. Jim Bales, Joe Curcio, and Drew Bennett. I appreciate the help of Jim Varnum and Joe Ziehler in the electronic design and testing. I also want to credit my officemates, Drew and Scott Wilcox, for standing my loud music, and my multiple phone calls. I thank 'my pal' Re Re Quinn for being very supportive and for always making me smile. Thanks to all the people at M.I.T. Sea Grant for making my working atmosphere a very pleasant one in my undergraduate and graduate years. I love you all.
I thank the people at the Sailing Pavilion for allowing us to run experiments in their facilities and for allowing us to use their boats.
I value the comments, encouragement, food, and coffee that get me going while writing this thesis, provided by Patty Rodriguez, Kathy Misovec, and Tara Goodman, as well as the remote support of Jamileth Rojas and Cecil Esquivel.
I want to thank the professors that changed the perspectives of my career, Rob Fricke and Judy Kildow.
For the entire length of my studies, I could not have done without the blessings and support of my fun family: my grandmother, Margarita, my parents, Doria and Orlando, my sister Patty and my brother Carlos.
I thank everybody in the Ocean Engineering Department, the most wonderful and friendly Department at M.I.T. In particular, I thank Prof. Doug Carmichael for showing his care and support. I appreciate the assistance of my academic advisor, Prof. Al Brown. Special thanks to Jean Sucharewicz at the Student Administration for always helping me sort out my administrative puzzles, and to Judy Scheytanian for her being so nice and caring at all times.
Contents
A bstract . . . .. . .. . . . .. . . . .. . . .. . . . .. . 2 Acknowledgem ents ... 4 L ist of Figures ... 8 L ist of T ables ... 10 N om enclature ... 11 Introduction ... 13 1.1 M otivation ... 13 1.2 Bathym etry ... 141.2.1 Definition and Brief History ... 14
1.2.2 Bathymetry Needs and Limitations ... 16
1.3 Bathymetry Survey Platforms ... 19
1.3.1 Existing Platform s ... 19
1.3.2 Autonomous Vehicles ... 20
1.4 ASC ARTEM IS ... 22
1.5 Automated Bathymetry Mapping ... 25
1.6 Organization of this Thesis ... 26
System Integration ... 27 2.1 System Description ... 27 2.1.1 Vehicle Hardware ... 29 2.1.2 Vehicle Software ... 32 2.1.2.1 M ain Program ... 32 2.1.2.2 Supervisory Control ... 36 2.2 Navigation System ... 37 2.2.1 Dead-Reckoning Navigation ... 37
2.2.2 GPS and Differential GPS Navigation ... 38
2.2.3 Integrated DR/DGPS System ... 40
2.3 Guidance and Control ... 42
2.3.1 W aypoint-Following Strategy ... 43
2.3.2 Control M ethodologies ... 44
2.3.3 Notions of Fuzzy Logic ... 45
2.3.4 Fuzzy-Logic Control ... 46
2.3.5 Waypoint-Following Fuzzy-Controller ... 50
2.4 Depth Sounder ... 53
2.4.1 Principles of Depth Sounding ... 53
Field Experiments Results and Discussion ... 57
3.1 Experimental Setup ... 57
3.2 N avigation Tests ... 59
3.3 Waypoint-Following Controller Tests ... 63
3.4 Depth Sounder Test ... 71
3.5 Bathymetry Data Collection ... 72
3.6 A Comparison of ARTEMIS with a Conventional Bathymetric Surveying Technique ... 75
Conclusions and Future Work Beyond Bathymetry ... 82
4.1 C onclusions ... 82
4.2 Future W ork: Near-term ... 83
4.3 Future W ork: Long-term ... 85
4.4 Beyond Bathymetry ... 86
A ppendix A ... 89
A ppendix B ... 90
Table of Figures
Figure 1 Seabeam Bathymetry of a portion of Oregon Continental and Adjacent Abyssal
P lain. . . . 14
Figure 2 The 1.4-meter-long Autonomous Surface Craft (ASC) ARTEMIS configured for automated bathymetry mapping. ... 23
Figure 3 Schematic of ARTEMIS in cross-section. ... 24
Figure 4 Real-time Automated Bathymetry Mapping using ARTEMIS. ... 28
Figure 5 Block diagram showing the electronic components in the ARTEMIS system configured for bathymetric-data-collection. ... 29
Figure 6 Software Architecture. ... 33
Figure 7 Dead-reckoning (DR) error. ... 38
Figure 8 DR/DGPS Position estimator block diagram. ... 41
Figure 9 Navigation, guidance and control as nested loops, as applied to a boat. .. 42
Figure 10 Waypoint-following strategy. ... 43
Figure 11 Membership function for the heading variable 0(t) centered at the desired heading (180 ). ... 47
Figure 12 Membership functions for rudder angle. ... 48
Figure 13 Hypothetical case of a FLC for course-keeping when the desired heading is 180 .. ... 4 9 Figure 14 Cartoon showing the process in the fuzzy-logic waypoint-following controller in A RTEM IS. ... 50
Figure 15 Membership functions for the y position variable. ... 51
Figure 16 FAM rule bank associates input fuzzy sets (x, y and 0) with an output fuzzy set (0). . . 52
Figure 18 Representation of the depth sounder beamwidth (0) projected in a horizontal plane. ... 54 Figure 19 Experimental Setup. ... 58 Figure 20 DGPS position fixes recorded over 27 minutes. ... 60 Figure 21 ASC path and the number of satellites or Space Vehicles (SVs) seen by the GPS receiver during a mission. ... 62 Figure 22 ARTEMIS executing a sharp turn. ... 64 Figure 23 Survey showing turn-anticipation behavior. ... 65 Figure 24 Enlarged view of previous figure showing turn-anticipation behavior. .. 66 Figure 25 ARTEMIS performing a survey grid formed with eleven waypoints .... 67 Figure 26 A waypoint without an arrival circle. ... 68 Figure 27 Waypoints with arrival circles. ... 68 Figure 28 M issed approach. ... 69 Figure 29 Enlarged view of the boat's trajectory showing a re-approach to a missed w aypoint. ... 70 Figure 30 A bathymetry map of the Charles River in Cambridge, Massachusetts created by the Autonomous Surface Craft ARTEMIS. ... 73 Figure 31 Survey patterns that generated the bathymetric map. ... 74 Figure 32 Bathymetric map performed by DAMOS in the Royal River, Maine. . . . 76 Figure 33 Autonomous Underwater Vehicle (AUV) Odyssey II. ... 89
List of Tables
Table 1 Data recorded during each control cycle loop. ... . 35 Table 2 Comparison of surveying requirements for DAMOS and ARTEMIS ... 77 Table 3 Comparison of surveying capabilities for DAMOS and ARTEMIS ... 78
Nomenclature
Symbol Definition or Meaning
Al Artificial Intelligence ASC Autonomous Surface Craft AUV Autonomous Underwater Vehicle
AV Autonomous Vehicle
C programming language
CPU Central Processing Unit
CTD Conductivity-Temperature-Depth DAMOS Disposal Area Monitoring System
DGPS Differential GPS
DR Dead Reckoning
EPA Environmental Protection Agency FLC Fuzzy-Logic Controller
FM Frequency Modulated
GB Giga-Byte
GPS Global Positioning System
hr hour
I/O input/ output
kHz kilo-Hertz
m meter
NL Negative Large
NM Negative Medium
NMEA National Marine Electronics Association
NOAA National Oceanographic and Atmospheric Association NS Negative Small
PAH Polycyclic Aromatic Hydrocarbons PCB Poly Chlorinated Biphenyls
Symbol Definition or Meaning
PL Positive Large
PM Positive Medium
PPS Precise Positioning Service PS Positive Small
PWM Pulse Width Modulation
RC Remote Control
rms Root mean square
ROV Remotely-Operated Vehicle
RTCM Radio Technical Commission for Maritime Services SA Selective Availability
sec seconds
SPS Standard Positioning Service
SV Space Vehicle
TPU Time Processing Unit
TT7 TattleTale microcomputer Model 7
TIL Transistor-Transistor Logic
UART Universal Asynchronous Receiver/Transmitter UTM Universal Transverse Mercator
V Volts
CHAPTER ONE
Introduction
1.1
Motivation
This research develops a novel surveying system capable of autonomously creating high-resolution bathymetric maps in real-time. Autonomy has the potential of increasing scientific access to the oceans and coasts, and will aid in maintaining the navigation channels and updating nautical charts, both necessary for safe and efficient marine transportation. Marine transportation plays a key role in promoting trade around the world. In particular, 95% of all U.S. international trade moves through ports [1]. Consequently, a great part of the economy depends on the successful modernization of the water transportation system. This modernization must include expanding navigation channels for larger ships as well as updating nautical charts for enhanced navigation safety, both of which depend on reliable bathymetry information. However, the current methods for surveying bathymetric data are slow and expensive, limiting the areas that can be surveyed. As a result, half of inshore bathymetry surveys that support U.S. nautical charts rely on bathymetric data obtained before World War II [2; 3]. To meet the need for more efficient and cost-effective bathymetric surveys, an autonomous bathymetric-data-collection-system was developed and successfully tested in the field. Increasing bathymetric data acquisition rates can help modernize the marine transportation system, which is essential for efficient trade.
1.2
Bathymetry
1.2.1
Definition and Brief History
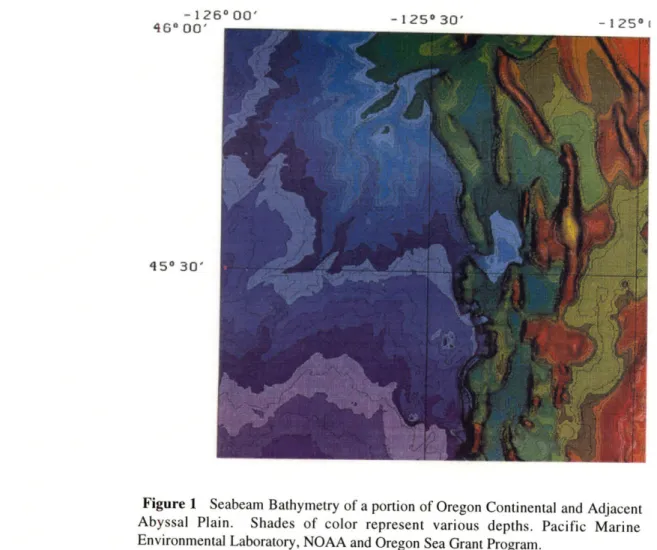
Bathymetric data are measurements of the depth of the water column. The word 'bathymetry' is derived from the Greek bathos, which means depth. A bathymetry chart represents the topography or the contours of bottom depths. Figure 1 shows an example of a bathymetry chart.
- 1260 00'
46 000' - 1250 30' -125 I
q50 30'
Figure 1 Seabeam Bathymetry of a portion of Oregon Continental and Adjacent Abyssal Plain. Shades of color represent various depths. Pacific Marine Environmental Laboratory, NOAA and Oregon Sea Grant Program.
Bathymetric charts have existed for centuries. An Egyptian temple decoration dating from about 1600 BC shows a ship on which a member of the crew is measuring the depth of the water with a long pole [4]. The Viking sailors took soundings (water depth measurements) by hauling in a lead weighted line and measuring it by the span of their arms [4]. Depths are still cited in six-foot (1.8-meter) intervals called fathoms from the Old Norse word
fathmr, which means "outstretched arms" [4]. The water depth continued to be measured
with the sounding line until the introduction of the depth sounder (or echo sounder) more than half a century ago [5; 6]. To create a chart, the lead-line measurements were correlated with a specific location and annotated by a person.
With the depth sounder (described in detail in Section 2.4), we are now able to remotely probe the oceans through acoustic means [5; 7; 8]. A depth sounder can be used to measure water depth data in a surveying grid to create a bathymetry chart. Unlike the sounding line, which offers only depth measurements at a single point, the depth sounder can record a continuous profile of the water column along a line.
Today, the depth measurements can be recorded digitally, allowing data processing and permanent storage. Depth sounding techniques now include equipment other than the conventional depth sounder [9; 10]. Sub-bottom profilers provide information about the layers beneath the bottom floor through the emission of high-power low-frequency signals [1 1]. With electronic sound navigation ranging or sonar, the location of objects within the water column can be determined. Side-scan sonars can provide high resolution images of the sea bed by towing a torpedo-like body with a pair of narrow beam acoustic transducers (an acoustic transducer converts mechanical, electrical or other form of energy into acoustical energy) along the sides [12].
1.2.2
Bathymetry Needs and Limitations
Scientists use bathymetric information for developing water circulation models in littoral regions [13]. Bathymetry maps are used in geophysical map-based navigation for underwater vehicles [14; 5]. The military uses bathymetric data for mine-countermeasure operations [15]. Commercial enterprises use bathymetry information to help locate new fisheries and identify regions with possible petroleum accumulations [13]. In particular, bathymetric data are essential for the successful operation of waterborne commerce, which is crucial to the U.S. economy. Commercial marine transport requires accurate and reliable nautical charts, as well as deep navigation channels to accommodate large vessels. Nautical charts consist of bathymetry charts and other information required for safe navigation. Dredging of navigation channels and disposing the dredged material also depend on bathymetric data because the depth of a channel must be known to ensure the quality of the dredging operation.
The nautical charts for U.S. waters are produced by the National Oceanographic and Atmospheric Administration (NOAA). NOAA is responsible for the charting and updating of approximately 95,000 miles of coastline and 3.5 million square nautical miles of oceans, inland rivers, and lakes [3]. However, nautical charts are outdated mainly due to a lack of efficient and economic hydrographic surveying techniques. In addition to commercial transport, nautical charts are an underpinning of a wide range of enterprises including naval operations, commercial fishing industry, recreational boating and fishing [3]. Non-navigational users include real-estate developers, coastal-zone planners, wetland managers, research scientists, and state coastal regulatory agencies [3; 2].
Nationwide, there is a need to update existing nautical charts and to survey uncharted areas. Sixty percent of the bathymetric data in NOAA's present nautical charts were obtained prior to 1940 [3]. Previous depth measurements taken with lead-line methods are inaccurate and cover less than one percent of the surveyed area [2]. At the same time, these surveys were performed with less sophisticated navigation systems leading to positional errors of 15 to 50 meters [2]. Moreover, there are over 20,000 reported but unsurveyed wrecks and obstructions around the U.S. [2]. As a result of uncharted features, three major vessels have grounded since 1987 [2]. A total of 43,200 square nautical miles have been identified as critical survey areas or areas with inadequate charts that may lead to marine accidents; however, it would take 40 years to survey these critical areas with the current surveying techniques and assets [2].
For the water transportation system to be efficient and to remain competitive in the world market, not only the nautical charts have to be updated but also its navigation channels must undergo periodic dredging for maintenance and improvement. Container ships and tankers have become wider and deeper to meet the increased demand for goods that accompany the rise in human population. Deeper navigation channels are required to accommodate the new generation of vessels. The U.S. Army Corps of Engineers is responsible for dredging over 400 ports and 25,000 miles of navigation channels throughout the U.S. [1]. Bathymetric surveys are necessary before, during, and after dredging to ensure the quality of the dredging operation.
Bathymetry surveys are also required for operations involving the disposal of dredged material. In the U.S. every year there are approximately 400 million cubic yards of dredged material, of which 5% to 10% contain heavy metals and organic compounds such as PAH's and PCB's [16]. The disposal of these contaminated sediments is an issue of
great debate [17] since the contaminated material can be resuspended and dispersed. One method of disposing the dredged material is 'capping' the contaminated sediments with clean sediments in near-coastal waters. Most commonly, the material is placed at offshore sites approved by the Environmental Protection Agency (EPA). For all of these cases, bathymetric surveys are necessary throughout the procedure: before deposition to select a
site, during the deposition process to verify that the material is adequately placed, and periodically afterwards to ensure on a long-term basis that the dredged material remains at the site [1].
Whatever the need for bathymetry may be, a common thread is that the current bathymetric surveying methods are time-consuming, labor-intensive and expensive. During a typical offshore bathymetry survey at a disposal site, a research vessel follows track lines roughly
25 meters apart over an area of approximately two miles by two miles while gathering bottom information. With this method, it takes eight weeks to survey four square miles at a cost of approximately $80,000, which includes the research vessel, crew, equipment and data analysis [18]. The costs rise with the area and the accuracy requirements. Channel surveying can use smaller vessels, but still require a significant number of personnel. The Corps, NOAA, and other organizations that have bathymetry surveying programs are constrained by the limited financial resources available for these purposes.
In response to the need for cost-effective, accurate and time-efficient bathymetric surveying, a mobile platform for autonomous bathymetric data collection was developed. Automated bathymetry mapping using a small Autonomous Surface Craft (ASC) proved to be economic, time-efficient, and accurate. Before introducing the ASC, other methods for gathering bathymetric information are briefly examined.
1.3
Bathymetry Survey Platforms
Existing survey platforms include surface vessels, manned submersibles, towed sensors, remotely operated vehicles (ROVs), remote-sensing satellites, and autonomous underwater vehicles (AUVs). The methodology chosen to collect bathymetric data depends on the particular application and the resolution and accuracy requirements. Surveys range from searching for large objects on a flat and smooth bottom to trying to locate fisheries on a rocky seafloor. The site to be surveyed may vary in terms of depth, current, slope, contour, rockiness, among other characteristics.
1.3.1
Existing Platforms
By far the most common bathymetry survey platforms are ships or small vessels operated by a crew. Surface vessels as survey platforms have been, and are today, largely
indispensable. Nevertheless, their use is limited due to costs of operation and complicated logistics.
Submarines with crew offer deep measurements and excellent maneuverability. The drawbacks are the risk posed to the human lives aboard and the high operation costs. When bathymetric data is collected from a manned submersible, there is usually another task involved because the high costs cannot be justified for routine bathymetry survey work.
ROVs and towed platforms have proven to be very useful surveying tools for microbathymetric studies in relatively limited areas [5]. Power, as well as high-bandwidth real-time data such as acoustic and video images can be transmitted through the tether attached to the ROV. However, ROVs and towed sensors require support vessels and personnel for their operation, making the process slow, especially for surveying large areas. In addition, the operation of a research vessel with crew and scientists can be very costly.
A more recent technology involves the use of remote-sensing satellites to make observations of the ocean over long distances. In this fashion, two-dimensional synoptic views can be created such as temperatures of surface waters, sea state and ice conditions, and surface currents [5; 19]. However, neither visual nor radar photographic techniques have great potential for deep bathymetric work [5; 19]. Satellite remote-sensing may prove beneficial for shallow harbor surveys, yet it needs to be ground-truthed with other methods.
Autonomous marine vehicles are emerging technologies that introduce a whole new concept in data collection. The following section describes the advantages and disadvantages of this technology.
1.3.2
Autonomous Vehicles
Advances in robotics and automation have made possible the construction of autonomous vehicles (AVs) for scientific and industrial uses. Here 'autonomous' denotes an unmanned, untethered vehicle with an onboard guidance computer.
An autonomous system has an advantage over towed vehicles and ROVs in that there is no tether that may limit the performance of the vehicle by complicating the dynamic behavior, snagging or becoming tangled. Free from physical attachments an AV can travel faster and more efficiently. The trade-off is that there is limited energy since most AVs are battery-operated, which imposes power constraints on both propulsion and the sensors that can be carried. Without a tether, data can be transmitted via radio link or acoustic modem but at a much lower bandwidth [20]. Because not all data are transmitted, an AV needs a large onboard data storage capacity.
Bathymetry surveying with autonomous vehicles can be economical. By building small AVs, the support equipment and the size of the support vessel can be reduced [22]. Depending on the degree of autonomy, little or no human intervention is required during a preset mission. For bathymetry data collection this is particularly useful because an AV can be commanded to survey an area in fine grid spacing - repeatedly if necessary - a tedious and time-consuming task for a human being. With less support personnel and equipment an AV survey can be done at minimal operation costs.
Though surveying with AVs is a very attractive concept, achieving autonomous behavior is a challenging task. State-of-the-art control and navigation systems are needed to carry out a fully autonomous mission, which includes surveying, path following, obstacle avoidance, rendezvous and docking, and failure detection and recovery [14].
Although research and development of AVs have significantly increased in the past two decades, very little has been done with autonomous surface vehicles. Several Autonomous Underwater Vehicles (AUVs) are being built in the United States, Japan and other countries [23]; however, previous work regarding autonomous surface boats is sparse.
An autonomous surface vehicle embodies all the advantages mentioned above plus the additional feature that it can provide a bridge between the air and the water. Unlike an underwater vehicle, an autonomous boat is not shielded by sea water and can be equipped with a radio modem, allowing a two-way communication in real-time with a land-based station. Similarly, a surface vehicle can use the Global Positioning System (GPS) or a radio-based navigation technique, options generally not available to an underwater vehicle.
1.4
ASC ARTEMIS
The aim of this research project is to develop a prototype autonomous surface craft (ASC) and to demonstrate its capabilities for economical collection of bathymetric data. The long-term goal of this research is to develop future generations of low cost, high-efficiency, autonomous surface vehicles for oceanographic, industrial and environmental surveys. The intent is not to replace existing technologies, but to create an additional surveying method for the scientific, industrial, and governmental communities that may prove more convenient and economic. In some situations ASC may assist other surveying methods to jointly provide marine data. The success of such innovative technologies rests on the realization of prototype development projects. With this motivation, the ASC ARTEMIS - a first generation autonomous surface craft - was designed, constructed and tested.
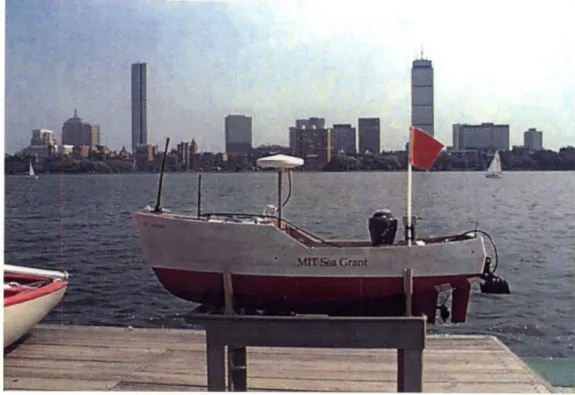
ARTEMIS is a battery-operated mobile instrument platform that is able to navigate autonomously and collect bathymetric data (See Figure 2).
Figure 2 The 1.4-meter-long Autonomous Surface Craft (ASC) ARTEMIS configured for
automated bathymetry mapping. ARTEMIS is equipped with a microcomputer for
autonomous guidance, a GPS system for navigation, a depth sounder for bathymetric-data-collection, and a radio modem for data transmission in real-time.
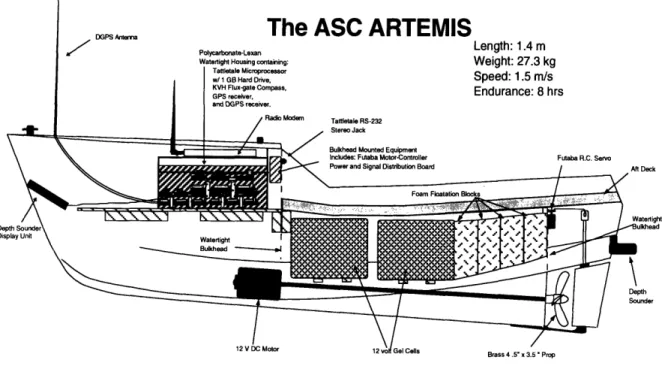
The hull of ARTEMIS is a 1/17th scale model of a 76-foot New England fishing trawler with a length of 1.4 meters, a beam of 0.4 meters and a displacement of 27.3 kilograms. This model was previously used for resistance tests at the M.I.T. Ocean Engineering Testing Tank. An aft compartment houses the batteries while a waterproof enclosure containing all the electronic components is mounted in the forward compartment (Figure 3). The hull's small size and weight greatly simplify the deployment reducing the support personnel and hence the operation costs.
DGPS Antema
7
Polycarbonate-LexanThe ASC ARTEMIS
Length: 1.4 rWatertight Housing containing: Weight: 27.3 kg
Tattletale Microprocessor
w/ 1GB Hard Drive, Speed: 1.5 m/s
KVH Flux-gate Compass, Endurance: 8 hrs
GPS receiver,
and DGPS receiver.
Radio Modem Tattletale RS-232
Stereo Jack
Bulkhead Mounted Equipment
Includes: Futaba Motor-Controller Futaba R.C. Servo
Power and Signal Distribution Board / Aft Deck
Dep
Disl
Depth
Sounder
12 V DC Motor
Figure 3 Schematic of ARTEMIS in cross-section. The aft compartment houses the batteries.
Most of the electronic components are kept in a water-proof housing in the forward deck.
1.5
Automated Bathymetry Mapping
To demonstrate the vehicle's capabilities it was used to obtain a high-spatial-resolution bathymetry map of a portion of the Charles River in Cambridge, Massachusetts. This bathymetry map is particularly useful for an on-going research project in which the AUV
Odyssey (See Appendix A) will navigate by following bottom features. Acquiring
high-resolution bathymetric data involves accurately tracking the vehicle's position while measuring the water column depth. To operate autonomously effective navigation, guidance, and control schemes were developed.
Bathymetric data is useless without precise knowledge of the vehicle location at the times of data collection. The determination of the vehicle's location within a prescribed grid is referred to as 'navigation'. GPS was the most convenient, accurate, and economic option to obtain position information for ARTEMIS. For this purpose a GPS-based navigation technique was developed, which is described in Section 2.2.
Once position is determined, the next problem is to maneuver the vehicle along a prescribed path while compensating for vehicle drifts due to environmental disturbances. This is carried out by a guidance controller. In this context, guidance refers to the action of
determining the course to be followed by the vehicle, while control refers to the actions
taken to move the vehicle along a specified path [24]. Control can be achieved by using model-based approaches; however, for this application a 'model-free' control theory based on fuzzy logic is applied. Fuzzy-logic control provided fast development time of an accurate guidance controller for ARTEMIS. The fuzzy guidance-controller is described in detail in Section 2.3. The design of the vehicle hardware and software focused on attaining accurate navigation and control.
1.6
Organization of this Thesis
This chapter is an overview of bathymetry, the needs for bathymetric data collection, and various approaches to bathymetry surveying. Chapter 2 explains how concepts in navigation and control and existing instrument technologies are synthesized into a novel bathymetric-data-collection system. Chapter 3 discusses the results of the field experiments and compares automated bathymetry mapping to a conventional bathymetry surveying method. Finally, Chapter 4 states the conclusions of this research project and identifies areas of future work.
CHAPTER TWO
System Integration
Automated bathymetry mapping is achieved by coupling an accurate navigation technique, an effective control system, a water depth sensor, and data storage. The first step in the development of the ASC ARTEMIS involves the integration of the hardware components, among these, a main onboard computer with large data storage capability, a GPS system, a compass, a radio modem, and a depth sounder. The second step is to design the control software. The third step involves preliminary testing of the navigation and control systems. The final step is to integrate all the elements into an automated-bathymetry system to be operated in the field. The field experiments that demonstrate the capabilities of ARTEMIS are presented in Chapter 3.
The vehicle's hardware is described in Section 2.1.1. The software to control the vehicle is discussed in Section 2.1.2. The details regarding navigation and control are described in sections 2.2 and 2.3 respectively. Finally, the operation of the depth sounder and the limitations to the accuracy of the bathymetric data are discussed in Section 2.4.
2.1
System Description
Figure 4 shows a cartoon of the automated-bathymetry system. In a bathymetry surveying mission ARTEMIS is programmed to follow a survey grid. During the mission bathymetric and position data are collected by ARTEMIS and transmitted to a land-based computer via a radio link. At the land-based station, a color-coded bathymetry map is created in real-time using a MATLAB® script. This allows continuous monitoring of both
Automated Bathymetric Mapping
DGPS
Corrections
RF Link
Figure 4 Real-time Automated Bathymetry Mapping using ARTEMIS. ARTEMIS navigates using DPGS position information while collecting bathymetric information with a depth sounder. Position and bathymetric data are transmitted to a land-based station via radio link, where a bathymetry map is created in real-time.
the position of the vehicle and the bathymetry beneath it. At the same time data is recorded onboard ARTEMIS for later retrieval. Although surveying can be done fully autonomously, a human operator at the land-based station can send basic control commands to ARTEMIS to modify the mission while in progress.
2.1.1
Vehicle Hardware
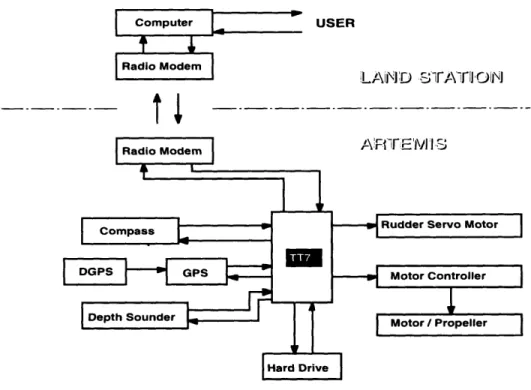
To reduce development time, minimize cost, and to allow an easy transition to the construction of multiple vehicles, ARTEMIS is built primarily with commercially-available components. In this section, the electronic components of the ARTEMIS system are described. The main subsystems that comprise the hardware in ARTEMIS as adapted for bathymetric surveys are shown in Figure 5.
Computer USER
Radio Modem
Figure 5 Block diagram showing the electronic components in the ARTEMIS system configured for bathymetric-data-collection. The main computer onboard is a Tattletale® Model 7 (TT7), which communicates with the other electronic components through its 16-channel Time Processing Unit (TPU).
The Tattletale® Model 7 (TT7) microcomputer runs the control software in ARTEMIS. The user downloads the mission to the TT7's through an RS-232 cable, which is detached after completion of the download. Throughout the mission the TT7 obtains heading information from the compass and position information from the GPS. Using these data, the control program in the TT7 computes the appropriate steering commands for the rudder servo motor (see Section 2.1.2). As this is being done, bathymetric data is collected with the depth sounder and transmitted to a land-based station, consisting of a computer and a radio modem, where a bathymetric map is generated in real-time. All data are stored on the ASC in a 1-GB hard drive and can be retrieved upon recovery of the vehicle.
ARTEMIS obtains heading information with a KVH® C100 SE-10 fluxgate compass. The fluxgate consists of a magnetic field sensor, in this case an inductor, which senses the horizontal component of the Earth's magnetic field. The KVH® sensor is gimbaled, permitting operation through +45 degrees of tilt (pitch and roll). The compass communicates with the TT7 through its RS-232 serial port.
An Ashtech® GPS receiver and an Accqpoint® FM Differential GPS (DGPS) data receiver provide position information (the operation of the GPS and DGPS systems are described in Section 2.2.2). The Ashtech® sensor can track up to 12 satellites (SVs or Space Vehicles) at a time. With three SVs in view, the GPS receiver can compute and time tag the two-dimensional position of its antenna. Position accuracy is typically 16 meters rms [25]. Because this accuracy does not suffice for high-resolution bathymetry surveying, the GPS data is corrected with real-time differential measurements.
The Accqpoint® DGPS receives the differential corrections transmitted by a commercial service. It transmits differential corrections to the GPS receiver in RTCM format through
one of the two RS-232 serial ports in the GPS receiver. The second serial port in the GPS receiver is used to communicate with the Tattletale® microcomputer.
The TT7's TPU can generate pulse width modulation (PWM) waveforms with a duty cycle range from 0 to 100%. A PWM message is transmitted by modulating the signal's amplitude, thus changing the characteristics of the carrier wave (e.g., the length of the pulse). The PWM signals drive the servo motor which actuate the rudder. The propulsion system consists of a 12-volt brushed DC motor, a PWM-controlled motor control system, and a four-bladed brass propeller.
The bathymetric data is collected using a West Marineo D100 echo sounder with a 200 KHz, 12'-beam transducer. It provides depth readings from 1 to 130 meters in NMEA format. For communication in real-time with ARTEMIS from a land-based station, a pair of ProxLink® PL radio modems are used. The ProxLink® radio modems allow wireless RS-232 communication over a range of up to 1000 feet [26].
An attractive feature of the TT7 is its sixteen channel time processing unit (TPU) and built-in library of interrupt-driven, asynchronous, serial I/O functions. Each of the channels in the TPU can be opened independently for UART input or output and the TTL logic levels can be converted to the RS-232 standards. This furnishes enough channels to permit serial communication with the heading sensor, the GPS receiver, the radio modem, and the depth sounder. Currently, the TT7 uses ten out of the sixteen channels in the TPU (eight for the electronic components and two for the PWM signals used for motor and rudder control). Therefore, it is possible to obtain two-way communication from three additional environmental sensors capable of outputting over a serial (RS-232) port.
Power is supplied by two 12-volt, 26-Amp/hr lead-acid gel-cell batteries. One battery powers the electronics, the other provides propulsion power. With the present configuration the boat can cruise at approximately 1.2 m/sec with an endurance of approximately 8 hours, affording multiple, long-duration runs between recharges.
2.1.2
Vehicle Software
In this section, the general structure of the control software is discussed at a high level leaving the details of the control algorithm for Section 2.3. The software for the TT7 is developed in C on a Macintosh® computer then cross-compiled and downloaded to the TT7. Before each mission, the user must create an input mission file, which contains all the necessary parameters to run a mission. These parameters include the desired motor speed and a list of waypoints that determines a survey path. The main program that runs the vehicle is described in Section 2.1.2.1. The interaction between ARTEMIS and the land-based station via radio link is described in Section 2.1.2.2.
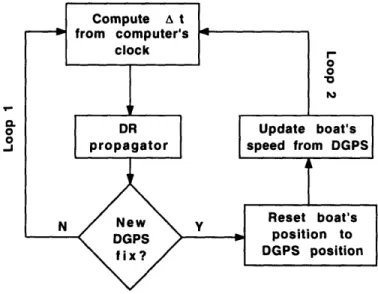
2.1.2.1 Main Program
The structure of the software is shown in Figure 6. After the initialization routine, the first waypoint in the list is selected. The current position and heading of the vehicle are determined and compared to this waypoint. If the vehicle has not reached the waypoint, the guidance controller computes a new rudder command for the rudder servo. The program loops until the waypoint is reached, at which point the next waypoint is activated. Once the
Figure 6 Software Architecture. The location of the vehicle is estimated, and the rudder angle required to reach the desired position and heading is computed. The program loops until a list of waypoints is completed.
START
In the initialization phase, two TPU pins are configured for rudder and motor control. Eight more TPU pins are configured as the serial inputs and outputs for the compass, GPS, radio modem, and depth sounder. At the start of a mission, the compass and the GPS are initialized, and an initial heading and GPS position fix are obtained. The desired speed is obtained from the input file, and the appropriate PWM signals are sent to the motor controller. The calculations to obtain the parameters that define the PWM waveforms (for both motor and rudder servo motor) are shown in Appendix B. At this point, the list of waypoints is obtained from the input file and the waypoint loop begins.
At the beginning of each execution of the control loop, the position of the boat is estimated by using a dead-reckoning algorithm updated with a GPS position fix (the position estimator is described in Section 2.2). To obtain heading and position information, query commands are sent to the compass and GPS respectively. A parsing routine extracts position and information from the GPS and compass NMEA response messages. Estimated position and heading are the inputs to a guidance controller that computes the rudder angle necessary to steer the boat to its destination. (The details of the controller are described in Section 2.3.) Each new commanded rudder angle is sent by the TT7 to the rudder servo motor in PWM waveforms.
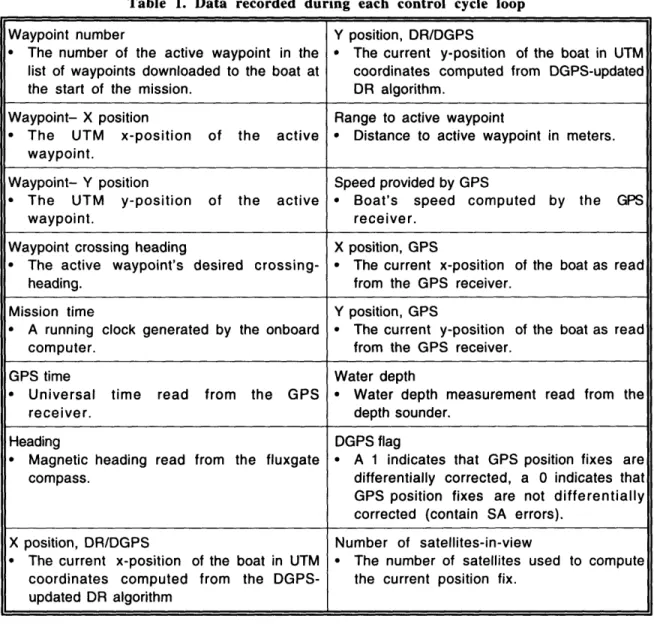
All relevant information in a mission is permanently stored in the hard disk drive. Table 1 shows all the elements contained in the output data file. Before the program terminates, a routine disables all the PWM lines and serial ports, and closes all files.
Table 1. Data recorded during each control cycle loop
Waypoint number Y position, DR/DGPS
* The number of the active waypoint in the * The current y-position of the boat in UTM
list of waypoints downloaded to the boat at coordinates computed from DGPS-updated
the start of the mission. DR algorithm.
Waypoint- X position Range to active waypoint
* The UTM x-position of the active * Distance to active waypoint in meters.
waypoint.
Waypoint- Y position Speed provided by GPS
* The UTM y-position of the active * Boat's speed computed by the GPS
waypoint. receiver.
Waypoint crossing heading X position, GPS
* The active waypoint's desired crossing- * The current x-position of the boat as read
heading. from the GPS receiver.
Mission time Y position, GPS
* A running clock generated by the onboard * The current y-position of the boat as read
computer. from the GPS receiver.
GPS time Water depth
* Universal time read from the GPS * Water depth measurement read from the
receiver. depth sounder.
Heading DGPS flag
* Magnetic heading read from the fluxgate * A 1 indicates that GPS position fixes are
compass. differentially corrected, a 0 indicates that
GPS position fixes are not differentially corrected (contain SA errors).
X position, DR/DGPS Number of satellites-in-view
* The current x-position of the boat in UTM * The number of satellites used to compute
coordinates computed from the DGPS- the current position fix.
2.1.2.2 Supervisory Control
Although ARTEMIS may remain autonomous at all times, basic commands can be sent to the vehicle while a mission is in progress. The supervisory control mode consists of a series of control commands listed below:
This command allows starting the mission remotely after the control program is downloaded onto ARTEMIS and the tether is detached.
SKIP
WAYPOINT-
HOME-When the vehicle receives this command, it omits the next waypoint in the list.
Upon receipt of this command, ARTEMIS returns to the mission starting point.
PAUSE/
RESUME-
STOP-With these commands, the mission can be suspended and restarted.
This command terminates the mission, i.e., the program is halted
START-2.2
Navigation System
This section describes the position estimator previously mentioned in the context of the software architecture. Navigation in ARTEMIS evolved from being a pure dead-reckoning (DR) system to a more elaborate system that employs the Global Positioning System
(GPS). An overview of DR and GPS navigation is given as well as a description of the
integration of the two techniques.
2.2.1
Dead-Reckoning Navigation
In the initial stages of the development of ARTEMIS, dead-reckoning2 (DR) was the most obvious choice for navigation because it is simple and self-contained, i.e, it does not require external positioning references, such as acoustic beacons, radio stations or satellites. A DR estimation of the vehicle's position is merely the integration of the vehicle velocity in time. If the speed, the heading, and the travel time are known, the current position relative to the previous position can be estimated with simple kinematics.
In short range surveys and under favorable conditions, fairly accurate results can be acquired with an accurate compass and speed log. However, this method does not account for velocity components added by external forces such as winds and currents. For example, when a constant current causes the boat to drift, as shown in Figure 7, the DR calculation does not reflect the true position.
2 The term DR comes from "deduced" positioning, spelled as "dead" it also means "certain" or "exact" as in the expression "dead ahead" [27].
DR Position
True Position
/
! A !
current
Figure 7 Dead-reckoning (DR) error. A boat travel course is affected by a current. DR estimation and true position differ from each other because the force from the current is not being accounted for in the DR estimation.
These environmental factors may generate position inaccuracies that propagate with time. Since the determination of the current position requires knowledge of the previously determined position, any errors in heading and speed measurements accumulate even if subsequent measurements improve. One way of preventing this error accumulation is to obtain periodic position updates using an external navigation method. For this purpose, a GPS-based system provides an additional measurement of position. Before describing this technique in Section 2.2.3, the basic concepts of GPS are introduced.
2.2.2
GPS and Differential GPS Navigation
Global Positioning Systems are space-based radio-positioning systems that provide all-weather, 24-hour, three-dimensional position, velocity and time information to suitably equipped users virtually anywhere in the world [28]. There are two satellite-based navigation systems in operation: NAVSTAR provided by the U.S., and GLONASS
developed by the Russian Federation. Equipment can be purchased by civilians around the world for restricted access to either or both systems. ARTEMIS is equipped with a GPS receiver that observes the NAVSTAR system.
A GPS receiver computes a radial distance from the center of the Earth using GPS satellites as navigation references. The range to the satellite is obtained by measuring the travel time of the satellite signal to the GPS receiver. When four space vehicles (SVs) are observed simultaneously, the receiver can determine three-dimensional position. Three SVs can be used to compute a two-dimensional position with a constant height.
The NAVSTAR system, operated by the U.S. Department of Defense, offers the Standard Precision Service (SPS) and the Precise Positioning Service (PPS). SPS is the standard specified level of positioning and timing accuracy that is available to any civilian user on a continuous worldwide basis. For national security reasons, this signal (denoted as S-code) is degraded through a process called Selective Availability (SA). When SA is turned on, the civilian user is able to obtain a horizontal positioning accuracy of order 100 meters. The P-code provided by the PPS is more accurate and it is not subject to SA; however, it is limited to authorized governmental and defense uses. The P-code is encrypted to prevent unauthorized use.
GPS signals may be degraded by sources of error other than SA or may be blocked in an urban environment. Multipath signals, e.g., reflecting from nearby objects such as buildings, can introduce large errors in the range. Errors can also be introduced when the GPS receiver changes the set of satellites used for position computation. At times, buildings may block GPS signals and the receiver may not find enough satellites to compute a two-dimensional position. During our experiments, at least three satellites were
in view most of the time. Additional sources of error include clock deviation and changing radio propagation conditions in the ionosphere [28].
One method to improve the accuracy of GPS navigation is a Differential GPS (DGPS) system. DGPS is based on the principle that most errors seen by GPS receivers in a local area are common errors and can be filtered with an appropriate technique. A stationary reference station with known coordinates continuously receives GPS position updates. Due to SA and other errors, the computed position is changing even though the base station is not moving. The difference between the known position and the computed position reflect the bias errors in the GPS signal.
Once the error in a local area is known, it can be subtracted from the GPS solution obtained from a GPS receiver at a nearby unknown location. This can be done during post-processing, or in real-time if the error is transmitted to the moving GPS receiver. One way of obtaining real-time differential corrections is through commercial services that use radio or television subcarriers to transmit DGPS corrections. These signals are received by the DGPS data receiver on ARTEMIS which transmits them to the onboard GPS receiver.
2.2.3
Integrated DR/DGPS System
To reduce the error in a dead-reckoned position, differentially-corrected GPS position fixes are used as an additional source of position information. GPS data is external to the system, thus preventing the unbounded error in DR navigation. A block diagram of the integrated DR/DGPS system is shown in Figure 8. The DR position propagator (Loop 1) is active until a full data-set is received from the GPS sensor. In this loop, the last GPS-derived boat speed and the time between position estimates (approximately 0.2 seconds) are
passed to the DR propagator to obtain the current position estimate. The GPS receiver provides a position update approximately every second in the form of geodetic latitude and longitude. The GPS NMEA string is parsed and converted to flat surface coordinates by using the UTM (Universal Transverse Mercator) mapping-projection technique. Because the error in the raw GPS position fix is not acceptable, the software in the boat uses only differentially-corrected position fixes for navigation. Every differentially-corrected GPS position update resets the initial conditions in the DR algorithm and the subsequent position estimate is computed based on the current information from the DGPS (Loop 2). The speed employed in the DR calculation is also derived from GPS information (position and time). By changing the DR point of reference and the vehicle's velocity with each DGPS update, the unbounded error propagation inherent to DR is prevented. The integrated DR/DGPS position estimator does not filter either the DGPS position fixes or the DR position estimates. Field tests have shown that this system works well with little or no noticeable jumps in the estimated position when a new GPS position fix is received.
0.
0
-J
Figure 8 DR/DGPS Position estimator block diagram. This diagram shows the control flow in the position estimator.
2.3
Guidance and Control
In the absence of automation a person trying to take a boat from one position to another first considers her present position and course in relation to the desired position and course. Then she chooses a specific speed and heading. To maintain the course of her boat she uses her expert knowledge. That is, her experience and intuition tell her how much the helm needs to be turned and when to straighten it. She checks the heading and position periodically and makes appropriate corrections. An ASC is expected to perform this operation reliably without human interaction. The problem is broken down into navigation, guidance and control. This is shown in Figure 9. The previous section described the navigation system in ARTEMIS. This section presents the fuzzy-logic approach to guidance and control.
Figure 9 Navigation, guidance and control as nested loops, as applied to a boat.
Desired
2.3.1
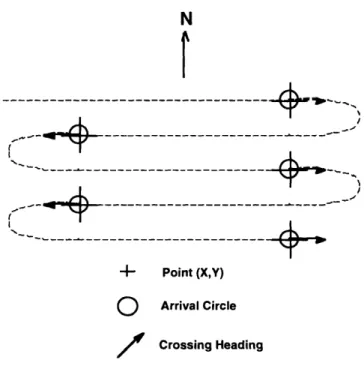
Waypoint-Following Strategy
In a conventional bathymetry survey, a vessel guided by a helmsman follows track lines or transects. For each transect, the helmsman steers the vessel in a straight line to an imaginary point at a distance. The control strategy for autonomous operation is to form the desired trajectory by connecting a series of waypoints. A waypoint is defined by a position, a crossing heading and an 'arrival' circle. To reach a waypoint, the boat must enter the arrival circle on the specified heading (Figure 10). When a waypoint has been reached, the next waypoint in the list is activated. By forcing the vehicle to cross at a specific heading, smooth trajectories can be accomplished with only a few waypoints. For bathymetry surveying, the waypoints can be defined with opposite consecutive headings, as shown in Figure 10, which allows for closely-spaced transects.
N
---
~---
~~C~--~---~---
,,,,-4- Point (X,Y)
O
Arrival Circle/
Crossing HeadingFigure 10 Waypoint-following strategy. A bathymetry survey can be performed by connecting a series of waypoints defined by their position coordinates, an arrival circle, and a crossing heading.
2.3.2
Control Methodologies
Autonomous control can be achieved in many different ways. Model-based approaches have proved effective and successful in solving well-defined problems [29]. A more recent control methodology is intelligent control, such as neural networks, genetic algorithms and fuzzy logic.
Model-based control relies on a mathematical model to predict the behavior of a system. A model, however, is always a simplification of reality, requiring assumptions. For example, Nomoto's first order model for a ship's motion [24] is:
TO " + 0 '= KS
where
4
is the yaw angle, T is the system's time constant, K is the gain, and 8 is the disturbance. Using this model, a course-keeping autopilot can be designed with a simple proportional-integral-derivative (PID) controller. However, the vehicle's kinematics and dynamics change with the vehicle's configuration, making modeling difficult. If at a later stage in the evolution of the vehicle there are size or weight modifications that change the dynamics of the vehicle, a reevaluation of the time and gain constants will be necessary. If the environmental disturbances such as wind, waves and currents deviate from those modeled, the performance of the controller will be affected. This means that conventional controllers must be designed very conservatively to ensure robustness. As more inputs affecting the system response need to be considered, the mathematical model becomes more complex and detailed. In particular, a robust controller for a ship may require including nonlinearities that are difficult to model and control.An alternative to model-based control is intelligent control, where the control algorithms are developed by emulating certain characteristics of intelligent biological systems [30]. For
instance, an artificial neural-network can learn by observing the system's behavior and can be used to control highly-nonlinear systems [30; 31]. Genetic algorithms can artificially "evolve" a controller to produce better solutions to a specific control problem [30]. For the objective of this thesis, which is to build a test platform to prove the concept of bathymetric surveying with ASC, fuzzy-logic control offers the most favorable and time-efficient way of developing a robust controller. The 'model-free' nature of fuzzy systems allows for rapid design and implementation of control laws without having to develop nonlinear dynamic models or complex control-system-architectures [32]. The fuzzy-logic controller is not as sensitive to changes in the vehicle configuration and it is robust to environmental disturbances.
2.3.3
Notions of Fuzzy Logic
In conventional (or bivalent) logic statements are either true or false, 1 or 0, white or black, nothing in between. Fuzzy logic, on the other hand, allows fractions, partial truths, shades of gray. Black and white are the extremes in a wide spectrum. The essence of fuzziness lies in that opposites are identical in nature, but different in degree [33; 34]. For example, there is no difference between "light" and "darkness" or between "large" and "small". The truth of any statement is a matter of degree.
The notions of fuzzy logic have been known for centuries. Hermetic philosophy of ancient Egypt and Greece clearly revealed fuzzy ideas in the 'Principle of Polarity' [33]. The
sorites paradox of ancient Greek philosopher Zeno questioned bivalency [34]. Modern
philosophers like Rend Descartes, David Hume, Werner Heisenberg, Bertrand Russell have also stated fuzzy concepts in one way or another [34]. Fuzzy logic theory as it is known and used today was introduced in 1965 when Lofti Zadeh published his work on
"Fuzzy Sets" [35]. During the 1980's the ideas of fuzzy set theory were more fully developed with some initial applications to show the fruits of this approach to control. The 1990's is a period of "fuzzy boom", in which fuzzy appliances and products have generated billions of dollars, particularly in Japan and more recently in the U.S. [36].
2.3.4
Fuzzy-Logic Control
The controller in ARTEMIS is designed to emulate a human's deductive process when steering a boat. A person manually steering a boat would check the heading periodically and correct it by turning the helm. The person knows that a hard turn of the rudder causes the boat to make a sharp turn. In the person's mind, the intuitive knowledge of how much the boat turns by turning the helm does not have a precise numerical value or a crisp value, in other words, it is fuzzy. In computing and reasoning, humans employ words that are relative and vague. These words can be represented with fuzzy sets [37], which are sets whose members belong to them to some degree. A fuzzy set is multivalent, which is essential to capture the vagueness in words.
A fuzzy control-system consists of an input-fuzzification interface, a Fuzzy-Associative-Memory (FAM) mechanism, and an output-defuzzification interface. To illustrate how a fuzzy-logic controller (FLC) works, a course-keeping controller is considered. The input to such controller is the measured heading.
The words that a helmsman would use to describe the difference between the measured heading and the desired heading do not have a clear distinction between one another and can be represented by the fuzzy sets: ZERO (ZE), POSITIVE SMALL (PS), POSITIVE MEDIUM (PM), POSITIVE LARGE (PL) and the mirror image for the negative side.
These fuzzy sets can be expressed in membership functions centered at the desired heading
(1800 in this example). The membership function for the input heading variable are shown in Figure II1. Adjacent membership functions overlap because of the vagueness in the linguistic terms. For example, an expert would say that a measured heading of 1350 (a heading error of 450) is more than "Negative Small" but is less than "Negative Medium" (NM). This error can be said to have attributes of both of these sets: it is to some degree both negative small and negative medium. This concept of belonging to both of these sets is graphically illustrated by the overlap shown in the figure.
The form of the membership functions (both number and placement) used in the ARTEMIS fuzzy control code were developed by first using intuition and then testing using simple simulations. Part of the 'art' of designing a fuzzy controller is deciding on the number of membership functions, their shape, and their placement. More precise control require more and thinner sets. Contrary to artificial intelligence (AI) based on bivalent logic, fuzzy logic allows gradual transitions without a large number of rules.
1
m(
)
KiD kIRA KlC 717 0C DLI
(t) boat
Figure 11 Membership function for the heading variable 0(t) centered at the desired heading (180").
In the input-fuzzification interface, the crisp input values are categorized qualitatively with fuzzy sets. Each input belongs to a fuzzy set with a degree of membership, m(e). For a
particular input, most of the degrees of membership will be zero, except for one or at most two non-zero degrees of membership, which must add to unity.
When asked what action she would take given a heading error, a helmsman would respond using linguistic terms such as: small amount of right rudder (POSITIVE SMALL, PS), medium amount of right rudder (POSITIVE MEDIUM, PM), hard right rudder (POSITIVE BIG, PB). As before, these fuzzy sets are expressed in membership functions (Figure 12).
1
m(e)
e
(t)
-30 -20 -10 0 10 20 30
Figure 12 Membership functions for rudder angle.
Input fuzzy sets and output fuzzy sets are related through the FAM mechanism. In a FAM system, the 'experts' knowledge is quantified in a bank of IF-THEN rules. For example, if the heading error is NS (indicating that the boat is slightly to the left of the desired course), the rudder needs to be turned to a PS angle (rudder would be turned slightly to the right). Another way of expressing this is:
If (heading error is NS) then (turn rudder PS).
Each input fuzzy set is mapped to an output fuzzy set in this way. For this simple example, a complete FAM matrix would appear as:
PB PM PS heading error ZE NS NM NB The FAM rules are fired parallely and partially once to some degree.
rudder command NB NM NS ZE PS PM PB
[34], meaning that they are applied all at
Going back to the example, if the input to the course-keeping controller is 1350, it belongs to the fuzzy set 'NS' with a degree of membership of 0.4 and to the set 'NM' with a degree of membership of 0.6. These input fuzzy sets are mapped to the output fuzzy sets (rudder command) through the FAM matrix, in this case activating the 'PS' set to a level of 0.4 and the 'PM' set to a level of 0.6. The crisp (scalar) rudder command angle is found by computing the centroid (referred to as centroidal defuzzification) of the activated output fuzzy sets. In this example, the CD yields a crisp rudder angle of 120. A flow chart for the
FLC for course-keeping is shown in Figure 13.
NVI NS PS PM m 90 135 180 FAM 4t) 0 10 20
CD
--
=
120
to rudder OMtFigure 13 Hypothetical case of a FLC for course-keeping when the desired heading is 180". A measured heading of 135" has degrees of membership, m(O), of 0.4 NS and 0.6 NM in the variable heading membership function 0(t). The FAM rules relate the heading fuzzy sets with the output fuzzy set for rudder angle 0(t), resulting in degrees of membership, m(0), of 0.4 PS and 0.6 PM. Centroidal defuzzification (CD) yields the commanded rudder angle 12'.
13 50
from compass