HAL Id: hal-02865868
https://hal.sorbonne-universite.fr/hal-02865868
Submitted on 12 Jun 2020HAL is a multi-disciplinary open access archive for the deposit and dissemination of sci-entific research documents, whether they are pub-lished or not. The documents may come from teaching and research institutions in France or abroad, or from public or private research centers.
L’archive ouverte pluridisciplinaire HAL, est destinée au dépôt et à la diffusion de documents scientifiques de niveau recherche, publiés ou non, émanant des établissements d’enseignement et de recherche français ou étrangers, des laboratoires publics ou privés.
Modulation of ellipses drawing by sonification
Éric Boyer, Frédéric Bevilacqua, Emmanuel Guigon, Sylvain Hanneton, Agnès
Roby-Brami
To cite this version:
Éric Boyer, Frédéric Bevilacqua, Emmanuel Guigon, Sylvain Hanneton, Agnès Roby-Brami. Modula-tion of ellipses drawing by sonificaModula-tion. Experimental Brain Research, Springer Verlag, 2020, 238 (4), pp.1011-1024. �10.1007/s00221-020-05770-6�. �hal-02865868�
1
Modulation of ellipses drawing by sonification
Eric O. Boyer1,2,3, Frederic Bevilacqua2, Emmanuel Guigon1, Sylvain Hanneton3, Agnes Roby-Brami1. 1 ISIR - CNRS UMR 7222, INSERM ERL 1050, Sorbonne University, Paris, France
2 IRCAM – CNRS UMR 9912, team STMS, Sorbonne University, Paris, France
3 Institut des Sciences du Sport-Santé EA3625, University Paris Descartes, Paris, France Corresponding author:
Agnès Roby-Brami
Institute of Intelligent systems and robotics 4 place Jussieu, 75005 Paris
[email protected] ORCID ID : 0000-0002-6196-7229 Cell 33 06 84 68 06 53 Tel 33 1 44 27 62 15 Fax 33 1 44 27 51 45 Acknowledgments
This work was performed within the laboratory of Excellence SMART supported by French state funds managed by the ANR within the “Investissements d’Avenir” program under reference ANR-11-IDEX-0004-02.
The authors thank Johanna Robertson for editorial assistance.
Abstract (245 words)
Most studies on the regulation of speed and trajectory during ellipse drawing have used visual feedback. We used on-line auditory feedback (sonification) to induce implicit movement changes independently from vision. The sound was produced by filtering a pink noise with a bandpass filter proportional to movement speed. The first experiment was performed in 2D. Healthy participants were asked to repetitively draw ellipses during 45 second-trials whilst maintaining a constant sonification pattern (involving pitch variations during the cycle). Perturbations were produced by modifying the slope of the mapping without informing the participants. All participants adapted spontaneously their speed: they went faster if the slope decreased and slower if it increased. Higher velocities were achieved by increasing both the frequency of the movements and the perimeter of the ellipses, but slower velocities were achieved only by decreasing the perimeter of the ellipses. The shape and the orientation of the ellipses were not significantly altered. The analysis of the speed-curvature power-law parameters showed consistent modulations of the speed gain factor, while the exponent remained stable. The second experiment was performed in 3D and showed similar results, except that the main orientation of the ellipse also varied with the changes in speed. In conclusion this study demonstrated implicit modulation of movement speed by sonification and robust stability of the ellipse geometry. Participants appeared to limit the decrease in movement frequency during slowing down in order to maintain a rhythmic and not discrete motor regimen.
Keywords: kinematics, speed-curvature, audio feedback, speed control.
2
General Introduction
The control of movement speed during both discrete and rhythmic movements has been the focus of many investigations in the domain of human movement science (Hogan and Sternad 2007). The speed of discrete movements depends on the size and distance of the target (Abend et al. 1982; Flash and Hogan 1985), the difficulty of the task (Fitts 1954), any instructions regarding speed (Darling et al. 1988; Messier et al. 2003) and individual preference (Berret et al. 2018). The speed of rhythmic movements is mathematically dependent on the frequency and amplitude of the movements, which can be independently modified by the task and the instructions (Sternad et al. 2002). It is now understood that discrete and rhythmic movements are on the same continuum and that the transition from one to the other is speed dependant (Hogan and Sternad 2007). A recent study showed that slow movements, whether discrete (Guigon et al. 2019) or rhythmic (Park et al. 2017; van der Wel et al. 2010) are less regular and involve different control mechanisms. Levy-Tzedek studied how movement amplitude and frequency were modulated together in the voluntary control of movement speed during a rhythmic task (Levy-Tzedek et al. 2011; Levy-Tzedek et al. 2010). She showed that variations in movement frequency were limited so that slower movements tended to be performed with discrete, rather than rhythmic movements (Levy-Tzedek et al. 2010).
The tasks used during most previous studies were performed with a visual feedback. The aim of the present study was to investigate how auditory feedback can influence the control of movement speed. The effect of auditory feedback on human motor control and sensorimotor learning has received much less attention than visual feedback (Sigrist et al. 2013). Interestingly, auditory system reacts faster than the visual system and its proper frequency is well adapted to provide augmented information during movement execution (Vinken et al. 2013). In particular, the use of real-time continuous auditory feedback directly related to movement parameters is called “movement sonification” (Bevilacqua et al. 2016; Dubus and Bresin 2013). In such systems, initially developed for artistic purpose, the sound is continuously modified by the movements of the human performer. In this frame-work, the coupling between the movement and sound is referred as the “sonification mapping” between the parameters of movement and those of sound (Vinken et al. 2013). While basic sonification mappings have generally been used in sensorimotor learning experiments (Dubus and Bresin 2013) more complex relationships have been explored in artistic practices or sound design, however with little concern of human sensorimotor physiology.
Importantly, movement sonification can affect movement performance either consciously or unconsciously (Boyer et al. 2017; Schaffert et al. 2019b). To achieve a conscious effect, the auditory feedback should be fully integrated in a “sound oriented” task: subjects should be instructed to consciously accomplish the movement according to specific sound characteristics (Bevilacqua et al 2016). This situation differs from motor-oriented tasks where the sound feedback is designed to guide or correct movement execution in the context of skill learning or rehabilitation (Schaffert et al. 2019a).
We hypothesised that by changing the mapping parameters between the movement and the sound, short-term audio-motor adaptation would occur, similar to the paradigm of visuo-motor adaptation (reviews in (Henriques and Cressman 2012; Krakauer and Mazzoni 2011; Shadmehr et al. 2010)). Indeed, Effenberg and Schmitz (Effenberg and Schmitz 2018) used a multisensory paradigm and observed that sonification with inconsistent pitch transposition could enhance or reduce the visual estimations of movement velocity.
The present study used a “sound oriented’ task in blindfolded participants to investigate the adaptation of the relationship between amplitude and frequency during rhythmic movements. We chose a task that involved drawing movements in either 2D or 3D in order to avoid the difficulties of spatial localization relating to audio targets (Boyer et al. 2013). Such movements are characterized by a well-known coupling between geometry and kinematics formalized by an invariant speed-curvature relationship (Viviani and Cenzato 1985; Viviani and Terzuolo 1982). The "2/3 power law", as named by Lacquaniti (Lacquaniti et al. 1983) describes the non-linear relationship between angular velocity and curvature of the end-point, with an exponent term close to 2/3 for handwriting and drawing movements. This relationship can also be expressed by an equation relating the tangential velocity to the radius of curvature, with an exponent close to 1/3 (Gribble and Ostry 1996; Schaal and Sternad 2001; Viviani and Flash 1995). This equation also has a multiplicative factor (termed ‘speed gain factor’ or K) that depends on the length of the trajectory, but not on its shape (Viviani and Flash 1995). In asymmetrical drawing (e.g. lemniscates or oblate limaçon), K is adjusted at different levels for the two portions of the figure to ensure isochrony (Viviani and Flash
3
1995). This coupling is robust as has been demonstrated by perceptual experiments with point-light displays moving along elliptical trajectories. These experiments show that the visually perceived eccentricity of the ellipse is modified if the curvature-speed relationship is altered (Viviani and Stucchi 1989). In addition, the drawing of elliptic shapes can be modelled by the dynamics of nonlinear coupled oscillators with various relative phase and amplitude generating shapes with different eccentricity and orientation (Athenes et al. 2004). It has been experimentally demonstrated that some combinations of eccentricity and orientation result in stable configuration patterns characterized by a better accuracy, higher velocity (Danna et al. 2011) and a higher resistance to speed modification (Sallagoity et al. 2004).
In order to further investigate these principles, we tested the effect of on-line sonification on the kinematics and the geometry of elliptical drawing movements. To that purpose, we chose an ecologically valid mapping based on the metaphor of friction sounds (e.g. chalk on a blackboard) inspired by the work of Kronland-Martinet’s team who demonstrated that replaying friction sounds (recorded or synthesized) can evoke the shape of the ellipse drawings (Thoret et al. 2014) and induce a sensorimotor perceptive bias on the reproduction of visual motion (Thoret et al. 2016). In the present study, the participants had to draw repetitively ellipses while maintaining a constant sonification pattern (i.e. the same variations of the sound pitch as a function of drawing speed), despite experimental perturbations of the sonification mapping. Technically, the mapping of movement to sound was produced by filtering a pink noise with a bandpass filter proportional to the movement speed. The perturbation was induced by a progressive modification of the slope of this mapping, without the knowledge of the participants. Thus, by comparison to initial period, the pitch of the sound produced as a function of the speed of the movement was respectively increased or decreased (by 10 and 20%).
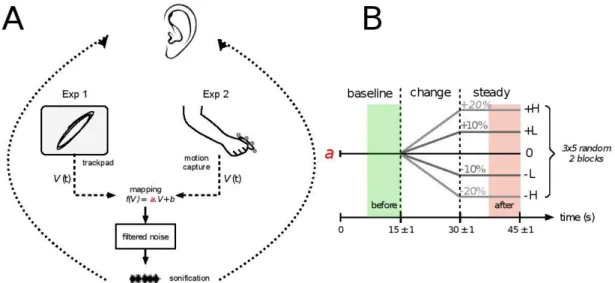
Our hypotheses and objectives were threefold. First, we expected that the modification of the speed-dependent sonification mapping would induce an adaptation of spontaneous movement speed. Second, we hypothesized that the eccentricity and orientation of the ellipse chosen among dynamically stable drawing patterns (Danna et al. 2011) would remain relatively constant (Sallagoity et al. 2004). Finally, we wanted to analyse the alteration of the spatiotemporal parameters of the trajectories (i.e. frequency and amplitude) during those implicit speed modulations. We therefore performed two experiments involving ellipse drawing with the same sonification mapping (Figure 1A). In the first experiment the movements were performed in 2D with the tip of the index finger on the touchpad of a computer. In the second experiment, the drawing movements were performed in 3D and involved movement of the whole upper-limb.
Figure 1 A: Overall schema of the experiments. Ellipse drawing was performed either in 2D on a
touchpad (Exp 1) or in 3D (Exp 2). In both cases, the sound was produced by filtering a pink noise with a band-pass filter of which the centre frequency was proportional to the instantaneous velocity of the movement of the end-point with the slope (a).
B: Adaptation protocol. The slope of the sonification mapping (a) was either decreased or increased by either 10% or 20% gain. Altered mapping conditions were randomly imposed and compared to a control condition (constant mapping). The effect of the adaptation was assessed by the percentage of change in each parameter between the steady state with the perturbation and baseline values.
4
Experiment 1
Materials and methods
Subjects
Twenty-eight right-handed (self-reported) volunteers participated in the experiment (15 females and 13 males; 26.6 ± 6.4 (SD) years old). All were healthy and reported having normal hearing and normal hand and finger movement. The study was carried out in accordance with the Declaration of Helsinki and the protocol was approved by the ethic committee of University Paris-Descartes. All subjects gave written informed consent before starting the experiment and were paid for their time.
Experimental setup and instructions
Participants were seated on a height adjustable chair at a desk with a laptop computer in front of them. They could adapt their position in order to feel comfortable. They were shown a picture of an ellipse with an eccentricity of 0.95. They were then blindfolded to prevent any visual input or distraction and were taught to draw repetitive ellipses of similar eccentricity and inclination with the tip of their index finger on the touchpad of the laptop (15” MacBookPro 2012, Apple Inc. size of the trackpad 12.7 x 12.5 cm). Once the participants were comfortable with the use of the touchpad to draw the ellipses, the experimenter demonstrated the drawing with the sonification for 10 seconds. Following that, participants were given 20 seconds to discover the sound-interface. They were instructed to try to produce the same sound pattern during each ellipse, at their preferred speed (providing each ellipse was produced in less than 3 seconds). Repetitive drawing had to be performed without stopping between ellipses until the sound stopped (signalling the end of the trial). No instructions were given regarding the size or the position of the ellipses. Auditory feedback was delivered through headphones AKG K271 MkII). The code for sonification is shared in an OSF (
Open science framework)
repository(
https://osf.io/c28rf/).Sonification mapping
The sonification of the elliptical trajectory was programmed in the Max/MSP1 environment1. Movement data from the touchpad was obtained at a rate of 100 Hz using the “fingerpringer” Max object2 which performs a real time-sampling of the position of the contact on the touchpad, with a precision of 0.1%. This method has a comparable spatio-temporal resolution as the one proposed by Matic et al with a tablet app programmed under Android (Matic and Gomez-Marin 2019). The magnitude of the absolute speed of the finger was then computed to feed the sonification mapping. The sound was produced by filtering a pink noise3 with a resonant band-pass filter of Q factor 23, the centre frequency of which was proportional to the instantaneous finger speed. The filter frequency was set to vary linearly with the finger speed V (equation 1). The values of the parameters in the baseline condition (slope a = 3.2 and minimum b = 131) were arbitrarily set after empirical tests. The sound was turned off when the finger did not move (speed below a threshold set to 3.5 mm/s) or if it left the trackpad. The audio rendering latency was less than 20 ms, mostly due to the trackpad latency. As a whole, the ecological metaphor of this sonification mapping is similar to a sound produced by scratching on a table or drawing on a blackboard (not considering the noise of touching the board).
Equation 1: 𝑓(𝑉) = 𝑉(𝑡) ⋅ 𝑎 + 𝑏
where 𝑓(𝑉) is the frequency of the band-pass filter, 𝑉 is the finger speed in mm/s and a = 3.2 and b = 131 in baseline condition.
The audio-motor perturbation was obtained by applying a gain that changed the slope (a) of the sonification function over time (Figure 1B). The slope could increase with a High or Low positive gain or decrease with a High and Low negative gain. The values of the baseline level, slope and gains were chosen ad-hoc after preliminary experiments to ensure an easily noticeable change in the audio-motor coupling in the High conditions, while still allowing for achievable movements in terms of amplitude and frequency. Similarly, the two Low conditions corresponded to a slightly noticeable change in the mapping. When expressed in logarithmic frequencies, the final slopes represented ± 20% gain in the two High
1 www.cycling74.com
2 http://www.maxobjects.com/?v=objects&id_objet=4531
5
conditions (referred to as "+H" and "-H") and ± 10% in the two Low conditions ("+L" and "-L"). These four conditions were compared to a control condition where the mapping remained constant (referred to as condition "C"). It was therefore possible to test a change in the sonification in two opposite directions with two different magnitudes.
Experimental procedure.
The five experimental conditions were randomly presented over 15 trials (3 repetitions of each). The whole experiment lasted for approximately 35 minutes and included 2 blocks of 15 trials with a five minutes break in between.
Each trial was composed of three phases: baseline ellipse drawing, the gradual and continuous mapping change, and a final steady phase (Figure 1B). The participants heard three beeps as a countdown to indicate the start of the trial. The trials always began with the same initial baseline mapping for a randomly chosen duration of 15 ± 1 s to avoid any anticipation from the participants. The mapping change then lasted for 15 seconds, starting from the baseline to one of the five final states corresponding to the experimental conditions. Once the final value was reached, the system stayed steady for another 15 seconds. Thus, each trial lasted for 45 ± 1s.
Participants were asked to complete a questionnaire after the experiment. They were asked to rate perceived difficulty and fatigue using a five-point Likert scale (where 1 = minimum and 5 = maximum). They were also asked if they had noticed any changes during the trials.
Data analysis
The finger position on the touchpad was recorded at 100 Hz and low-pass filtered at 10 Hz with a Gaussian filter before further analysis.
The dependant variables were the kinematic and spatial geometrical variables computed on the movement data. The trajectories were visually monitored and we checked that the participants obeyed the instruction to continue to draw ellipses during the whole duration of the trial.
The tangential velocity of the finger movement V(t) was calculated after filtering and its RMS computed. The instantaneous radius of curvature and angular velocity were calculated following equations 2 and 3.
Equation 2: 𝑐(𝑡) =|(𝑥˙𝑦¨−𝑦˙𝑥¨)|
(𝑥˙2−𝑦˙2)32
where c(t) is the instantaneous curvature and 𝑥˙ =𝑑𝑥
𝑑𝑡 and 𝑥¨ = 𝑑2𝑥
𝑑𝑡2 are the
vectorial velocity and acceleration of the position 𝑥(𝑡).
Equation 3 𝐴(𝑡) = 𝑉(𝑡) ⋅ 𝑐(𝑡) where A(t) is the angular velocity
The frequency of the motion was computed with a wavelet algorithm (Meeker et al. 2011) that tracks the pseudo-period estimated over the signal length. This algorithm uses Morlet wavelets and 64 bands per octave.
The length of the minor and major axes of the ellipse were computed by fitting each lap with a geometrical model of ellipse (Fitzgibbon et al. 1999; Halir and Flusser 1998). The perimeter P of the ellipse was calculated according to the approximation indicated in equation 4 and the eccentricity E according to equation 5. The angle of the principal axis of the ellipse was the mean angle of the position vector of the finger on the touchpad.
Equation 4: 𝑃 = 𝜋 ⋅ √2 ⋅ (𝑎2+ 𝑏2)
Equation 5: 𝐸 =√𝑎2𝑎−𝑏2
where a and b are the length of the minor and major rays respectively.
The parameters of the power law K and (equation 6 and 7), were obtained using a linear regression of the logarithmic values of A(t) and c(t) according to (Viviani and Flash 1995; Zago et al. 2018).
Equation 6: 𝐴(𝑡) = 𝐾 ⋅ 𝑐(𝑡)𝛽
Equation 7: 𝑙𝑜𝑔(𝐴(𝑡)) = 𝑙𝑜𝑔(𝐾) + 𝛽 ⋅ 𝑙𝑜𝑔(𝑐(𝑡))
6
The variables (RMS speed, frequency, length of minor and major ellipses) were averaged over the last 8 seconds of the baseline and final steady phases of the trials (shaded zones on Figure 1B). For the analysis of the power law, the regression analysis giving r2, K and beta values was performed for each trial using the trajectories recorded during these two 8s periods.
The percentage of change between the initial and final periods was calculated as (final value-initial value)/initial value *100.
Drift was the quantity of slow displacement of the participant's hand on the touchpad during the whole trial. It was measured by low-pass filtering the position data below 0.2 Hz then by summing the resulting curvilinear trajectory over the total duration (~45s) of each trial.
Statistics
Two-factor repeated-measure analyses of variance (ANOVA) were performed on the dependant variables (percentage of change of the kinematic and spatial variables and drift) with the independent factors repetition (6 levels) and condition (5 levels) and subjects as repeated measures. Since the two-factor ANOVA showed no effects or interactions with the repetition two-factor, results were averaged across repetitions and analysed using a one-factor ANOVA with Condition (5 levels) as an independent variable and Bonferroni post-hoc tests. A one-sample Student’s t-test with a 95% confidence interval was used to estimate differences with zero or hypothesized values. Paired Student’s tests were used for additional comparisons. The results are presented as means ± SEM.
Results
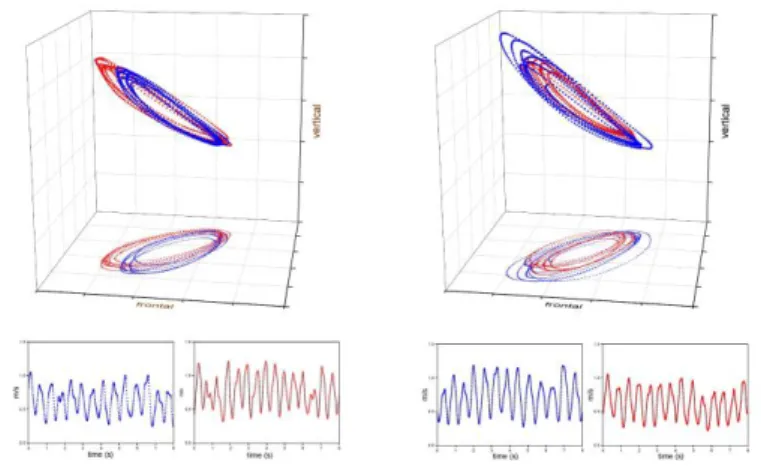
The kinematics of ellipse drawing before and after adaptation to changes in the sonification mapping are illustrated on Figure 2 in a representative participant, as well as the corresponding velocity – curvature relationships. The Figure compares the kinematics during the initial (blue symbols) and the final periods (red symbols).
Figure 2
Examples of ellipse drawing during the initial and final periods in a representative participant (Experiment 1). The upper part presents a trial in -H condition and the lower part a trial in +H condition. Left panel: Trajectory of the finger during the 8s initial (blue) and final (red) periods. Right: illustration of the log-log relationship between velocity and curvature during the same periods, the equations and r2 of the
regression lines are indicated.
Finger speed
The kinematic variable most related to experimental changes was finger speed, since sonification mapping was based on that variable. During the baseline period, the RMS speed was 0.127 ± 0.005 m/s (mean ± SEM in 28 subjects, 5 conditions). The RMS speed increased when the slope of the mapping decreased (-H and -L conditions) and conversely decreased when the slope of the mapping increased (+H and +L conditions), see Figure 3. The one factor ANOVA showed a strong effect of condition (F(4,108) = 134; p < 10-4) and the Bonferroni post-hoc tests showed significant differences between all conditions (p < 10-4). The percentage of change was significantly different from 0 in all conditions with altered mapping (Student test p < 10-4) but not in the control condition. The absolute amount of change was less than that could be expected due to an alteration of respectively ± 10% or ± 20% of the band-pass frequency (-H and +H conditions: Student’s t-test p < 10-4; +L condition: p < 0.005; -L condition: ns).
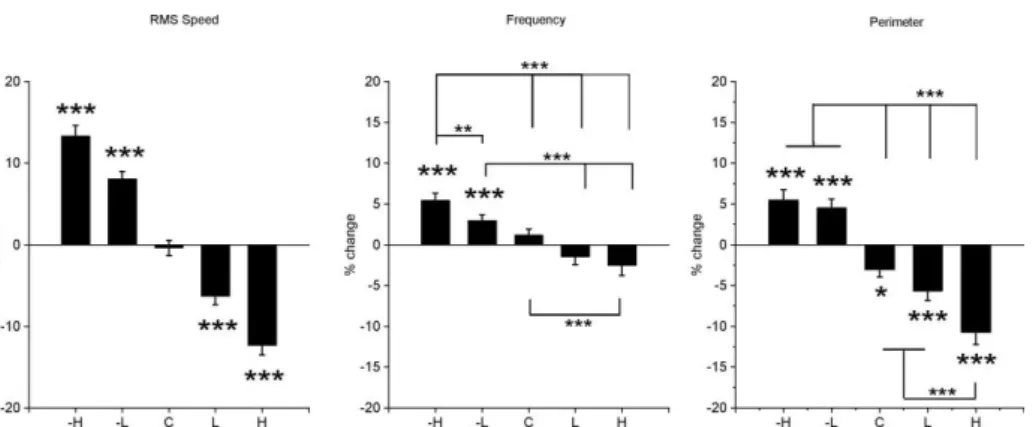
Experiment 1: Kinematic parameters: RMS speed and frequency of ellipse drawing and perimeter of the ellipses.
7
Figure 3: Abscissa: conditions of mapping as defined in Figure 2. Bonferroni post-hoc test showed
differences between all conditions for RMS speed and frequency. Significant differences for the perimeter are indicated by stars above the horizontal lines. The asterisks on top of the histograms indicate the difference from zero (one-sample Student’s t-test). *: p<0.05; **: p<0.01; *** p<0.0001.
Movement frequency
Typical movement frequency values ranged from 0.8 to 1.2 Hz with a mean of 1.11 ± 0.4. The frequency was significantly affected by the condition factor (F(4,108) = 316.4; p < 10-4). Bonferroni post-hoc tests showed significant differences between H- and all other conditions (p < 10-4 except p<0.01 for L-). There were significant differences between L- and L+ or H+ (p < 10-4). The low conditions L- and L+ did not differ from control. The high condition H+ differed from control (p < 10-3). A one-sample Student’s t-test showed a significant increase in frequency in the –H and -L conditions (p < 10-4 and p < 10-3, Figure 3). The change of frequency in the control, +L and +H conditions was not significant.
Ellipse size, orientation and eccentricity
In the control condition, the lengths of the major and minor axes were 51.8 mm ± 3.5 and 16.3 mm ± 1.4 mm respectively (ratio: 3.4 ± 0.1) the perimeter4 was 121 ± 8.1 mm and the eccentricity 0.945. The mean angle was 17.42° ± 4.2°). The perimeter of the ellipse changed significantly with the condition (ANOVA (F(4,108) = 52.34; p < 10-4, Figure 3). -H and -L were not significantly different but differed from all other conditions. C and +L conditions were not significantly different but differed from +H condition. Post-Hoc analysis with the Student’s t-test showed that it significantly increased in the –H and –L conditions (p < 10-3) and decreased in the control (p < 0.01), +L and + H conditions (p < 10-4). The ANOVA showed that the condition factor did not affect the % change of the principal angle of the ellipse (mean -1.34%) nor of its eccentricity (mean -5.76%) (not illustrated).
Figure 4. Experiment 1: Parameters of
the velocity-curvature Power-law relationship. Same legend as Figure 3. Abscissa: conditions of mapping as defined in Figure 2. Significant differences for the perimeter are indicated by stars above the horizontal lines. The asterisks on top of the histograms indicate the difference from zero (one-sample Student’s t-test). *: p<0.05; **: p<0.01; *** p<0.0001.
Speed curvature power law relationship
Examples of velocity-curvature relationships are illustrated on Figure 2 for a representative participant.
4 The velocity RMS, frequency and perimeter were calculated by separate algorithms. It was verified that Vrms was tightly correlated with f*P (r>0.99 in all the conditions) showing the robustness of the data processing.
8
The regression analysis of the speed as a function of the curvature gave highly significant values in all the participants. During the initial period, r2 varied between 0.623 to 0.996, it was lower than 0.70 in only 4 trials. During the final period, r2 varied between 0.510 to 0.996, it was lower than 0.70 in 10 trials. Consequently, 14 trials (1.7% of the trials) were excluded from the statistics on the coefficients.
The average values of the exponent of the power was 0.71 ± 0.004 in the control condition and it varied between 0.706 ± 0.004 and 0.717 ± 0.005 in the final period. ANOVA performed on the percentage of variation due to sonification showed a significant effect of condition (F (4,108) = 5.0; p < 10-3) and the postHoc test that +H condition differed from L and H conditions. A Student’s ttest showed that only -H conditions differed from zero (p < 0.01, Figure 4).
The average value of the slope of the regression (log K) was 3.66 ± 0.14 in the control condition. The effect of sonification was quantified by the percentage of variation of the speed gain factor (K). It was significantly affected by the condition (F(4,108) = 14.9; p < 10 -5). Post-hoc comparisons revealed significant differences between control condition and -H and -L conditions but not between control condition and +L +H conditions. A Student’s t-test showed that –H and –L conditions induced an increase of K (p<0.001) and conversely +H conditions induced a decrease of K (p =0.05), there was no change in the control condition. The –H and –L conditions lead to more important adaptation in absolute value than +H and +L conditions (24.6% versus 9.7%, and 17.8% versus 4.6%, for the High and Low gain conditions respectively).
Drift
The average accumulated drift was 44.7 mm. Drift was not affected by the experimental conditions (F(4,108) = 1:95; p = 0.107).
The kinematic data are shared in the OSF repository
(
https://osf.io/c28rf/).Questionnaire
Twenty of the 28 (71%) participants reported noticing ‘some changes’ during the experiment, 4 declared that they noted ‘no change’ whilst 4 were unsure. Mean task difficulty was rated at 2.8 ± 0.2 (out of 5) and mean hand fatigue was rated at 2.4 ± 0.17 (out of 5).
Discussion of Experiment 1
The present results demonstrated audio-motor adaptation to the change in sonification mapping in a “sound oriented” task. In accordance with our first hypothesis, the change in the speed-dependent sonification mapping induced an implicit modification of movement speed, as demonstrated by the change in the RMS speed. This was confirmed by changes in the speed gain factor K of the speed-curvature relationship. Modifications of the movements’ speed tended to compensate for the sonification mapping changes. When the slope of the sonification mapping was decreased (-H and -L conditions) the speed of the movement increased so that it tended to stabilize the frequency of the band-pass filter. Conversely, when the slope of the sonification mapping was increased (+H and +L conditions), the speed of the movement decreased. The absolute amount of speed change in each direction was scaled to the amount of perturbation (10 or 20%). However, the amount of speed change only partially compensated for the change in the mapping slope since variations were less than 10 and 20% respectively. Surprisingly, the speed gain factor K showed larger modulations (~30% increase and ~20% decrease) that fully or over-compensated for the percentage sonification mapping change.
In accordance with the second hypothesis, the global shape (eccentricity) and orientation of the ellipse remained constant. This is not surprising considering that the eccentricity and orientation chosen for the experiment were characterized by stable dynamics (Danna et al. 2011), resisting to speed increase (Sallagoity et al. 2004). The exponent of the speed-curvature relationship computed during the initial period of the trials (0.71) was close to the theoretically expected value for ellipse drawing (Huh and Sejnowski 2015). It was stable, with a significant decrease in only -H condition (~-2 %) consistent with previous observations in different dynamic contexts (Gribble and Ostry 1996; Wann et al. 1988; Zago et al. 2018). These results show that despite the lack of visual feedback, participants privileged the geometrical shape of the drawing and adapted their speed in order to satisfy the instruction to keep the sonification pattern constant. The stability of the figural aspect of movement is consistent with the concept of morphokinesis, as proposed by Paillard and Cole (Cole and Paillard 1995). It has been shown that
9
shapes can be drawn correctly from mental images in the absence of sensory feedback, that is to say without visual control, in deafferented patients (Mechsner et al. 2007; Spencer et al. 2005). Here, the ability to perceive the elliptical shape was induced by the generation of friction sounds (Thoret et al. 2014).
The strong link between the modulation of the endpoint speed and the perceived shape was also demonstrated by experimental alterations of speed feedback (presented either by sounds (Thoret et al. 2016) or visual point light displays (Viviani and Stucchi 1989; Viviani and Stucchi 1992) which biased visual perception of elliptical shapes. Conversely, the present study confirmed that the instruction to maintain a constant movement-sound relationship induces the stability of the drawing movement shape. The shape of the movement trajectories resisted changes in sonification mappings despite alterations in movement speed.
The adaptation of the movement speed also induced modifications of both amplitude (perimeter of the ellipse) and frequency of the drawing movements. The mechanisms of speed modulation were different in the decreased (-H -L) versus increased (+H +L) gains of sonification mapping: increased speed in conditions –H -L was due to both an increase in the frequency and perimeter of the ellipse while the decrease in conditions +H +L was related to a shrinking of the ellipse size. The perimeter of the ellipses was also decreased in the control condition (Figure 3), suggesting a general tendency for participants to decrease the amplitude of their movements when submitted to random changes in audio-motor mapping. However, the touchpad of a laptop is suboptimal for the analysis of human movement and the variations in size of the drawing could have been limited by the size of the pad. More detailed discussion regarding mechanisms of speed regulation is provided in the general discussion section.
Experiment 2
Introduction
The second experiment was performed to investigate the possibility for the generalization of the findings from experiment 1 to a wider range of movements. The movements in the first experiment were strongly constrained by the task since they were in 2D and along a rigid surface within a small area. The aim with experiment 2, therefore, was to use a 3D task which was less constrained and would allow larger movements since the sensorimotor planning of movements have been shown to differ according to the physical constraints of the task. 2D movements performed along a plane are likely to be planned in Cartesian coordinates while 3D movements are preferentially planned at joint level (Desmurget et al. 1998). The kinematics and shape of elliptical drawing movements are influenced by different biomechanical constraints in 2D and 3D. On one hand, it has been proposed that the biomechanics of the moving limb contribute to the emergence of the power law for 2D ellipse drawings (Gribble and Ostry 1996). On the other hand, it has been suggested that the power law in 3D conditions, could result from periodic rotations of the upper-limb joints (Schaal and Sternad 2001).
Therefore, the second experiment used the same sonification mapping and the same changes in the slope of the mapping, but very different conditions for movement execution. We hypothesised that participants would adapt their 3D movement parameters in the same way as for the first experiment in 2D, even if the task was less spatially constrained.
Materials and methods
Subjects
A second group of twenty-eight volunteers participated in the experiment (17 females and 11 males; 24.6 ± 0.5 years old; one left-handed). All were healthy and reported to have normal hearing and normal motor abilities. All subjects gave written informed consent before starting the experiment and were paid for their time.
Experimental setup and instructions
The experiment took place in a motion capture-equipped studio at Ircam. In order to perform arm movements freely the participants stood but, if necessary, they could hold a handrail with their non-dominant arm. Audio-feedback was delivered through headphones (AKG K271 MkII) and all participants were blindfolded during the experiment to prevent any visual input. They performed the task with their
10
dominant hand; they held a 3D-printed handle-shaped object on which a rigid cluster of 5 optical markers was fixed. The motion of the handle was captured by a six-camera Optitrack infrared motion capture system (Natural Point USA). The X axis of the reference coordinate system corresponded to the frontal axis, the Y axis to the vertical, and the Z axis to the sagittal axis.
Participants were told that movement of the handle would produce a specific sound. They were asked to move their hand as if they were pretending to repeatedly draw ellipses on the ground in front of them. The movement was demonstrated by the experimenter: circumduction of the whole arm at a relatively low level of elevation (to avoid excessive fatigue). The participants were free to choose the most comfortable pace and movement amplitude. The instruction was to repeatedly make elliptical shapes for around 45 seconds and to produce the same sound pattern for each ellipse.
Online data processing and sonification.
Data were captured at 100 Hz and were transmitted through the VRPN protocol to a second machine with customised program in the Max/MSP environment. Data were low-pass filtered with a 9-point linear regression. The magnitude of the tangential speed (3D) of the hand was computed to feed the same sonification mapping as in experiment 1 (Figure 1A). The overall latency of the setup, mostly due to the Optitrack system and the low-pass filtering, was evaluated at around 100 ms. This latency did not induce a noticeable discomfort as the sonification was continuous, with the movements repeated at a frequency of around 1 cycle per second. The initial slope of the linear function between the hand speed and filter frequency was empirically adjusted so that the sonification of a typical 3D movement covered the same frequency range as a typical 2D movement on the touchpad in experiment 1. The initial parameters of equation 1 were a = 0.428 and b = 131. The sound was turned off if the participants moved at less than 18 mm/s.
Experimental procedure.
As for experiment 1, five different experimental conditions were used and block arrangement was identical. The changes in sonification mapping and their time courses were also the same as in experiment 1(Figure 1B). The second experiment lasted for approximately 35 minutes, after a preparation time of around 5-10 minutes. At the end, the participants completed the same questionnaire as in experiment 1.
Figure 5. Examples of ellipse
drawing during the initial and final periods in a representative participant (Experiment 2). Left: -H condition, Right: +H condition. Upper part of each panel: 3D trajectory and horizontal projection of the endpoint (5cm between grid lines); lower part: tangential velocity. Blue symbols indicate the initial period and red ones the final period.
Data analysis
The hand position signals were recorded at 100 Hz, and low-pass filtered at 10 Hz with a Gaussian filter before further analysis and the tangential speed was calculated. The effects of the different experimental conditions were measured on the same kinematic variables as in experiment 1: RMS speed and movement frequency. The 3D trajectories were projected on the horizontal (X,Z) plane, as indicated on the figure 5, and the orientation of the principal axis of the ellipses was calculated as the mean angle between the projected position vectors and the frontal X axis.
As for experiment 1, these variables were averaged over the last 8 seconds of each steady phase of the trials (baseline and final phases) and compared before and after the mapping change. The low frequency drift during the whole trial was measured along the vertical axis.
11
It was not possible to fit the 3D trajectories to ellipse-shapes, therefore the sizes of the major and minor axes and eccentricity were not calculated nor were the parameters of the curvature-speed relationship. The perimeter was calculated according to equation 8:
Equation 8 𝑃 = 𝑉/𝑓
Where V is the mean speed and f the mean frequency of the trial.
Two-factor repeated-measure analyses of variance (ANOVA) were performed on the dependant variables with the independent factors repetition (6 levels) and condition (5 levels) and subjects as repeated measures. This analysis showed that the effect of repetition was significant for the frequency (F(5,135= 4.1, p=0.001). However, mixed model ANOVA with condition as fixed factor and repetition as random factor (R software, type III ANOVA table with Satterthwaite’s method) did not confirm the effect of repetition. So, the results were averaged across repetitions and analysed using a one-factor ANOVA with Condition (5 levels) as an independent variable and Bonferroni post-hoc tests, as in experiment 1. Student t-tests with 95% confidence intervals were used to analyse differences with zero.
Results
The kinematics of 3D ellipse drawing before and after adaptation to changes in the sonification mapping are illustrated on Figure 5 in a representative participant.
Hand speed
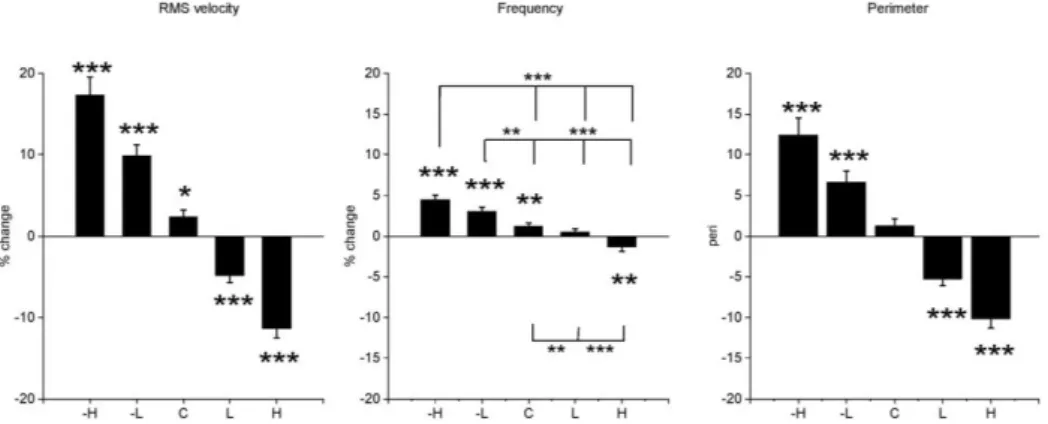
As in experiment 1, the tangential speed of the hand was closely related to the changes in the slope of the mapping. During the initial period, the RMS speed was 0.426 ± 0.02 m/s (mean ± SEM of the 28 subjects and 5 conditions). The one-factor repeated-measure ANOVA showed a strong effect of condition on the change in RMS speed between before and after the mapping change (F(4,108) = 94.8; p < 10-4 Figure 6). Bonferroni post-hoc tests showed significant differences between all conditions (p < 10-4). Student’s t-tests showed significant differences from zero in all conditions with altered mapping (p < 10 -4) and an increase in the control condition (p<0.05). Indeed, the –H and –L conditions lead to larger adaptations in absolute values than the +H and +L conditions (16.5 % versus 11.5%, Student’s test p< 0.05 and 9.7% versus 4.9%, p<0.02, for High and Low gain conditions respectively). The change was not different from the theoretical 20% and 10% in the -H and -L conditions but was smaller in the +H +L situations (Student’s t-tests, p < 10-4).
Figure 6. Experiment 2: Kinematic parameters of ellipse drawing in 3D.
Bonferroni post-hoc tests showed that all conditions differed significantly between all conditions for RMS speed and perimeter. Significant differences for the frequency are indicated by stars above the horizontal lines. The asterisks on top of the histograms indicate the difference from zero (one-sample Student’s t-test). *: p<0.05; **: p<0.01; *** p<0.0001.
Movement frequency
During the initial period, the typical frequencies ranged from 0.4 to 1 Hz with a mean of 0.67 ± 0.03 Hz (mean ± SEM in 28 subjects, 5 conditions). The frequency of the motion was significantly affected by the condition factor as shown by the % change in figure 6 (F(4,108) = 31:5; p < 10-5). Bonferroni post-hoc tests showed that the -H and –L conditions did not differ significantly but showed significant differences with the other conditions. The control and +L conditions did not differ. The +H condition
12
differed from control (p < 10-4) and +L conditions (p<0.01). The Student’s t-test showed a significant increase in frequency for the –H –L (p < 10-4) and control (p<0.01) conditions, no change in the +L condition and a significant decrease in frequency in the +H conditions (p<0.01).
Ellipse size and orientation
The mean perimeter of the ellipse during the initial period was 0.67 ± 0.02m (mean ± SEM of the 28 subjects and 5 conditions). The perimeter of the ellipse changed significantly with the condition (F(4,108) = 56.6; p < 10-4, Figure 6). Bonferroni post-hoc tests showed that all conditions differed significantly (p<10-4, except between -H and -L and between +H and +L, p <0. 01). Student’s t-tests showed that the % of change was significant in all the conditions with altered mapping (p < 10-4). The projected angle of the hand position vector was 37° ± 1.8 in the initial period. It was significantly modified by the condition factor (F(4,108) = 5.7; p <0.01). As can be seen in Figure 7, the angle was decreased in the negative gain conditions (-H –L) and increased in the positive gain conditions (+H +L). Bonferroni post-hoc tests showed no significant differences between conditions. Student’s t test showed that the difference from zero was significant only in the -H condition.
Figure 7.
Experiment 2: Angle of the principal axis of the horizontal projection of the trajectories by reference to the frontal axis. Bonferroni post-hoc test between conditions are indicated by stars above the horizontal lines. The asterisks on top of the histograms indicate the difference from zero (one-sample Student’s t-test). *: p<0.05; **: p<0.01; *** p<0.0001.
Drift
The averaged accumulated vertical drift measured was 0.19 m. The condition factor had a minor effect on the drift measurements (F(4,108) = 4:6; p < 0.01). Post-hoc comparisons for the condition factor only revealed significant differences between -H (0.198 m) and +L (0.185 mm, p < 0.01) and between –H and +H (184 mm, p < 0.01). Overall, the amount of vertical drift was less than 2 cm.
The kinematic data are shared in the OSF repository
(
https://osf.io/c28rf/).Questionnaire
Seventeen of the 28 (60%) participants reported having noticed changes in sonification during the experiment, 8 declared they did not, and 3 were unsure. The difficulty of the task was rated as 3.0 ± 0.23 (out of 5). Arm fatigue was rated 3.3 ± 1.2 (out of 5), which was significantly higher than rating in experiment 1 (Student’s t-test, p<0.001).
Discussion of experiment 2.
Experiment 2 confirmed the main result of Experiment 1: the change in the slope of the sonification mapping induced changes in the movement speed. It was not possible to fit 3D trajectories onto ellipse-shapes, which impeded conclusions regarding drawing shape; such fitting would have required a segmentation step (Soechting and Terzuolo 1986; Soechting and Terzuolo 1987) or complex geometrical mode modelling (Faraway et al. 2007) because 3D trajectories are piecewise planar (Soechting and Terzuolo 1987).
The change in the angle of the ellipse was probably a consequence of the effect of speed on inertial constraints (Pfann et al. 2002). Pfann et al showed that participants who were instructed to draw circles using shoulder-elbow movements made ellipses with increasing eccentricity in the direction of least inertia when the speed increased. This effect was not observed in experiment 1, probably since the 2D task involved smaller inertial constraints than the 3D task. In a 2D circle drawing task, Dounskaia et al. (Dounskaia et al. 2000) found that at higher velocities, (i.e. when instructed to draw “as fast as possible”) circles became flattened ellipses. This was not the case at the “self-paced” speed of Experiment 1.
13
General discussion
Both experiments confirm audio-motor adaptation of end-point speed, measured in RMS values, to changes in speed dependent sonification. This was not surprising considering that the speed of the endpoint was driving the sonification and that in this “sound oriented” task, participants were instructed to keep auditory feedback constant. The audio-motor adaptation of both the direction and magnitude of the movement tended to compensate for the changes in the sonification mapping.
It is likely that the motor effects we observed were mediated by a mismatch between the expected and the real speed-dependant auditory perception of the drawing action. The impact of sonification with pitch coding on multisensory perception of movement speed is now well demonstrated. Sonification can enhance the visual perception of movement speed of an avatar (Effenberg and Schmitz 2018). In addition, the alteration of the mapping could modify the visually perceived speed of an avatar, consistently with our behavioural results. Other studies suggest that similar sonification mappings could contribute to drawing tasks in deafferented patients (Danna and Velay 2017). Taken together these studies suggest that sonification may not only enhance perceptual performance in multisensory paradigms but also partially substitute to other senses for motor execution and sensorimotor learning (Sigrist et al. 2013).
With regards to the spatiotemporal parameters of speed control, both experiments demonstrated that the changes in amplitude were almost one order greater than the changes in frequency. The relative constancy of the frequency corresponds to the concept of isochrony (Viviani and Flash 1995) and is consistent with the results of Levy-Tzedek who showed that movement frequency, but not amplitude or speed, was maintained when the visual feedback for the task was removed (Levy-Tzedek et al. 2011).
The regulation of movement speed was achieved differently for each task. In experiment 1, the speed change was only partially compensated. The speed increase was linked to an increase in both frequency and perimeter while the speed decrease was mainly due to a shrinking of the ellipse perimeter, which was also observed in the control condition. In experiment 2, there was a general tendency to increase the speed and frequency of the movement, which was also observed in the control condition. The absolute changes in the ellipse perimeter were similar for decreased (-H –L) or increased (+L+H) gains of the mapping. A common feature of both experiments was that the participants avoided reducing the frequency of their movements in the +L and +H conditions. Adaptation was carried out by either reducing movement amplitude (experiment 1) or by a general increase in speed (experiment 2).
Taken together, these experiments suggested that, firstly, performing movements at a low speed induces particular constraints on motor control (Guigon et al. 2019) and that, secondly, there is a lower limit for the regulation of the frequency of rhythmic movements. Consistent with these findings, Levy-Tzedek also found “that specific combinations of required movement frequency and amplitude give rise to two distinct types of movements: one of a more rhythmic nature, and the other of a more discrete nature” (Levy-Tzedek et al. 2010). It would seem that where the participants had difficulty performing at slower frequencies, especially in +H conditions but also in the +L, they were at risk of switching to a discrete movement regimen and that, as a consequence, they adapted the kinematics (amplitude and/or frequency) of their movements in order to maintain the rhythmic movement regimen.
To conclude, the shape of the ellipse drawing was remarkably constant in both the 2D and the 3D experiments, adding to a large body of knowledge on speed curvature invariance. Speed-dependant sonification is an interesting experimental tool to investigate the control of human movement, and can provide valuable information regarding both motor control at low velocities and the switch between rhythmic and discrete regimens. This study has demonstrated that movement sonification induced implicit motor adaptations of movement speed in both planar and 3D movements. This adaptation was manifested by a modulation of speed, the direction and magnitude of which was controlled through the adjustment of mapping parameters.
References
Abend W, Bizzi E, Morasso P (1982) Human arm trajectory formation Brain 105:331-348
Athenes S, Sallagoity I, Zanone PG, Albaret JM (2004) Evaluating the coordination dynamics of handwriting Hum Mov Sci 23:621-641 doi:10.1016/j.humov.2004.10.004
Berret B, Castanier C, Bastide S, Deroche T (2018) Vigour of self-paced reaching movement: cost of time and individual traits Sci Rep 8:10655
14
Bevilacqua F, Boyer EO, Francoise J, Houix O, Susini P, Roby-Brami A, Hanneton S (2016) Sensori-Motor Learning with Movement Sonification: Perspectives from Recent Interdisciplinary Studies Front Neurosci 10:385
Boyer EO et al. (2013) From ear to hand: the role of the auditory-motor loop in pointing to an auditory source Front Comput Neurosci 7:26
Boyer EO, Bevilacqua F, Susini P, Hanneton S (2017) Investigating three types of continuous auditory feedback in visuo-manual tracking Experimental Brain Research 235:691-701 doi:10.1007/s00221-016-4827-x
Cole J, Paillard J (1995) Living without Touch and Peripheral Information about Body Position and Movement : Studies with Deafferented Subjects. In: Bermúdez J (ed) The Body and the Self. MIT Press, Cambridge MA,
Danna J, Athenes S, Zanone PG (2011) Coordination dynamics of elliptic shape drawing: effects of orientation and eccentricity Hum Mov Sci 30:698-710 doi:10.1016/j.humov.2010.08.019
Danna J, Velay JL (2017) On the Auditory-Proprioception Substitution Hypothesis: Movement Sonification in Two Deafferented Subjects Learning to Write New Characters Front Neurosci 11:137 doi:10.3389/fnins.2017.00137
Darling WG, Cole KJ, Abbs JH (1988) Kinematic Variability of Grasp Movements as a Function of Practice and Movement Speed Experimental Brain Research 73:225-235
Desmurget M, Pelisson D, Rossetti Y, Prablanc C (1998) From eye to hand: planning goal-directed movements Neurosci Biobehav Rev 22:761-788
Dounskaia N, Van Gemmert AW, Stelmach GE (2000) Interjoint coordination during handwriting-like movements Exp Brain Res 135:127-140
Dubus G, Bresin R (2013) A systematic review of mapping strategies for the sonification of physical quantities PLoS One 8:e82491 doi:
Effenberg AO, Schmitz G (2018) Acceleration and deceleration at constant speed: systematic modulation of motion perception by kinematic sonification Ann N Y Acad Sci doi:10.1111/nyas.13693
Faraway JJ, Reed MP, Wang J (2007) Modelling three-dimensional trajectories by using Bezier curves with application to hand motion. Journal of the Royal Statistical Society Series C Applied Statistics 56:571 - 585 doi:DOI: 10.1111/j.1467-9876.2007.00592.x
Fitts PM (1954) The information capacity of the human motor system in controlling the amplitude of movement Journal of Experimental Psychology 47:381-391
Fitzgibbon A, Pilu M, Fisher R (1999) Direct least square fitting of ellipses. IEEE Transactions on Pattern Analysis and Machine Intelligence 21:476-480
Flash T, Hogan N (1985) The coordination of arm movements: an experimentally confirmed mathematical model J Neurosci 5:1688-1703
Gribble P, Ostry D (1996) Origins of the power law relation between movement velocity and curvature : modeling the effects of muscle mechanics and limb dynamics. Journal of Neurophysiology 76:2853-2860
Guigon E, Chafik O, Jarrasse N, Roby-Brami A (2019) Experimental and theoretical study of velocity fluctuations during slow movements in humans Journal of Neurophysiology 121:715-727 doi:10.1152/jn.00576.2018
Halir R, Flusser J Numerically stable direct least squares fitting of ellipses. In: Skala V (ed) WSCG'98 / 6th International Conference in Central Europe on Computer Graphics and Visualization., University of West Bohemia, 1998. pp 125-132
Henriques DY, Cressman EK (2012) Visuomotor adaptation and proprioceptive recalibration J Mot Behav 44:435-444
Hogan N, Sternad D (2007) On rhythmic and discrete movements: reflections, definitions and implications for motor control Exp Brain Res 181:13-30
Huh D, Sejnowski TJ (2015) Spectrum of power laws for curved hand movements Proc Natl Acad Sci U S A 112:E3950-3958 doi:10.1073/pnas.1510208112
Krakauer JW, Mazzoni P (2011) Human sensorimotor learning: adaptation, skill, and beyond Curr Opin Neurobiol 21:636-644
Lacquaniti F, Terzuolo C, Viviani P (1983) The law relating the kinematic and figural aspects of drawing movements Acta Psychol (Amst) 54:115-130
15
Levy-Tzedek S, Ben Tov M, Karniel A (2011) Rhythmic movements are larger and faster but with the same frequency on removal of visual feedback J Neurophysiol 106:2120-2126
Levy-Tzedek S, Krebs HI, Song D, Hogan N, Poizner H (2010) Non-monotonicity on a spatio-temporally defined cyclic task: evidence of two movement types? Exp Brain Res 202:733-746
Matic A, Gomez-Marin A (2019) A customizable tablet app for hand movement research outside the lab J Neurosci Methods 328:108398 doi:10.1016/j.jneumeth.2019.108398
Mechsner F, Stenneken P, Cole J, Aschersleben G, Prinz W (2007) Bimanual circling in deafferented patients: evidence for a role of visual forward models J Neuropsychol 1:259-282
Meeker K et al. (2011) Wavelet measurement suggests cause of period instability in mammalian circadian neurons J Biol Rhythms 26:353-362
Messier J, Adamovich S, Berkinblit M, Tunik E, Poizner H (2003) Influence of movement speed on accuracy and coordination of reaching movements to memorized targets in three-dimensional space in a deafferented subject Exp Brain Res 150:399-416
Park SW, Marino H, Charles SK, Sternad D, Hogan N (2017) Moving slowly is hard for humans: limitations of dynamic primitives J Neurophysiol 118:69-83
Pfann KD, Corcos DM, Moore CG, Hasan Z (2002) Circle-drawing movements at different speeds: role of inertial anisotropy J Neurophysiol 88:2399-2407
Sallagoity I, Athenes S, Zanone PG, Albaret JM (2004) Stability of coordination patterns in handwriting: effects of speed and hand Motor Control 8:405-421 doi:10.1123/mcj.8.4.405
Schaal S, Sternad D (2001) Origins and violations of the 2/3 power law in rhythmic three-dimensional arm movements Exp Brain Res 136:60-72.
Schaffert N, Janzen TB, Mattes K, Thaut MH (2019a) A Review on the Relationship Between Sound and Movement in Sports and Rehabilitation Front Psychol 10:244 doi:10.3389/fpsyg.2019.00244
Schaffert N, Janzen TB, Mattes K, Thaut MH (2019b) A Review on the Relationship Between Sound and Movement in Sports and Rehabilitation Frontiers in Psychology 10 doi:ARTN 244 10.3389/fpsyg.2019.00244
Shadmehr R, Smith MA, Krakauer JW (2010) Error correction, sensory prediction, and adaptation in motor control Annu Rev Neurosci 33:89-108
Sigrist R, Rauter G, Riener R, Wolf P (2013) Augmented visual, auditory, haptic, and multimodal feedback in motor learning: A review Psychonomic Bulletin & Review 20 21-53
Soechting JF, Terzuolo CA (1986) An Algorithm for the Generation of Curvilinear Wrist Motion in an Arbitrary Plane in 3-Dimensional Space Neuroscience 19:1393-1405 doi:Doi 10.1016/0306-4522(86)90151-X
Soechting JF, Terzuolo CA (1987) Organization of Arm Movements in 3-Dimensional Space - Wrist Motion Is Piecewise Planar Neuroscience 23:53-61 doi:Doi 10.1016/0306-4522(87)90270-3
Spencer RM, Ivry RB, Cattaert D, Semjen A (2005) Bimanual coordination during rhythmic movements in the absence of somatosensory feedback J Neurophysiol 94:2901-2910
Sternad D, de Rugy A, Pataky T, Dean WJ (2002) Interaction of discrete and rhythmic movements over a wide range of periods Exp Brain Res 147:162-174
Thoret E, Aramaki M, Bringoux L, Ystad S, Kronland-Martinet R (2016) Seeing Circles and Drawing Ellipses: When Sound Biases Reproduction of Visual Motion PLoS One 11:e0154475
Thoret E, Aramaki M, Kronland-Martinet R, Velay JL, Ystad S (2014) From sound to shape: auditory perception of drawing movements J Exp Psychol Hum Percept Perform 40:983-994
van der Wel RPRD, Sternad D, Rosenbaum DA (2010) Moving the Arm at Different Rates: Slow Movements are Avoided J Motor Behav 42:29-36 doi:Doi 10.1080/00222890903267116
Vinken PM, Kroger D, Fehse U, Schmitz G, Brock H, Effenberg AO (2013) Auditory coding of human movement kinematics Multisens Res 26:533-552
Viviani P, Cenzato M (1985) Segmentation and coupling in complex movements Journal of Experimental Psychology Human Perception and Performance 11:828-845
Viviani P, Flash T (1995) Minimum-jerk, two-thirds power law, and isochrony: converging approaches to movement planning J Exp Psychol Hum Percept Perform 21:32-53.
Viviani P, Stucchi N (1989) The effect of movement velocity on form perception: geometric illusions in dynamic displays Percept Psychophys 46:266-274.
Viviani P, Stucchi N (1992) Biological movements look uniform: evidence of motor-perceptual interactions J Exp Psychol Hum Percept Perform 18:603-623.
16
Viviani P, Terzuolo C (1982) Trajectory determines movement dynamics Neuroscience 7:431-437 Wann J, Nimmo-Smith I, Wing AM (1988) Relation between velocity and curvature in movement: equivalence and divergence between a power law and a minimum-jerk model J Exp Psychol Hum Percept Perform 14:622-637.
Zago M, Matic A, Flash T, Gomez-Marin A, Lacquaniti F (2018) The speed-curvature power law of movements: a reappraisal Exp Brain Res 236:69-82