HAL Id: hal-02270253
https://hal-montpellier-supagro.archives-ouvertes.fr/hal-02270253
Submitted on 6 Sep 2019
HAL is a multi-disciplinary open access
archive for the deposit and dissemination of sci-entific research documents, whether they are pub-lished or not. The documents may come from teaching and research institutions in France or abroad, or from public or private research centers.
L’archive ouverte pluridisciplinaire HAL, est destinée au dépôt et à la diffusion de documents scientifiques de niveau recherche, publiés ou non, émanant des établissements d’enseignement et de recherche français ou étrangers, des laboratoires publics ou privés.
Microbiota Diversity Within and Between the Tissues of
Two Wild Interbreeding Species
Emmanuel Guivier, Jean-François Martin, Nicolas Pech, Arnaud Ungaro,
Rémi Chappaz, André Gilles
To cite this version:
Emmanuel Guivier, Jean-François Martin, Nicolas Pech, Arnaud Ungaro, Rémi Chappaz, et al.. Mi-crobiota Diversity Within and Between the Tissues of Two Wild Interbreeding Species. Microbial Ecology, Springer Verlag, 2018, 75 (3), pp.799-810. �10.1007/s00248-017-1077-9�. �hal-02270253�
Microbiota diversity within and between the tissues of two wild interbreeding species
Emmanuel Guivier1, Jean-François Martin2, Nicolas Pech1, Arnaud Ungaro1, Rémi Chappaz1 &
André Gilles1
1 IMBE, Aix Marseille Université, CNRS, IRD, Avignon Université, Centre Saint-Charles, 3 place Victor Hugo, 13331 Marseille Cedex 3,
2 Montpellier SupAgro, UMR CBGP, F-34988 Montferrier-sur-Lez, France
*Corresponding author: Emmanuel Guivier
Current address: Emmanuel Guivier, IMBE, Université Aix Marseille, Campus St Charles, 13001 Marseille, France
E-mail: [email protected]
Running head: microbiota in wild interbreeding species
Abstract
Understanding the role of microbiota as reproductive barriers or sources of adaptive novelty in the fundamental biological phenomenon of speciation is an exciting new challenge necessitating exploration of microbiota variation in wild interbreeding species. We focused on two interbreeding cyprinid species, Chondrostoma nasus and Parachondrostoma toxostoma, which have geographic distributions characterized by a mosaic of hybrid zones. We described microbiota diversity and composition in the three main teleost mucosal tissues, the skin, gills and gut, in the parental parapatric populations. We found that tissue type was the principal determinant of bacterial community composition. In particular, there was strong microbiota differentiation between external and internal tissues, with secondary discrimination between the two species. These findings suggest that specific environmental and genetic filters associated with each species have shaped the bacterial communities, potentially reflecting deterministic assemblages of bacteria. We defined the core microbiota common to both Chondrostoma species for each tissue, highlighting the occurrence of microbe-host genome interactions at this critical level for studies of the functional consequences of hybridization. Further investigations will explore to what extend these specific tissue-associated microbiota signatures could be profoundly altered in hybrids, with functional consequences for post-mating reproductive isolation in relation to environmental constraints.
Introduction
Microbes are one of the major cell components of vertebrates, in terms of both their numbers (thousands of billions of cells), and their genomic diversity (thousands of highly diverse species) [1]. The microbiota is not simply a neutral companion (biological community). Through its myriad of dynamic interactions with the host, the microbiota is an active partner in many physiological functions, contributing to the overall performance of the organism in immune defense and nutrient assimilation [2–4]. The microbiota includes representatives from a large panel of phyla, including bacteria, archaea, fungi, and protozoans, but the bacterial community makes up the bulk of this ecosystem [1, 5]. Bacteria are present on all interfaces between host tissues and the environment. Studies, essentially in humans, have shown that different body parts such as the skin, oral cavity, lungs and gastrointestinal tract (GIT), are characterized by their own microbiota [6]. Indeed, the different host tissues have specific physical and biological properties, such that each constitutes a particular microhabitat favorable for specific bacterial assemblages [7].
Environmental factors shape microbiota composition, but similarities between genetically related individuals (e.g. between family members or within populations) have suggested that there may be a heritable component of microbiota composition. Numerous studies analyzing twins and genome-wide associations (GWA) have provided evidence for a genetic contribution to microbiota composition [8–11]. These host genome-microbiota associations and their global contribution to host fitness, suggested that microbes might be involved in processes of speciation, based on Bateson-Dobzhansky-Muller (BDM) incompatibilities [12]. According to this hypothesis, there should be a detectable host-specific microbiota signature [13, 14]. This signature is conceptualized in the term “core microbiota”,
which defines a consistent set of microbial taxa common to the individuals of a host species [15].
Microbiota composition is a complex and heritable polygenic trait [16]. Introgressive hybridization induces the disruption of a co-adapted genetic complex, and would therefore be expected to alter interactions between the host genome and microbiota, with potentially deleterious effects, leading to the maintenance of reproductive isolation [9, 17]. However, genomic admixture could also lead to a transgressive phenotype with adaptive novelties in hybrids [18]. Indeed, microbiota rearrangement in hybrids may lead to the emergence of favorable physiological functions, facilitating the exploitation of new ecological niches. Thus, changes in the microbiota of hybrids may lead to the establishment of a post-mating reproductive barrier, but they may also act as a potent factor in the ecological speciation or range expansion of one of the two parental species [9, 12, 19]. The exploration of the microbiota in wild interbreeding species is therefore important for an understanding of the fundamental biological and ecological processes of speciation and range expansion, and the ecology of invasion.
In this study, we explored this exciting research perspective in two interbreeding fish species Parachondrostoma toxostoma (P. toxostoma) and Chondrostoma nasus (C. nasus). These two cyprinids have been defined as two distinct and different species [20], and some authors have even separated them into two genera [21]. However, the range expansion of C. nasus in the area in which P. toxostoma is endemic, over the last century, has resulted in contact zones in which the two species engage in multiple bidirectional hybridization events, which have resulted in a mosaic of hybrid zones [22]. Studies of hybridization and associated phenotypes in wildlife are challenging. In particular, determinations of the relative contributions of the parental genomes to hybrid phenotypes require calibration of the
phenotypic characterization of specimens in the allopatric parental populations. However, the sampling strategies required cover different environmental conditions, making it more difficult to separate out the species and environmental effects. Conversely, the sampling of sympatric populations minimizes the environmental effect, but promiscuity and hybridization phenomena may make it difficult to characterize the parental phenotypes.
We therefore decided, as a first step in this research perspective, to characterize the microbiota associated with P. toxostoma and C. nasus in the geographically closest parapatric populations inhabiting the same upstream river separated by dams before the invasion of C. nasus. For the overall microbiota characterization in these interbreeding species, we investigated the microbiota associated with the three main mucosal tissues in teleost fish: skin, gills and gut tissues. These tissues differ in terms of their epithelial structure and immune barriers, physiological functions and the pool of bacteria to which they are exposed. The skin and gills can be defined as external mucosal tissues, due to their exposure to bacteria in the surrounding water. By contrast, the gut is an internal mucosal tissues exposed to the bacteria of the digestive content.
We aimed 1) to characterize the patterns of microbiota diversity and structure associated with mucosal tissues within and between the interbreeding species, 2) to decipher the relative contribution of species, tissue and sex to the defined microbiota composition, and 3) to determine whether the core microbiota of each species in this stream corresponded to a host-specific signature, by comparison with the core microbiota common to both Chondrostoma species.
Materials & Methods
We focused on two freshwater fish species from the Chonsdrostoma species complex: Parachondrostoma toxostoma (Pt) and Chondrostoma nasus (Cn). We conducted field sampling in August 2015, on two allopatric populations inhabiting the Suran river (France). These two sampling sites, each characterized by the presence of one of the two species, were separated by 30 km of the watercourse and by a succession of dams, strongly limiting the contact between them and the potential for hybridization (figure 1). We sampled eight Pt specimens from the upstream station (Chavasnes-sur-Suran; latitude: 46.264383, longitude: 5.429392) and eight Cn specimens from the downstream station (Pont d’Ain, latitude: 46.048769, longitude: 5.324263). The collection design was balanced, with four males and four females collected for each species. Using sterile materials, we dissected the caudal fin, the gills (first arch, left side of the fish) and the gut, which we separated into two parts: the midgut and the hindgut (figure 2). A piece of each tissue was stored in 95% ethanol at -80°C for subsequent molecular analyses.
2. Molecular techniques
We extracted bacterial DNA from the various tissues, with the Qiagen Food Mericon kit (Qiagen, Venlo, Netherlands), according to a slightly modified version of the manufacturer’s protocol. Briefly, we used sterile materials to isolate a piece of tissue weighing about 5 mg, which was lysed by incubation in 700 µL of Food Lysis Buffer with 3 µl proteinase K for 3 hours at 56°C. The lysis reaction was stopped by placing the sample on ice. We added 500 µl chloroform, centrifuged the sample at 14,000 x g for 15 min and collected the supernatant. We added 1.2 mL of PB buffer and transferred the sample onto silicate column. The sample was cleaned with 500 µL AW2 buffer, and the bacterial DNA was eluted in 100 µL EB buffer. The extraction procedure was duplicated for eight samples, and we included three extraction-negative controls to evaluate potential contaminant at this step of the procedure.
We amplified a 251 bp fragment of the V4 region of the bacterial 16S rRNA gene in a slightly modified version of the dual-index method of Kozich et al. [23], as described by Galan et al. [24]. Briefly, the forward and reverse V4 primers included 8-bp index and Illumina adapters. The various combinations of forward and reverse indexed primers made it possible to identify each PCR product for pooling and loading into a single MiSeq flow cell. We duplicated the 16S gene amplification for each sample using different tagged primer combinations, and we performed negative PCR controls, including both the DNA extraction-negative controls and two amplification-extraction-negative controls. We also amplified a commercially available mock community, the ZymoBIOMICS Microbial community standard (Zymo Research, Irvine, CA, USA) consisting of a mixture of known quantities of DNA from eight bacterial species, in quadruplicate, to evaluate the accuracy of the overall procedure. The conditions of DNA amplification, and the purification and pooling of PCR products were as described by Galan et al. [24]. The final library was quantified with the Kapa quantification kit (Kapa Biosystems) and loaded into a MiSeq (Illumina) flow cell (expected cluster density, 120,000 to 140,000/mm2) with reagent kit v3 (Illumina, 2x300 cycles). High-throughput
sequencing of the 156 PCR products (72 duplicated samples, 4 mock community and 8 negative controls) was performed within a larger project corresponding to a total of 176 indexed PCR products.
3. Bioinformatics pipeline
The assembly, denoising, demultiplexing and clustering of the MiSeq dataset obtained were performed with Mothur v.1.34 [25], according to the standard Mothur MiSeq system operating procedure for Miseq sequences (https://www.mothur.org/wiki/MiSeq_SOP). Briefly, we merged R1 and R2 reads into contigs, with a threshold phred score quality >25, and we reattributed each sequence to the corresponding sample based on the exact specific index
combination. We considered only sequences with no ambiguous nucleotide and a sequence length of 249 to 275 bp. We then aligned the sequence variants to Silva SSU Reference alignment v123 [25]. We removed the sequences misaligned with the Silva alignment (position start=1968 end=11546) and the sequences matching with chloroplast, mitochondria, archaea and unclassified sequences in this database. We merged clusters of sequences differing by up to two nucleotides, considered as artifactual errors, and we removed the remaining singletons (unique sequences at the level of a sequencing run probably corresponding to sequencing errors). Finally, we detected and eliminated chimeric sequences with the Uchime algorithm [26], as implemented in Mothur. We applied the entire bioinformatics pipeline to the larger but homogeneous dataset for 176 PCR products pooled for the same NGS run. We obtained a total of 11615,713 denoised sequences. We clustered the 89,714 variants into 11,332 operating taxonomic units (OTU), on the basis of average hierarchical clustering with 97% similarity as the lower threshold, to generate a BIOM-formatted OTU table. For further analyses based on the phylogenetic diversity index, we generated a phylogenetic tree for the representative sequences from each OTU (i.e. the most abundant sequence), using a FastTree algorithm [27] implemented in QIIME v. 1.9.1 [28].
4. Validation of molecular and bioinformatics procedures
We obtained 158,500 to 163,895 denoised sequences for each quadruplicate of the mock community. Based on the known 16S rRNA sequences of the eight bacteria comprising this mock community, we estimated an average 0.05% global discrepancy confounding both PCR and Illumina errors. Moreover, the clustering of the denoised sequences into OTUs revealed that about 97% of the sequences for each mock community matched those for the eight expected OTUs.
We performed three duplicated negative controls for the DNA extraction step and two negative controls for the 16S rRNA amplification step. We obtained 489 to 4,738 denoised sequences for the three duplicated negative extraction controls, and 22 and 724 denoised sequences for the two negative amplification controls. These counts are low relative to the total number of sequences for each sample and were considered negligible given the average sequencing depth of 65,415 sequences for the 148 positive samples (72 duplicated tissue samples and quadruplicated mock community samples). Furthermore, the sequences obtained did not correspond to any systematic contamination. Finally, the detection of 14 to 94 sequences assigned to 16 unused tagged primer combinations indicated a negligible mistagging rate of 0.06% in our final dataset.
We observed a positive correlation between the sequencing depths of duplicates (Pearson’s r = 0.99, p<0.001), reflecting strong repeatability of the amplification efficiency and no biases associated with nucleic acid tagging sequences. We normalized the data for sequencing depth, by performing a rarefaction procedure involving random re-sampling, without replacement, of sequences for each sample to the minimal sequencing depth observed in the whole dataset, in this case 13,000 sequences. We removed from the dataset for all subsequent analyses four samples with an insufficient sequencing depth (<7,083 sequences). The procedure was repeated 1,000 times to avoid potential sampling error due to the randomization process. For the 1,000 OTU tables produced, we estimated Good’s coverage index and alpha diversity indices: the Shannon (binary logarithm) and phylogenetic diversity (Lozupone & Knight 2008) indices. Then, for each index, we considered the mean value estimated for the 1,000 OTU tables. The mean Good’s coverage was estimated at 0.993, indicating that our sequencing depth covered the high degree of diversity of the microbiota studied. We observed strong correlations between duplicates for the Shannon (Pearson’s r=
0.99, p<0.001) and phylogenetic diversity (Pearson’s r= 0.99, p<0.001) indices, demonstrating the repeatability of PCR amplification and validating the bioinformatics. We therefore combined the sequences from duplicates for further analyses. From the resulting combined OTU table, generated from the merged duplicated samples, we performed a rarefaction procedure on 34,000 sequences, i.e. the minimal sequencing depth of merged samples. We checked for a significant correlation between the eight extraction duplicates for the Shannon (Pearson’s r=0.99, p<0.001 and PD (Pearson’s r=0.99, p<0.001) indices. These results indicated no bias specific to a particular tissue type, and we stored one of the duplicated extraction samples, chosen at random. Finally, we generated rarefaction curves for the two alpha indices for 10 to 100,000 sequences, with 20 steps and 100 iterations. The patterns for both indices showed that the values rapidly reached a horizontal asymptote at a sequencing depth of 20,000 sequences (supplementary figure S1), confirming the consistency of the index values, estimated at 34,000 sequences. We considered the entire procedure, from DNA extraction to the estimation of the different diversity indices, to be validated, and we performed further analyses.
5. Statistical methods
a. Microbial diversity within mucosal tissues
We characterized the alpha diversity of the microbiota in each tissue, by estimating the classical Shannon index (binary logarithm), and phylogenetic diversity (PD), a qualitative index based on the total branch length of the phylogenetic tree of OTUs [29]. We hypothesized that species, tissues, and sex influence the composition and diversity of microbiota. We tested our hypotheses with generalized linear mixed models (GLMMs), in which the alpha index was the response variable, and species, tissue, sex and all two-way interactions were treated as
fixed explanatory factors. The models included the specimen as a random factor, as repeated observations (different tissues) were made for each specimen. We also included a variance structure function, in accordance with assumptions concerning the heteroscedasticity of residuals by tissue and by species. The significance of the effects of fixed explanatory factors was determined in likelihood ratio tests. GLMMs were generated with the nlme [30] package of R [31].
b. Divergence of microbiota composition and structure
We estimated the divergence of microbiota composition and structure with four dissimilarity indices providing slightly different information: Bray-Curtis, binary Jaccard, unweighted Unifrac and weighted Unifrac. The Bray-Curtis and binary Jaccard indices are based on the abundance and presence/absence of taxonomic units, respectively, regardless of phylogenetic relationships. The Unifrac distance takes into account phylogenetic relationships between OTUs, by considering the fraction of the total phylogenetic branch length that is unique or common to the communities considered, with or without weighting for the abundance of the taxonomic units [32]. We estimated these four dissimilarity indices for the 1,000 rarefied OTU tables and used the mean values obtained in subsequent analyses. For each index, we performed a principal coordinate analysis (PCoA), in which the microbiota communities were ordered along axes maximizing the variance between statistical units [33]. This procedure allows provides geometric information about the contribution of each biological factor shaping the observed divergence of the microbiota. We hypothesized that stochastic and deterministic factors would have different effects on microbiota composition. Deterministic factors should result in lower dissimilarities of microbiota composition and, thus, lower levels of dispersion away from the centroid of the factor considered, in this case,
the tissue. For this purpose, we tested the homogeneity of dispersions of microbiota relative to the centroids between tissues for each species, in multivariate analyses of the homogeneity of group dispersion (the betadisper function of the vegan package [34] of R [31]) for the four indices, with free and pairwise permutations in post-hoc tests (10,000 iterations).
We performed a main PERMANOVA (adonis function of the vegan package [34]), which is similar to AMOVA. It partitions the sum of squared deviations from the centroids [33] between explanatory factors. We tested the effects of species, sex, and tissue, and two-way interactions, on the variation of total dissimilarity between microbiota. The significance of the effect of each factor was assessed in an F test based on the sequential sum of squares estimated from a 10,000-permutation procedure. We performed pairwise PERMANOVA as a post-hoc nonparametric test, with 10,000 permutations and the determination of a p-value, the significance of which was determined according to the false discover rate (FDR) correction procedure of Benjamini & Hochberg [35]. Finally, we estimated for each tissue, the proportions of OTUs common to the two species and unique to each species.
c. Phyla associated with mucosal tissues
We characterized the microbiota associated with mucosal tissues at the level of the bacterial phylum, a conservative approach to define the divergence of microbiota composition between samples and grouping taxa with similar biological characteristics and potential physiological functions. We averaged sequence counts for the 1,000 rarefied OTU tables (34,000 sequences), and we then added mean OTU sequence counts at the phylum level.
We characterized the whole-tissue core microbiota as the bacterial phyla common to all tissue samples, firstly for each species considered separately, and then for the
Chondrostoma species complex. We then determined the core microbiota of each tissue for each species separately and for the Chondrostoma species complex.
We compared the abundance of bacterial phyla between mucosal tissues for each species and between species for each mucosal tissue. We performed nonparametric t tests (10,000 permutations) in Qiime 1.9.1, with a threshold p-value for significance after FDR correction of 0.05 [35].
Results
1. Microbial diversity within mucosal tissues
We observed an effect of mucosal tissue on the Shannon and Phylogenetic diversity indices, but this effect differed between the two species studied (Shannon: tissues x species interaction, χ²=16.52, p<0.001; PD: tissues x species interaction, χ²=23.04, p<0.001). In C. nasus, Shannon diversity differed principally between external (caudal fin and gills) and internal (midgut and hindgut) tissues, which had a less diverse microbiota (figure 3A). In P. toxostoma, Shannon indices were similarly high for the caudal fin, midgut and hindgut, with only the gills presenting a slightly less diverse microbiota (figure 3A). The pattern of PD index variation discriminated between the external and internal mucosal tissues. Opposite patterns of PD variation between these tissues were observed in the two species. In P. toxostoma, the caudal fin and gills had a lower PD of bacteria than the internal tissues, whereas, in C. nasus, the PD was lower in the gut than in external mucosal tissues (figure 3A). However, the caudal fin-associated microbiota in P. toxostoma was characterized by a high Shannon index but a low PD (figure 3A), suggesting that these communities harbored diverse bacterial taxa that were closely phylogenetically related.
Sex also affected the Shannon and PD indices, and this effect differed between tissues (Shannon: tissues x sex interaction, χ²=11.30, p=0.010, PD: tissues x sex interaction, χ²=8.38, p=0.039). For both indices, we found that the microbiota diversity associated with the caudal fin and gills was characterized by a higher degree of sex dimorphism than observed for the gut microbiota (Figure 3B). The external tissue-associated microbiota was more diverse in females than in males, whereas the microbiota associated with internal mucosal tissues was similarly diverse in the two sexes (Figure 3B).
Finally, the species x sex interaction was not significant for either of the indices considered (Shannon: species x sex interaction, χ²=0.08, p=0.768, PD: species x sex interaction, χ²=0.03, p=0.859).
2. Divergence of microbiota composition and structure
The two first axes of the principal coordinate analyses highlighted, consistently for the four dissimilarity metrics, the divergence of microbiota composition relative to both mucosal tissue and species (unweighted Unifrac, figure 4; Bray-Curtis, Jaccard and weighted Unifrac distances, figure S2). Within particular, as previously shown for alpha diversity, we observed discrimination between external (caudal fin and gills) and internal (midgut and hindgut) mucosal tissues (figure 4A). We detected no differentiation between the microbiota associated with the two parts of the gut, regardless of the species considered, consistent with microbiota composition remaining constant throughout the length of the gut (midgut/hindgut). PCoA also showed strong homogeneity of gut microbiota composition in P. toxostoma (figure 4A and 4B). This observation was confirmed by analyses of within-group dispersion, which indicated lower levels of dispersion for the gut microbiota than for the caudal fin and gill microbiota in P. toxostoma (pairwise permutations tests, p<0.001, supplementary tables S1 and S2). By contrast, dispersion from the centroid did not differ
significantly between tissues for the microbiota in C. nasus (pairwise permutations tests, p>0.05, supplementary table S1).
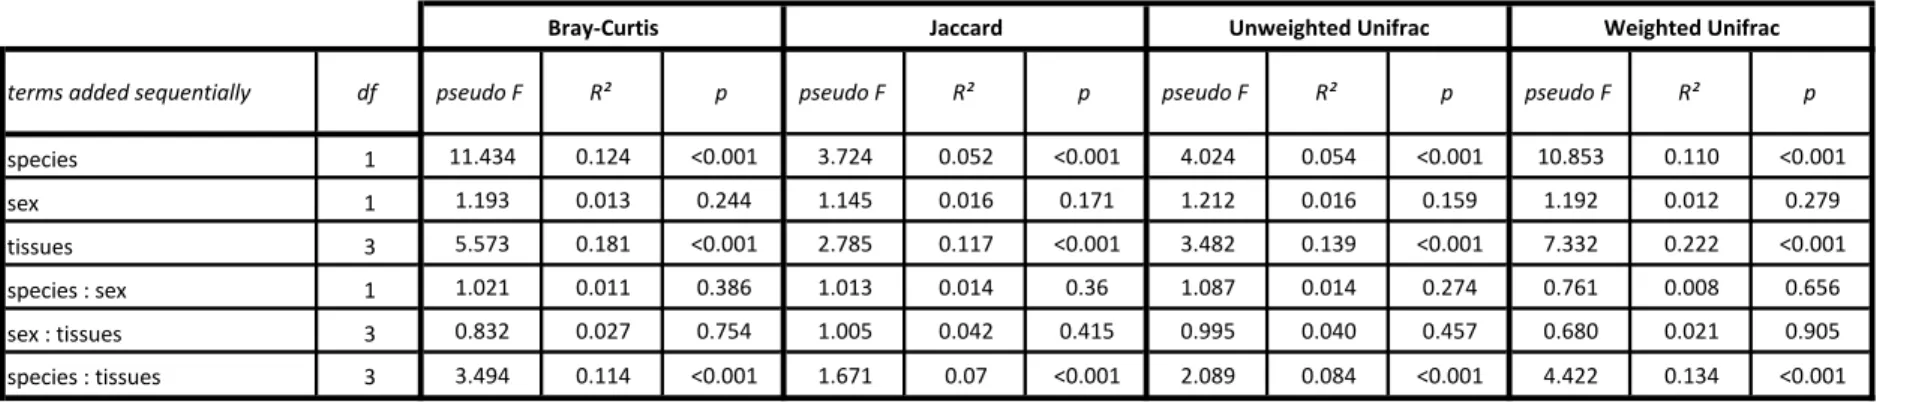
These graphical observations obtained by PCoA were confirmed by the principal PERMANOVA, which indicated, for the four dissimilarity metrics, a significant effect of tissue x species interaction (p<0.001, see details for each metric in table 1). Mucosal tissue was the most important explanatory factor for microbiota dissimilarity, with an estimated R² of 0.11 to 0.22. Pairwise PERMANOVA revealed a differentiation of microbiota composition into three groups (caudal fin, gills and midgut/hindgut) within each species (p<0.05, see details for each metric in supplementary table S3). Indeed, the microbiota associated with the midgut and hindgut did not differ in composition, whatever the species considered (PERMANOVA, p>0.05). Finally, pairwise PERMANOVA performed independently for each tissue showed a dissimilarity of microbiota composition between the two species studied (PERMANOVA, p<0.05, see details for each metric in supplementary table S4).
The percentage of OTUs common to the two species was similar for each tissue, at 23% to 27% (supplementary figure S3). C. nasus was characterized by a large number of specific OTUs in the caudal fin and gills, accounting for 59% and 46%, respectively, of the total number of OTUs observed in these tissues. By contrast, P. toxostoma was characterized by a large number of specific OTUs in the midgut and hindgut, accounting for 56% and 58%, respectively, of the total number of OTUs observed in these tissues.
3. Phyla associated with mucosal tissues
We identified 11,332 OTUs from 41 phyla in our dataset. The all-tissues core microbiota contained OTUs from six phyla in C. nasus and eight phyla in C. toxostoma. The Chondrostoma species complex had an all-tissues core microbiota of five phyla: Acidobacteria, Bacteroidetes, Firmicutes, Proteobacteria and Verrucomicrobia. However, a breakdown by
tissue revealed a greater complexity of tissue-specific core microbiotas. The core microbiotas for each tissue had the following compositions: 14, 11, 6 and 9 phyla for the caudal fin, gills, midgut and hindgut, respectively, in C. nasus; 11, 9, 14 and 17 phyla for the caudal fin, gills, midgut and hindgut, respectively, in P. toxostoma and 11, 8, 5 and 9 phyla in caudal fin, gills, midgut and hindgut, respectively, in Chondrostoma species complex (figure 5).
We detected several phyla that differed in abundance between tissues in the two species (figure 6, see details in table S5 and figure S4). The key exception was the microbiotas of the midgut and hindgut, which did not differ significantly in phylum composition, regardless of the species considered. We also found that the abundance of unclassified bacteria was higher in the gills than in the caudal fin in P. toxostoma.
In P. toxostoma, the abundance of Actinobacteria and Bacteroidetes was higher in the caudal fin than in the other three mucosal tissues. The midgut and hindgut were characterized principally by a higher abundance of Cyanobacteria and Proteobacteria than the caudal fin. The hindgut also harbored a higher abundance of Planctomycetes than the external mucosal tissues.
In C. nasus, the abundance of Actinobacteria and Deinococcus-thermus was higher in the caudal fin than in the other three mucosal tissues. Firmicutes bacteria were also more abundant in the caudal fin and gills than in the gut microbiota, which was characterized by a higher abundance of the CKC4 and Fusobacteria phyla than the external mucosal tissues.
All mucosal tissues except the caudal fin displayed differences in the abundance of several phyla between the two interbreeding species (figure 6, see details in table S6). The abundance of Firmicutes, CKC4 and Spirochaetae was higher in the gills of C. nasus than in the gills of P. toxostoma, although these phyla accounted for only a small proportion of the microbiota (mean proportion below 1%, table S3). The midgut of C. nasus harbored a high
abundance of Bacteroidetes and CKC4, whereas the abundance of Planctomycetes was high in the midgut of P. toxostoma. A comparison of the hindgut microbiota of the two species highlighted a high abundance of CKC4 and Fusobacteria in C. nasus, and of Cyanobacteria in P. toxostoma.
Discussion
Understanding the role of the microbiota as a reproductive barrier or a source of adaptive novelty in the fundamental biological phenomenon of speciation is an exciting new challenge requiring explorations of microbiota variation in wild interbreeding species. We report here, in two wild populations of P. toxostoma and C. nasus, differences in the microbiota between mucosal tissues. In particular, we observed a strong differentiation of the microbiota between external and internal tissues, with opposite patterns of bacterial diversity in these tissues between the two interbreeding species. These findings suggest that specific environmental and genetic filters have shaped the microbiota and may reflect deterministic assemblages of bacteria. We defined a shared whole-body core microbiota common to the two Chondrostoma spp., but our results highlight crucial differences between tissues in which local microbe – host genome interactions occur. If genome plays an important role in the determination of microbiota, the specificity of the microbiota defined for each tissue and species could be profoundly altered by genetic admixture in hybrids in the sympatric area.
We found that the nature of the tissue was a critical primary determinant of microbiota diversity and composition. Intraindividual microbiota variation between tissues has been little explored in wild animal species [36], and has been the subject of only a few studies in humans [6, 7, 37]. Our results highlight a “whole-body” view of the intraindividual microbiota in wild fish species. This intraindividual variation, which is consistent within a species, is driven by
environmental and genetic factors [16]. The different sources of bacteria in contact with mucosal tissues probably account for the major differences in the microbiota between external tissues (such as the caudal fin and gills, in contact with the surrounding water), and internal tissues (such as the midgut and hindgut, in contact with the bacteria present in the diet). River water is a favorable environment for bacterial growth, and the external mucosal barriers (the skin and the gills), are in constant contact with this source of bacteria. River water is also a source of bacteria for the gut microbiota [38, 39], but the structure of the GIT microbiota depends principally on the dietary regime of the fish [40–42]. A meta-analysis showed that the composition of the gut microbiota in different fish species was determined by their trophic level: herbivorous, omnivorous or carnivorous [43].
In addition to local abiotic factors, such as temperature, pH and oxygenation, which can have selective effects on bacteria by providing favorable growth conditions, the physiology of the local host tissues, and their immune responses in particular, may select for a microbiota with a specific composition [44]. Little is known about mucosal immunity in teleost fish, but the three main mucosal lymphoid tissues (skin, gills and gut) differ in their cellular organization and are characterized by different immune components [45]. We also observed an effect of sex on the diversity of the external tissue microbiota. Sex dimorphism in microbiota composition has been reported in many studies, but particularly for the gut microbiota [46–48]. Sex hormones can modulate host physiology strongly, particularly in terms of the development of effective immune responses to infection [49]. The higher diversity of bacteria in the skin and gills of females than in those of males may therefore reflect differences in hormonal status, leading to a downregulation of defense barriers in females. Further analyses of the relationships between tissue transcriptomes and the microbiota present could provide support for these close, local host-microbe interactions.
The two interbreeding species studied each displayed their own specific variation of microbiota diversity and composition between tissues. Our results highlight the absence of a similar general pattern in fish species for microbiota diversity in the external and internal tissues, indicating that interspecific microbiota comparisons are possible only for given tissues. The skin mucosa in teleost fish constitutes an important active dynamic immunological barrier to infection and the composition of the skin-associated microbiota may result from close interactions with host immune genes [50]. Simkova et al. [51] reported differences in Mhc gene polymorphism between P. toxostoma and C. nasus, which had a smaller number of specific alleles. Conversely, C. nasus had a larger number of Mhc variants per specimen. This immunogenetic polymorphism between the two species may reflect interspecific variation of the phylogenetic diversity of the skin microbiota observed. The gut microbiota is also highly dependent on dietary regime. Chondrostoma nasus is a perilithon grazer with a diet composed of diatoms and chlorophytes, whereas P. toxostoma has a slightly more diverse regime based on algae and invertebrate prey [52], although there is a dietary overlap between the two species, depending on environmental condition (i.e. particularly in similar environmental conditions, [53]). In heterogeneous environmental conditions, the difference in dietary regime between the two interbreeding species may account for the poorly diverse gut microbiota in C. nasus and the high diversity observed in P. toxostoma. However, the similarity of the environments from which these two species were sampled (parapatric populations) implies that the gut microbiota diversity observed probably results at least partly from the diversity of food ingested, but also from the bacterial functions required for nutrient assimilation and host compatibility. In particular, we detected a very strong homogeneity of gut microbiota composition in P. toxostoma specimens, suggesting that there may be strong deterministic factors, such as local host gene expression in gut tissue [54, 55].
The core microbiota common to the two interbreeding species studied was restricted to five phyla: Acidobacteria, Bacteroidetes, Firmicutes, Proteobacteria and Verrucomicrobia. These bacterial phyla are consistent with those generally described in fish microbiota studies (see review [56]). The core microbiota is the set of bacterial taxa systematically associated (i.e. stable in space and time) with the host organism studied. In our study, the core microbiota were defined in only one locality and therefore was probably larger than a specific signature common in all environmental contexts. The existence of a core microbiota at a high taxonomic level should reflect associated functions common to the members of the phylum [17]. The stability of the core microbiota is also linked to the idea of consistent microbial communities associated with organisms and forming a biological unit: the holobiont [12]. However, even if defined to a specific environmental context in our study, the variation of the core microbiota between tissues highlighted the local tissue-specific interactions between bacteria and a host genome, a situation more complex than considering host-microbe interactions as a single unit at the whole-body scale. Indeed, we defined core microbiotas of six to 17 phyla, depending on the tissue and species considered. For example, the core microbiota in P. toxostoma consisted of 11 phyla in the caudal fin and 17 phyla in the hindgut, whereas the core microbiota of the corresponding tissues of C. nasus contained 15 and nine phyla, respectively. This pattern highlights the dependence of the core microbiota in relation to host tissues and lead to the hypothesis of different impact of introgressive hybridization on the microbiota associated to the tissues considered.
The relative abundance of phyla varied between tissues and species. Phylum abundances in the gut microbiota differed between the two species, potentially due to differences in diet, as described above. In particular, the high abundance of Cyanobacteria and Planctomycetes in P. toxostoma was similar to that observed in the gut microbiota of the grass
carp (Ctenopharyngodon idella), consistent with a basically herbivorous dietary regime [57]. In C. nasus, the abundance of Bacteroidetes, known to be associated with fermentative metabolism and the degradation of cellulose from plant materials [58], and Fusobacteria, known to produce large amounts of vitamin B12, may reflect requirements for metabolic functions [59]. These abundant phyla, their relevance in specific dietary conditions and for functional activities, suggest that changes to the gut microbiota in hybrids could have a profound impact on nutrient absorption and other critical physiological functions.
In conclusion, our study reveals intraindividual variation in the microbiota associated with particular mucosal tissues. The species signature of microbiota may reflect the role of deterministic factors, such as host genome in particular, in controlling the constitution of bacterial assemblages, even if environmental factors would also influence the microbiota composition observed. The close interactions between the host genome/transcriptome and tissue-associated microbiota could be profoundly altered by genetic admixture in hybrids, with an impact on performance relative to environmental constraints [9, 60]. Further investigations will be required to explore microbiota rearrangement in hybrids and its consequences for post-mating reproductive isolation, shaping the geographic mosaic of hybrid zones.
Acknowledgments: We are grateful to Maxime Galan (UMR CBGP, Montferrier-sur-lez) for technical advices. We thank the plateform Genotypage – Séquençage (Université Montpellier, IRD, CNRS, EPHE), and particularly Frédérique Cerqueira for her technical help. We are also grateful to Benjamin Hérodet (Fédération de l’Ain pour la pêche et la protection des milieux aquatiques) for help in the carrying out of the field sampling. The study has been funded by
Electricité de France within the project FACIES developing scientific advances in favor of Aquatic System Biodiversity.
References
1. Ursell LK, Metcalf JL, Parfrey LW, Knight R (2012) Defining the human microbiome. Nutr Rev 70:S38–S44. doi: 10.1111/j.1753-4887.2012.00493.x
2. Sommer F, Bäckhed F (2013) The gut microbiota — masters of host development and physiology. Nat Rev Microbiol 11:227–238. doi: 10.1038/nrmicro2974
3. Shapira M (2016) Gut microbiotas and host evolution: scaling up symbiosis. Trends Ecol Evol 31:539–549. doi: 10.1016/j.tree.2016.03.006
4. Hird SM (2017) Evolutionary biology needs wild microbiomes. Front Microbiol. doi: 10.3389/fmicb.2017.00725
5. Marchesi JR (2010) Prokaryotic and eukaryotic diversity of the human gut. In: Adv. Appl. Microbiol. Elsevier, pp 43–62
6. Costello EK, Lauber CL, Hamady M, et al (2009) Bacterial Community Variation in Human Body Habitats Across Space and Time. Science 326:1694–1697. doi: 10.1126/science.1177486
7. Ursell LK, Clemente JC, Rideout JR, et al (2012) The interpersonal and intrapersonal diversity of human-associated microbiota in key body sites. J Allergy Clin Immunol 129:1204–1208. doi: 10.1016/j.jaci.2012.03.010
8. Spor A, Koren O, Ley R (2011) Unravelling the effects of the environment and host genotype on the gut microbiome. Nat Rev Microbiol 9:279–290. doi: 10.1038/nrmicro2540
9. Wang J, Kalyan S, Steck N, et al (2015) Analysis of intestinal microbiota in hybrid house mice reveals evolutionary divergence in a vertebrate hologenome. Nat Commun 6:6440. doi: 10.1038/ncomms7440
10. Goodrich JK, Davenport ER, Waters JL, et al (2016) Cross-species comparisons of host genetic associations with the microbiome. Science 352:532–535.
11. Davenport ER (2016) Elucidating the role of the host genome in shaping microbiome composition. Gut Microbes 7:178–184. doi: 10.1080/19490976.2016.1155022
12. Brucker RM, Bordenstein SR (2012) Speciation by symbiosis. Trends Ecol Evol 27:443– 451. doi: 10.1016/j.tree.2012.03.011
13. Baxter NT, Wan JJ, Schubert AM, et al (2015) Intra- and interindividual variations mask interspecies variation in the microbiota of sympatric Peromyscus populations. Appl Environ Microbiol 81:396–404. doi: 10.1128/AEM.02303-14
14. Colston TJ, Jackson CR (2016) Invited review: microbiome evolution along divergent branches of the vertebrate tree of life: what’s known and unknown. Mol Ecol. doi: 10.1111/mec.13730
15. Roeselers G, Mittge EK, Stephens WZ, et al (2011) Evidence for a core gut microbiota in the zebrafish. ISME J 5:1595–1608.
16. Benson AK, Kelly SA, Legge R, et al (2010) Individuality in gut microbiota composition is a complex polygenic trait shaped by multiple environmental and host genetic factors. Proc Natl Acad Sci 107:18933–18938. doi: 10.1073/pnas.1007028107
17. Bordenstein SR, Theis KR (2015) Host biology in light of the microbiome: ten principles of
holobionts and hologenomes. PLOS Biol 13:e1002226. doi:
10.1371/journal.pbio.1002226
18. Nolte AW, Tautz D (2010) Understanding the onset of hybrid speciation. Trends Genet 26:54–58. doi: 10.1016/j.tig.2009.12.001
19. Janson EM, Stireman JO, Singer MS, Abbot P (2008) Phytophagous insect-microbe mutualisms and adaptive evolutionary diversification. Evolution 62:997–1012. doi: 10.1111/j.1558-5646.2008.00348.x
20. Durand J-D (2003) Insight into the origin of endemic mediterranean ichthyofauna: phylogeography of Chondrostoma genus (Teleostei, Cyprinidae). J Hered 94:315–328. doi: 10.1093/jhered/esg074
21. Robalo JI, Almada VC, Levy A, Doadrio I (2007) Re-examination and phylogeny of the genus Chondrostoma based on mitochondrial and nuclear data and the definition of 5 new genera. Mol Phylogenet Evol 42:362–372. doi: 10.1016/j.ympev.2006.07.003 22. Costedoat C, Pech N, Salducci M-D, et al (2005) Evolution of mosaic hybrid zone between
invasive and endemic species of Cyprinidae through space and time. Biol J Linn Soc 85:135–155.
23. Kozich JJ, Westcott SL, Baxter NT, et al (2013) Development of a Dual-Index Sequencing Strategy and Curation Pipeline for Analyzing Amplicon Sequence Data on the MiSeq Illumina Sequencing Platform. Appl Environ Microbiol 79:5112–5120. doi: 10.1128/AEM.01043-13
24. Galan M, Razzauti M, Bard E, et al (2016) 16S rRNA Amplicon Sequencing for Epidemiological Surveys of Bacteria in Wildlife. mSystems 1:e00032-16. doi: 10.1128/mSystems.00032-16
25. Schloss PD, Westcott SL, Ryabin T, et al (2009) Introducing mothur: open-source, platform-independent, community-supported software for describing and comparing
microbial communities. Appl Environ Microbiol 75:7537–7541. doi: 10.1128/AEM.01541-09
26. Edgar RC, Haas BJ, Clemente JC, et al (2011) UCHIME improves sensitivity and speed of chimera detection. Bioinformatics 27:2194–2200. doi: 10.1093/bioinformatics/btr381 27. Price MN, Dehal PS, Arkin AP (2009) FastTree: computing large minimum evolution trees
with profiles instead of a distance matrix. Mol Biol Evol 26:1641–1650. doi: 10.1093/molbev/msp077
28. Caporaso JG, Kuczynski J, Stombaugh J, et al (2010) QIIME allows analysis of high-throughput community sequencing data. Nat Methods 7:335–336.
29. Lozupone CA, Hamady M, Kelley ST, Knight R (2007) Quantitative and qualitative diversity measures lead to different insights into factors that structure microbial communities. Appl Environ Microbiol 73:1576–1585. doi: 10.1128/AEM.01996-06
30. Pinheiro J, Bates D, DebRoy S, et al (2017) nlme: Linear and nonlinear mixed effects models. R package version 3.1-127.
31. R Core Team (2016) R: A language and environment for statistical computing. R Foundation for Statistical Computing, Vienna, Austria. URL https://www.R-project.org/. 32. Lozupone C, Knight R (2005) UniFrac: a new phylogenetic method for comparing microbial communities. Appl Environ Microbiol 71:8228–8235. doi: 10.1128/AEM.71.12.8228-8235.2005
33. Paliy O, Shankar V (2016) Application of multivariate statistical techniques in microbial ecology. Mol Ecol 25:1032–1057. doi: 10.1111/mec.13536
34. Oksanen J, Blanchet G, Friendly R, et al (2016) vegan: community ecology package. R package version 2.4-1.
35. Benjamini Y, Hochberg Y (1995) Controlling the false discovery rate: a practical and powerful approach to multiple testing. J R Stat Soc Ser B Methodol 57:289–300.
36. Sabino-Pinto J, Bletz MC, Islam MM, et al (2016) Composition of the cutaneous bacterial community in japanese amphibians: Effects of captivity, host species, and body region. Microb Ecol 72:460–469. doi: 10.1007/s00248-016-0797-6
37. Huttenhower C, Gevers D, Knight R, et al (2012) Structure, function and diversity of the healthy human microbiome. Nature 486:207–214. doi: 10.1038/nature11234
38. Smith CC, Snowberg LK, Caporaso JG, et al (2015) Dietary input of microbes and host genetic variation shape among-population differences in stickleback gut microbiota. ISME J.
39. Giatsis C, Sipkema D, Smidt H, et al (2015) The impact of rearing environment on the development of gut microbiota in tilapia larvae. Sci Rep 5:18206. doi: 10.1038/srep18206
40. Muegge BD, Kuczynski J, Knights D, et al (2011) Diet drives convergence in gut microbiome functions across mammalian phylogeny and within humans. Science 332:970–974. doi: 10.1126/science.1198719
41. Ingerslev H-C, von Gersdorff Jørgensen L, Lenz Strube M, et al (2014) The development of the gut microbiota in rainbow trout (Oncorhynchus mykiss) is affected by first feeding and diet type. Aquaculture 424–425:24–34. doi: 10.1016/j.aquaculture.2013.12.032 42. Liu H, Guo X, Gooneratne R, et al (2016) The gut microbiome and degradation enzyme
activity of wild freshwater fishes influenced by their trophic levels. Sci Rep 6:24340. doi: 10.1038/srep24340
43. Sullam KE, Essinger SD, Lozupone CA, et al (2012) Environmental and ecological factors that shape the gut bacterial communities of fish: a meta-analysis: Fish gut bacterial communities. Mol Ecol 21:3363–3378. doi: 10.1111/j.1365-294X.2012.05552.x
44. Hooper LV, Littman DR, Macpherson AJ (2012) Interactions between the microbiota and the immune system. Science 336:1268–1273.
45. Gomez D, Sunyer JO, Salinas I (2013) The mucosal immune system of fish: The evolution of tolerating commensals while fighting pathogens. Fish Shellfish Immunol 35:1729– 1739. doi: 10.1016/j.fsi.2013.09.032
46. Li X, Yan Q, Ringø E, et al (2016) The influence of weight and gender on intestinal bacterial community of wild largemouth bronze gudgeon (Coreius guichenoti, 1874). BMC Microbiol. doi: 10.1186/s12866-016-0809-1
47. Bolnick DI, Snowberg LK, Hirsch PE, et al (2014) Individual diet has sex-dependent effects on vertebrate gut microbiota. Nat Commun. doi: 10.1038/ncomms5500
48. Gomez A, Luckey D, Taneja V (2015) The gut microbiome in autoimmunity: Sex matters. Clin Immunol 159:154–162. doi: 10.1016/j.clim.2015.04.016
49. Nunn CL, Lindenfors P, Pursall ER, Rolff J (2009) On sexual dimorphism in immune function. Philos Trans R Soc B Biol Sci 364:61–69. doi: 10.1098/rstb.2008.0148
50. Larsen A, Tao Z, Bullard SA, Arias CR (2013) Diversity of the skin microbiota of fishes: evidence for host species specificity. FEMS Microbiol Ecol 85:483–494. doi: 10.1111/1574-6941.12136
51. Šimková A, Civáňová K, Gettová L, Gilles A (2013) Genomic porosity between invasive Chondrostoma nasus and endangered endemic Parachondrostoma toxostoma (Cyprinidae): The evolution of MHC IIB genes. PLoS ONE 8:e65883. doi: 10.1371/journal.pone.0065883
52. Corse E, Costedoat C, Pech N, et al (2009) Trade-off between morphological convergence and opportunistic diet behavior in fish hybrid zone. Front Zool 6:26. doi: 10.1186/1742-9994-6-26
53. Corse E, Pech N, Sinama M, et al (2015) When Anthropogenic River Disturbance Decreases Hybridisation between Non-Native and Endemic Cyprinids and Drives an Ecomorphological Displacement towards Juvenile State in Both Species. PLOS ONE 10:e0142592. doi: 10.1371/journal.pone.0142592
54. Mansfield GS, Desai AR, Nilson SA, et al (2010) Characterization of rainbow trout (Oncorhynchus mykiss) intestinal microbiota and inflammatory marker gene expression in a recirculating aquaculture system. Aquaculture 307:95–104. doi: 10.1016/j.aquaculture.2010.07.014
55. Batista S, Ozório ROA, Kollias S, et al (2016) Changes in intestinal microbiota, immune- and stress-related transcript levels in Senegalese sole (Solea senegalensis) fed plant ingredient diets intercropped with probiotics or immunostimulants. Aquaculture 458:149–157. doi: 10.1016/j.aquaculture.2016.03.002
56. Llewellyn MS, Boutin S, Hoseinifar SH, Derome N (2014) Teleost microbiomes: the state of the art in their characterization, manipulation and importance in aquaculture and fisheries. Front Microbiol. doi: 10.3389/fmicb.2014.00207
57. Wu S, Wang G, Angert ER, et al (2012) Composition, diversity, and origin of the bacterial community in grass carp intestine. PLoS ONE 7:e30440. doi: 10.1371/journal.pone.0030440
58. Flint HJ, Bayer EA, Rincon MT, et al (2008) Polysaccharide utilization by gut bacteria: potential for new insights from genomic analysis. Nat Rev Microbiol 6:121–131. doi: 10.1038/nrmicro1817
59. Tsuchiya C, Sakata T, Sugita H (2007) Novel ecological niche of Cetobacterium somerae, an anaerobic bacterium in the intestinal tracts of freshwater fish. Lett Appl Microbiol 0:071018031740002–??? doi: 10.1111/j.1472-765X.2007.02258.x
60. Li Z, Wright A-DG, Si H, et al (2016) Changes in the rumen microbiome and metabolites reveal the effect of host genetics on hybrid crosses: Changes in rumen microbiome and metabolites. Environ Microbiol Rep 8:1016–1023. doi: 10.1111/1758-2229.12482
Figure 1. Map of the Ain region (France) showing the two sampling sites in the Suran river. Figure 2. Diagram representing the locations of tissues sampled on fish species.
Figure 3. Alpha diversity indices of microbiota in tissues in relation to A) species and B) sex. Shannon (filled bars) and Phylogenetic Diversity (striped bars) indices (mean + SE) of microbiota associated with the four mucosal tissues in C. nasus (grey) and P. toxostoma (black).
Figure 4. Principal Coordinates Analysis exploring the effect tissues and species on the unweighted Unifrac distance of microbiota composition. We present the two first axes of independent PCoA analyses performed. Each point corresponds to one microbiota sample colored following A) the 4 mucosal tissues: caudal fin (blue triangle), gills (orange circle), midgut (green triangle) and hindgut (purple triangle); B) the two species: C. nasus (orange triangle) and P. toxostoma (green square).
Figure 5. Core microbiota of Chondrostoma species in each tissue at the phylum taxonomic level. Core microbiota was identified associated to C. nasus (grey), P. toxostoma (black) or both Chondrostoma species (double traits grey and black). Common taxa to all samples are bolded.
Figure 6. Cumulative bar charts of main bacterial phyla present in mucosal tissues of C. nasus and P. toxostoma. Percentages show the mean relative abundance of each phylum by tissues and species based on the averaged phylum abundance table resulting from the 1,000 rarefied OTU tables.
Supplementary Figure Legends
Supplementary figure S1. Alpha diversity rarefactions curves. Procedure of rarefactions from 10 to 100,000 sequences with 20 steps and 100 iterations for A) Shannon and B) Phylogenetic Diversity indices.
Supplementary Figure S2. Principal Coordinates Analysis exploring the effect tissues and species on the dissimilarities of microbiota compositions. For the A) Bray-Curtis, B) Jaccard and C) weighted Unifrac distance matrices we present the two first axes of independent PCoA analyses performed. Each point corresponds to one microbiota sample colored following 1) the 4 mucosal tissues: caudal fin (blue triangle), gills (orange circle), midgut (green triangle) and hindgut (purple triangle); 2) the two species: C. nasus (orange triangle) and P. toxostoma (green square).
Supplementary figure S3. Common and specific OTUs of P. toxostoma and C. nasus in the different mucosal tissues. Venn diagram showed numbers and percentages of OTUs specific to P. toxostoma, C. nasus and shared by the two species in caudal fin, gills, midgut and hindgut. Supplementary figure S4. Cumulative bar charts of main bacterial phyla present in mucosal tissues of C. nasus and P. toxostoma. Percentages show the mean relative abundance of each phylum for each sample from the 1,000 rarefied OTU tables by A) caudal fin, B) gills, C) midgut and D) hindgut
Figure 1
Chavannes-sur-Suran
Pont-d’Ain
gills midgut hindgut caudal fin
Figure 3
B. 0 25 50 75 100 Mucosal tissuesCaudal fin Gills Midgut Hindgut
S h a n n o n ind e x P h y log e n e tic D iv e rs it y ind e x sex Female Male 0 2 4 6 8 0 25 50 75 100 0 2 4 6 8
Caudal fin Gills MidgutHindgut
S h a n n o n ind e x P h y log e n e tic D iv e rs it y ind e x A.
Caudal fin Gills MidgutHindgut
Mucosal tissues C. nasus Mucosal tissues P. toxostoma C. nasus P. toxostoma species
Figure 4
Figure 5
Core microbiota
Actinobacteria Bacteroidetes Firmicutes Proteobacteria Verrucomicrobia CKC4 Chlorobi Chloroflexi Cyanobacteria Fusobacteria Gemmatimonadetes Acidobacteria Actinobacteria Bacteroidetes Chlorobi Chloroflexi Cyanobacteria Deinococcus-Thermus Firmicutes Planctomycetes Proteobacteria Verrucomicrobia CKC4 Fusobacteria Gracillibacteria Spirochaetae Acidobacteria Actinobacteria Bacteroidetes Cyanobacteria Firmicutes Planctomycetes Proteobacteria Verrucomicrobia CKC4 Gracillibacteria Chloroflexi Spirochaetae Fusobacteria Lentisphaerae Nitrospirae Planctomycetes TM6 Actinobacteria Bacteroidetes CKC4 Cyanobacteria Firmicutes Fusobacteria Planctomycetes Proteobacteria Verrucomicrobia Acidobacteria Chlamydae Chlorobi Chloroflexi Gemmatimonadetes Lentisphaerae Nitrospirae TM6C. nasus
P. toxostoma
caudal fin
gills
midgut
hindgut
Figure 6
0% 10% 20% 30% 40% 50% 60% 70% 80% 90% 100%Actinobacteria Bacteroidetes CKC4 Cyanobacteria Deinococcus-Thermus Firmicutes
Fusobacteria Planctomycetes Proteobacteria Verrucomicrobia unclassified Others
caudal fin
gills
midgut
hindgut
terms added sequentially df pseudo F R² p pseudo F R² p pseudo F R² p pseudo F R² p species 1 11.434 0.124 <0.001 3.724 0.052 <0.001 4.024 0.054 <0.001 10.853 0.110 <0.001 sex 1 1.193 0.013 0.244 1.145 0.016 0.171 1.212 0.016 0.159 1.192 0.012 0.279 tissues 3 5.573 0.181 <0.001 2.785 0.117 <0.001 3.482 0.139 <0.001 7.332 0.222 <0.001 species : sex 1 1.021 0.011 0.386 1.013 0.014 0.36 1.087 0.014 0.274 0.761 0.008 0.656 sex : tissues 3 0.832 0.027 0.754 1.005 0.042 0.415 0.995 0.040 0.457 0.680 0.021 0.905 species : tissues 3 3.494 0.114 <0.001 1.671 0.07 <0.001 2.089 0.084 <0.001 4.422 0.134 <0.001
Bray-Curtis Jaccard Unweighted Unifrac Weighted Unifrac
Table 1. Main PERMANOVA exploring the effect of species, tissues and sex on dissimilarity distances between microbiota compositions.
The models included species, tissues, sex and interaction of order 2 and were performed independently on Bray-Curtis, Jaccard, unweighted Unifrac and weighted Unifrac distance matrices. The terms were added sequentially and tested on pseudo-F value and random distribution estimated after 10,000 permutations.
Supplementary Figure S1
Sh an n o n in d ex Sequencing depth P h ylo gene tic D ive rsity in d ex Sequencing depth A. B.Bray-Curtis Jaccard Weighted Unifrac A1) A2) B1) B2) C1) C2)
Supplementary figure S2
2133 (59%) 2263 (46%) 602 (17%) 504 (15%) 673 (18%) 1422 (29%) 2027 (56%) 1925 (58%) 837 (23%) 1286 (26%) 1007 (28%) 902 (27%)
P. toxostoma
caudal fin
gills
midgut
hindgut
C. nasus
Supplementary figure S3
0% 20% 40% 60% 80% 100% 0% 20% 40% 60% 80% 100% 0% 20% 40% 60% 80% 100% 0% 20% 40% 60% 80% 100% Actinobacteria Bacteroidetes CKC4
Cyanobacteria Deinococcus-Thermus Firmicutes
Fusobacteria Planctomycetes Proteobacteria
Verrucomicrobia unclassified Others
Supplementary figure S4
A)
B)
C)
Df SS F P value Df SS F P value Bray-Curtis 3 0.573 22.36 <0.001 3 0.018 0.18 0.918 Jaccard 3 0.103 17.402 <0.001 3 0.011 0.432 0.766 unweighted Unifrac 3 0.096 15.348 <0.001 3 0.002 0.066 0.987 weighted Unifrac 3 0.225 21.18 <0.001 3 0.009 0.181 0.914
comparison mean diff p value mean diff p value mean diff p value mean diff p value gills-caudale 0.006 0.854 <0.001 0.978 0.014 0.290 0.070 0.038 hindgut-caudale -0.258 <0.001 -0.110 0.001 -0.102 0.001 -0.127 0.001 midgut-caudale -0.288 <0.001 -0.124 0.001 -0.110 0.003 -0.135 0.001 hindgut-gills -0.265 <0.001 -0.111 0.001 -0.116 0.001 -0.196 <0.001 midgut-gills -0.294 0.001 -0.124 0.001 -0.124 0.002 -0.205 <0.001 midgut-hindgut -0.030 0.625 -0.014 0.692 -0.007 0.816 -0.009 0.782 Parachondrostoma toxostoma
comparison pseudo-F p pseudo-F p pseudo-F p pseudo-F p pseudo-F p pseudo-F p pseudo-F p pseudo-F p caudal-gills 3.13 0.001 1.629 0.007 2.065 0.003 7.141 <0.001 2.442 0.001 1.533 0.004 1.647 0.022 2.354 <0.001 caudal-midgut 5.965 <0.001 3.452 0.001 4.359 0.001 12.05 <0.001 7.782 <0.001 2.965 <0.001 3.682 0.001 7.84 <0.001 caudal-hindgut 5.516 0.001 3.182 0.001 4.11 0.001 10.822 0.001 7.522 <0.001 2.72 <0.001 3.664 <0.001 7.535 <0.001 gills-midgut 6.041 0.003 2.527 0.005 3.124 0.005 5.982 0.002 3.817 0.001 2.189 0.001 2.747 <0.001 5.201 0.002 gills-hinddgut 5.733 0.004 2.362 0.009 2.918 0.007 6.211 0.003 3.985 0.001 1.99 0.001 2.782 <0.001 5.077 0.002 midgut-hindgut 1.045 0.364 0.903 0.763 0.89 0.672 1.603 0.058 0.6 0.811 0.829 0.689 0.797 0.641 0.502 0.753 C. toxostoma C. nasus
caudal fin 4.279 <0.001 2.005 <0.001 2.51 <0.001 4.971 <0.001 gills 3.581 0.002 1.96 0.003 2.269 0.009 4.312 0.002 midgut 8.003 <0.001 2.444 <0.001 2.622 0.001 7.201 <0.001 hindgut 8.342 <0.001 2.451 0.001 2.976 0.001 9.735 <0.001
C. toxostoma vs. C. nasus
Comparison Phylum FDR adjusted p value Phylum FDR adjusted p value
gills caudal fin gills caudal fin Chloroflexi <0.01 0.36% 2.09% Actinobacteria <0.01 1.03% 4.51% Firmicutes <0.01 0.26% 2.61% Deinococcus-Thermus 0.01 0.03% 8.62% Deinococcus-Thermus <0.01 0% 0.82% Chloroflexi 0.04 0.44% 1.46% Actinobacteria <0.01 0.52% 8.01% Bacteroidetes 0.04 7.87% 20.24% unclassified 0.04 23.59% 2.32% Acidobacteria 0.04 0.47% 1.83%
midgut caudal fin midgut caudal fin Proteobacteria <0.01 65.96% 45.1% Gracilibacteria <0.01 <0.01% 0.07% Bacteroidetes <0.01 1.99% 20.24% Deinococcus-Thermus <0.01 0% 8.62% Cyanobacteria <0.01 3.18% 1.36% Firmicutes <0.01 0.53% 5.5% Chloroflexi 0.01 1.02% 2.09% Spirochaetae <0.01 0% 0.76% Chlamydiae 0.01 0.01% 0% Armatimonadetes 0.01 0% 0.13% Actinobacteria 0.01 1.01% 8.01% CKC4 0.01 17.45% 0.2% Firmicutes 0.01 0.39% 2.61% Fusobacteria 0.01 3.39% 0.2% Actinobacteria 0.02 1.22% 4.51% Lentisphaerae 0.02 0.03% 0.29% Bacteroidetes 0.02 7.87% 15.15% Candidate_division_SR1 0.02 <0.01% 0.04% Nitrospirae 0.02 0% 0.07% Parcubacteria 0.02 <0.01% 0.09% Gemmatimonadetes 0.03 0.01% 0.07% hindgut caudal fin hindgut caudal Cyanobacteria <0.01 4.84% 1.36% CKC4 <0.01 13.85% 0.2% Chlamydiae <0.01 0.01% 0% Deinococcus-Thermus <0.01 0.01% 8.62% Proteobacteria <0.01 59.97% 45.1% Gracilibacteria <0.01 0% 0.07% Bacteroidetes <0.01 4.21% 20.24% Spirochaetae <0.01 <0.01% 0.76% Actinobacteria 0.01 1.29% 8.01% unclassified <0.01 0.24% 1.77% Planctomycetes 0.02 12.48% 5.32% Firmicutes <0.01 0.49% 5.5% Fusobacteria <0.01 9.33% 0.2% Actinobacteria 0.01 1.02% 4.51% Armatimonadetes 0.01 0% 0.13% Parcubacteria 0.01 0% 0.09% Lentisphaerae 0.01 0.01% 0.29% Gemmatimonadetes 0.02 <0.01% 0.07% Nitrospirae 0.04 <0.01% 0.07%
gills midgut gills midgut
Chlamydiae 0.05 0% 0.01% Spirochaetae 0.01 0.42% 0% Bacteroidetes 0.05 7.87% 1.99% Gracilibacteria 0.02 0.12% <0.01% Acidobacteria 0.05 0.47% 1.51% Parcubacteria 0.02 0.17% <0.01% Chloroflexi 0.05 0.36% 1.02% CKC4 0.03 0.86% 17.45% Acidobacteria 0.03 1.21% 0.23% Candidate_division_SR1 0.04 0.12% <0.01% Firmicutes 0.04 2.46% 0.53% Gemmatimonadetes 0.04 0.11% 0.01% Fusobacteria 0.05 0.49% 3.39% Nitrospirae 0.05 0.22% 0%
gills hindgut gills hindgut
Chloroflexi <0.01 0.36% 1.57% Gracilibacteria <0.01 0.12% 0% Chlamydiae <0.01 0% 0.01% Spirochaetae <0.01 0.42% 0% Planctomycetes 0.04 4.06% 12.48% unclassified 0.01 3.91% 0.24% Acidobacteria 0.04 0.47% 1.57% CKC4 0.01 0.86% 13.85% Firmicutes 0.04 0.26% 0.81% Fusobacteria 0.01 0.49% 9.33% Parcubacteria 0.01 0.17% 0% Firmicutes 0.02 2.46% 0.49% Gemmatimonadetes 0.05 0.11% 0% Acidobacteria 0.05 1.21% 0.24% caudal fin vs hindgut gills vs midgut gills vs hindgut P. toxostoma C. nasus
mean groups mean groups
caudal fin vs gills caudal fin vs midgut
Phylum FDR adjusted p value mean P. toxostoma mean C. nasus Spirochaetae 0.01 0.02% 0.42% Gracilibacteria 0.01 <0.01% 0.12% Firmicutes 0.01 0.26% 2.46% Parcubacteria 0.01 <0.01% 0.17% CKC4 0.02 0.02% 0.86% Tenericutes 0.03 <0.01% 0.03% Candidate_division_SR1 0.05 0% 0.12% Acidobacteria <0.01 1.51% 0.23% Nitrospirae <0.01 0.05% 0% Gemmatimonadetes 0.02 0.04% 0.01% Lentisphaerae 0.02 0.11% 0.03% Bacteroidetes 0.03 1.99% 7.87% CKC4 0.03 0.07% 17.45% Planctomycetes 0.03 9.81% 3.95% Planctomycetes 0.01 12.48% 2.66% Nitrospirae 0.01 0.06% <0.01% Gemmatimonadetes 0.01 0.06% <0.01% Acidobacteria 0.01 1.57% 0.24% Lentisphaerae 0.01 0.13% 0.01% unclassified 0.01 1.75% 0.24% Cyanobacteria 0.02 4.84% 1.42% Fusobacteria 0.03 0.34% 9.33% Elusimicrobia 0.03 0.02% 0% CKC4 0.03 0.08% 13.85% Gills Midgut Hindgut