HAL Id: hal-02622165
https://hal.inrae.fr/hal-02622165
Submitted on 26 May 2020
HAL is a multi-disciplinary open access archive for the deposit and dissemination of sci-entific research documents, whether they are pub-lished or not. The documents may come from teaching and research institutions in France or abroad, or from public or private research centers.
L’archive ouverte pluridisciplinaire HAL, est destinée au dépôt et à la diffusion de documents scientifiques de niveau recherche, publiés ou non, émanant des établissements d’enseignement et de recherche français ou étrangers, des laboratoires publics ou privés.
modulates cell roughness and membrane permeability:
An atomic force microscopy study
Elizabeth R. Cattaneo, Eduardo Prieto, Maria B. Garcia-Fabiani, Mauro A.
Montanaro, Hervé Guillou, Maria R. Gonzalez-Baro
To cite this version:
Elizabeth R. Cattaneo, Eduardo Prieto, Maria B. Garcia-Fabiani, Mauro A. Montanaro, Hervé Guil-lou, et al.. Glycerol-3-phosphate acyltransferase 2 expression modulates cell roughness and membrane permeability: An atomic force microscopy study. PLoS ONE, Public Library of Science, 2017, 12 (12), 18 p. �10.1371/journal.pone.0189031�. �hal-02622165�
Glycerol-3-phosphate acyltransferase 2
expression modulates cell roughness and
membrane permeability: An atomic force
microscopy study
Elizabeth R. Cattaneo1, Eduardo D. Prieto2, Maria B. Garcia-Fabiani1, Mauro A. Montanaro1, Herve Guillou3, Maria R. Gonzalez-Baro1
*
1 Instituto de Investigaciones Bioquı´micas de La Plata Rodolfo R. Brenner, Consejo Nacional de
Investigaciones Cientı´ficas y Te´cnicas, Facultad de Ciencias Me´dicas, Universidad Nacional de La Plata, La Plata, Buenos Aires, Argentina, 2 Instituto de Investigaciones Fisicoquı´micas Teo´ricas y Aplicadas (INIFTA), La Plata, Buenos Aires, Argentina, 3 Toxalim, Universite´ de Toulouse, INRA, ENVT, INP-Purpan, UPS, Toulouse, France
Abstract
In mammalian cells, de novo glycerolipid synthesis begins with the acylation of glycerol-3-phosphate, catalyzed by glycerol-3-phosphate acyltransferases (GPAT). GPAT2 is a mitochondrial isoform primarily expressed in testis under physiological conditions, and overexpressed in several types of cancers and cancer-derived human cell lines where its expression contributes to the tumor phenotype. Using gene silencing and atomic force microscopy, we studied the correlation between GPAT2 expression and cell surface topography, roughness and membrane permeability in MDA-MB-231 cells. In addition, we analyzed the glycerolipid composition by gas-liquid chromatography. GPAT2 expres-sion altered the arachidonic acid content in glycerolipids, and the lack of GPAT2 seems to be partially compensated by the overexpression of another arachidonic-acid-metabo-lizing enzyme, AGPAT11. GPAT2 expressing cells exhibited a rougher topography and less membrane damage than GPAT2 silenced cells. Pore-like structures were present only in GPAT2 subexpressing cells, correlating with higher membrane damage evidenced by lactate dehydrogenase release. These GPAT2-induced changes are consistent with its proposed function as a tumor-promoting gene, and might be used as a phenotypic dif-ferentiation marker. AFM provides the basis for the identification and quantification of those changes, and demonstrates the utility of this technique in the study of cancer cell biology.
Introduction
Glycerol-3-phosphate acyltransferase (GPAT) catalyzes the first and committed step in thede novo glycerolipid synthesis pathway, which is the synthesis of lysophosphatidic acid (LPA) via
a1111111111 a1111111111 a1111111111 a1111111111 a1111111111 OPEN ACCESS
Citation: Cattaneo ER, Prieto ED, Garcia-Fabiani
MB, Montanaro MA, Guillou H, Gonzalez-Baro MR (2017) Glycerol-3-phosphate acyltransferase 2 expression modulates cell roughness and membrane permeability: An atomic force microscopy study. PLoS ONE 12(12): e0189031.
https://doi.org/10.1371/journal.pone.0189031 Editor: Etienne Dague, LAAS-CNRS, FRANCE Received: June 28, 2017
Accepted: October 19, 2017 Published: December 6, 2017
Copyright:© 2017 Cattaneo et al. This is an open access article distributed under the terms of the
Creative Commons Attribution License, which permits unrestricted use, distribution, and reproduction in any medium, provided the original author and source are credited.
Data Availability Statement: All relevant data are
within the paper.
Funding: This work was supported by Agencia
Nacional de Promocion Cientifica y Tecnologica, Argentina- PICT2014-3214 (MRGB),http://www. agencia.mincyt.gob.ar/frontend/agencia/ convocatoria/304; Consejo Nacional de Investigaciones Cientificas y Tecnicas, Argentina. PIP20013-0310 (MRGB),http://proyectosinv. conicet.gov.ar/; Universidad Nacional de La Plata M202 (MRGB),http://secyt.presi.unlp.edu.ar/
the acylation of glycerol 3-phosphate by a long-chain fatty acyl-CoA substrate. Then, 1-acylgly-cerol-3-phosphate acyltransferase (AGPAT) uses LPA to form phosphatidic acid, the precursor for both triacylglycerol (TAG) and glycerophospholipid (PL) biosynthesis. In mammals, four GPAT isoforms (GPAT1–GPAT4) have been described which differ in their subcellular loca-tions, tissue expression pattern, substrate preference, transcriptional regulation and sensitivity to sulfhydryl group reagents such asN-ethylmaleimide [1].
In physiological conditions, GPAT2 isoform resides in the outer mitochondrial membrane of primary spermatocytes and it is differentially expressed in the testis during sexual develop-ment [2,3]. GPAT2’s preferred substrate is arachidonoyl-CoA and this fatty acid (FA) is used to synthesize TAGde novo [2]. Because high levels of arachidonic acid (Δ5,8,11,14 eicosatetrae-noic acid, 20:4ω-6, AA) induce apoptosis [4–6], and metabolic pathways that diminish the content of unesterified AA can prevent apoptosis [7], enhanced GPAT2 activity may allow spermatogenic cells to sequester AA into TAG, a function that may be related to cell survival and proliferation [2,3].
In pathological conditions, we have reported that human GPAT2 is overexpressed in sev-eral types of cancers and cancer-derived human cell lines, and that its expression contributes to the tumor phenotype. In this regard, tumor cells with diminished GPAT2 expression had lower rates of cellular proliferation and migration and lower tumorigenicity in mouse xeno-graft models. In addition, we have shown thatGPAT2 belongs to a group of genes termed
‘cancer-testis genes’ (CTs) [8]. Proteins encoded by CTs are expressed in spermatogenic cells, whereas in somatic tissues their expression is either low or null. CTs are ectopically overex-pressed in cancers of different origins where they may contribute to the tumor phenotype [9,10].
Cancer cells differ from normal cells in morphology, cell growth and migration rate, cell– cell interaction, cytoskeleton organization, and interactions with the extracellular matrix. Atomic force microscopy (AFM) is capable of detecting most of these changes [11]. AFM is used to scan surfaces at the nanometer (molecular) resolution scale, and it has emerged as a powerful tool to study the morphological and biomechanical properties of biological samples, including biomolecules and cells. This technique is appropriate for directly studying biological materials in buffer solutions or in fixed conditions. It allows sample observation in non-vacu-ous environments, without the need for coating, staining or freezing the material, and the resolution is similar to electron microscopy [12,13]. During the last few years, AFM has been increasingly used in biomedical research. It has been applied for the nanomechanical study of live cancer cells isolated from human metastatic fluids [14,15] and breast cancer tissue sections from different histological grades [16].
In this work, we used AFM to evaluate the phenotypic consequence ofGPAT2 expression
in cancer cells, and to correlate humanGPAT2 expression with the cellular processes that
exac-erbate the tumoral phenotype in a breast cancer cell model.
Materials and methods
All chemicals were purchased from Sigma unless otherwise indicated.
Cell line and culture conditions
Human breast adenocarcinoma MDA-MB-231 cells were purchased from the American Type Culture Collection (ATCC, Manassas, VA, USA). Cells were routinely cultured in Dulbecco’s modified Eagle’s medium (DMEM, Gibco) supplemented with 10% FBS (Natocor, Argentina), 100 U/ml penicillin, 100μg/ml streptomycin and 2 mM glutamine. Cells were grown at 37˚C
Wordpress/?p=5090. The funders had no role in study design, data collection and analysis, decision to publish, or preparation of the manuscript.
Competing interests: The authors have declared
that no competing interests exist.
Abbreviations: AA, arachidonic acid; AFM, atomic
force microscopy; AGPAT, 1-acylglycerol-3-phosphate acyltransferase; CT, cancer-testis gene; FA, fatty acid; GLC, gas liquid chromatography; GPAT, glycerol-3-phosphate acyltransferase; LDH, Lactate dehydrogenase; LPA, lysophosphatidic acid; MBOAT, membrane bound O-acyltransferase; PL, glycerophospholipid; qRT-PCR, quantitative real-time PCR; scr-MDA, MDA-MB-231 that express GPAT2; sh-MDA, MDA-MB-231 cells with reduced GPAT2 expression; TAG, triacylglycerol; TLC, thin layer chromatography.
in a 5% CO2atmosphere with 98% relative humidity. We chose the MDA-MB-231 cells
because of its highGPAT2 expression.
MDA-MB-231 GPAT2 silencing
Cell lines stably expressing a small-hairpin RNA targetingGPAT2 mRNA (shRNA-GPAT2) or
a non-silencing scrambled RNA (shRNA-scr) were developed in our laboratory from commer-cial MDA-MB-231 cells, as previously reported [8] to generate sh-MDA (reducedGPAT2
expression) and scr-MDA (retainingGPAT2 expression) cell lines. GPAT2 knockdown was
routinely assessed by quantitative real-time PCR (qRT-PCR) [8] and Western blot.
Quantitative real-time PCR
Total RNA was isolated from cell lines using TRIZOL (Life Technologies) following the manu-facturer’s instructions, and RNA quality was determined by gel electrophoresis and 260/230 and 260/280 nm absorbance ratios. Oneμg RNA was used for cDNA synthesis employing iScript cDNA synthesis Kit (Bio-Rad). A 1:10 cDNA dilution was used for the qRT-PCR reac-tion with iTaq Universal Sybr Green Super Mix (Bio-Rad). Primers were designed to amplify:
Human GPAT2
forward primer: AAG CTG GTG TGA GGT GAG AG reverse primer: ATA CTT CCC CAG GAA TGG AG
AGPAT11/LPCAT2
forward primer: ATA GCC CAA GGG GAC TCA AT reverse primer: GAA AAC ACA TGG CAC GTC TG
MBOAT5/LPCAT3
forward primer: GCG GCT GAT CAT CTC CAT CTT reverse primer: TGG TAG AGC TGG TTT CCA AAG
MBOAT7/LPIAT1
forward primer: CTC AGC TCT CCG TTC TCG AC reverse primer: GAA CAG ACG GGC TCT GGA AA
The thermal profile was 95˚C for 1 min, followed by 45 cycles of 95˚C for 20 s, 57˚C for 50 s and 60˚C for 30 s, on a Stratagene Mx3000P apparatus. RNA expression was quantified in trip-licate using theΔΔCt method, and normalized to that of TBP housekeeping gene using Qbase software.
Immunoblotting
One-hundredμg of total protein from cells was separated on 10% SDS-PAGE, transferred to a polyvinylidene difluoride membrane (BioRad) and probed with 1/1000 anti-GPAT2 antibody (Sigma HPA036841). Anti-β-actin antibody (Abcam ab8227) at a dilution 1:2500 was used as a gel-loading control. Membranes were then washed extensively and probed with horseradish peroxidase-conjugated goat anti- rabbit or anti- mouse IgG antibody (Thermo-Pierce). For chemiluminescent detection, the membranes were incubated with Super Signal detection kit (Thermo-Pierce).
Lipid and fatty acid analysis
scr-MDA and sh-MDA cells were grown in 100 mm plates in routine medium or in routine medium supplemented with 50μM AA as the sodium salt (Sigma) for 72 h. Cells were then washed 3 times with 0.1% BSA in ice-cold PBS, and scraped in ice-cold methanol and H2O.
hexane-ethylether-acetic acid (80:20:1; v/v/v) as the mobile phase for neutral lipid separation. All samples were chromatographed in parallel with pure lipid standards. To analyze the FA composition, total PL and TAG fractions were scraped from the plate and eluted with hexane: chloroform: methanol (3:2:1, v/v/v). FA methyl esters were obtained by reaction with BF3in
methanol and analyzed by gas liquid chromatography in a Hewlett-Packard HP 6890 chro-matograph equipped with an Omega Wax capillary column [2].
Optical and fluorescence microscopy
Live cell images were captured with an inverted microscope (Olympus, IX71) equipped with a fluorescent lamp and a digital camera (Olympus) under 200-x magnification.
Atomic force microscopy
For Atomic force microscopy (AFM) measurements, scr-MDA (control) and sh-MDA (GPAT2 silenced) cells were plated on glass coverslips and grown in routine medium without
the addition of AA for 1−2 days until 80% confluent. Then, the cells were fixed using an etha-nol dehydration train at room temperature and subsequently air dried [18]. Fixation is neces-sary because high-resolution images of cells are poorly achieved in solution, and the enhanced AFM resolution obtained with fixed cells allows a more detailed subcellular analysis [12].
AFM images were obtained in air, using a MultiMode Scanning Probe Microscope (Veeco) equipped with a Nanoscope V controller (Veeco). All measurements were obtained immedi-ately after fixation with Tapping1mode, using probes doped with silicon nitride (RTESP, Veeco with tip nominal radius of 8–12 nm, 271–311 kHz, force constant 20–80 N/m). Typical scan rates were 0.5 Hz.
The analysis was first performed on a large area (50μm2) with a single cell, and later by heading the cantilever to the cell surface to obtain images of 30μm2, 15μm2, and 10μm2. The same procedure was repeated in six different cells (three cells each time in two indepen-dent AFM measurements), with three different AFM acquisition modes: height, phase, and amplitude.
Roughness analysis
The effect ofGPAT2 silencing on membrane roughness of MDA-MB-231 cells was determined
using AFM and taking into consideration the Ra and Rq values as quantitative parameters. The parameter Ra is the arithmetic mean of the deviations in height from the roughness mean value, and Rq is the root mean square of the height distribution. In the current bibliography, the minimum number of cells necessary to perform roughness studies is not standardized. Thus, some authors analyze three [19], four [16] or more cells. Here, for the analysis, six differ-ent cells from each group were examined and four differdiffer-ent areas from each cell were used to calculate the Ra and Rq. The selected areas were 5 x 5μm2. They were above the cytoplasmic region, and outside of the pore zone for sh-MDA cells, on images of 15 x 15μm2. AFM image and data analysis was performed using the Nanoscope 7.30 and Nanoscope Analys 1.5 software package.
Lactate dehydrogenase activity
To evaluate plasma membrane integrity, cells were grown in a 48-well microplate, and a com-mercial kit by the decrease of OD at 340 nm (Wiener lab) was used to measure the release of the cytoplasmic enzyme lactate dehydrogenase (LDH).
Statistical analysis
Differences between the control and silenced cells were analyzed by Student’s t-test or ANO-VA-Tukey test. Results were considered significant at the 5% level. Statistical comparisons were performed with InStat3 software.
Results and discussion
MDA-MB-231 cells compensate for the lack of GPAT2 by
overexpressing the acyltransferase AGPAT11
We used RNA interference to knock-downGPAT2 expression in MDA-MB-231 cells and
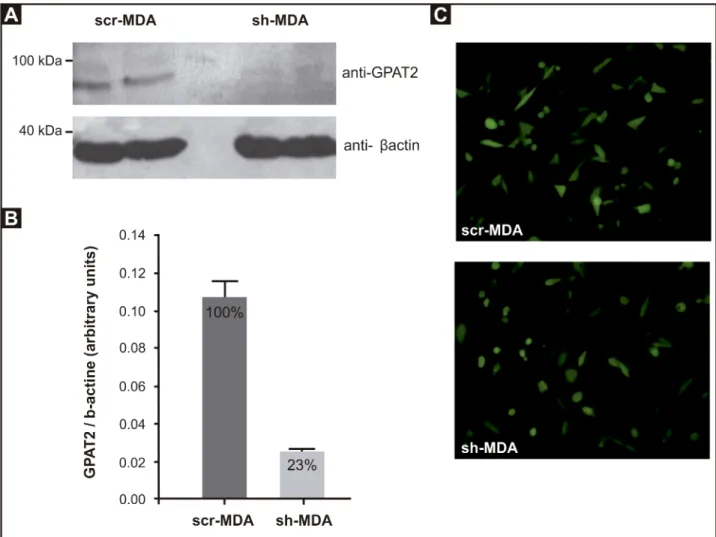
obtained 2 stable cell lines: sh-MDA and its control, scr-MDA. Compared to scr-MDA cells, a 95% down-regulation ofGPAT2 mRNA was obtained in sh-MDA cells [8]. In this work, the GPAT2 knockdown was confirmed by Western blot, using an antibody against GPAT2 (Fig 1A and 1B).
Previously, we reported that GPAT2 specifically uses AA as a substrate [2]. For the present study, our aim was to determine the role of the human GPAT2 isoform in glycerolipid metabo-lism and plasma membrane functionality in a cancer cell model.
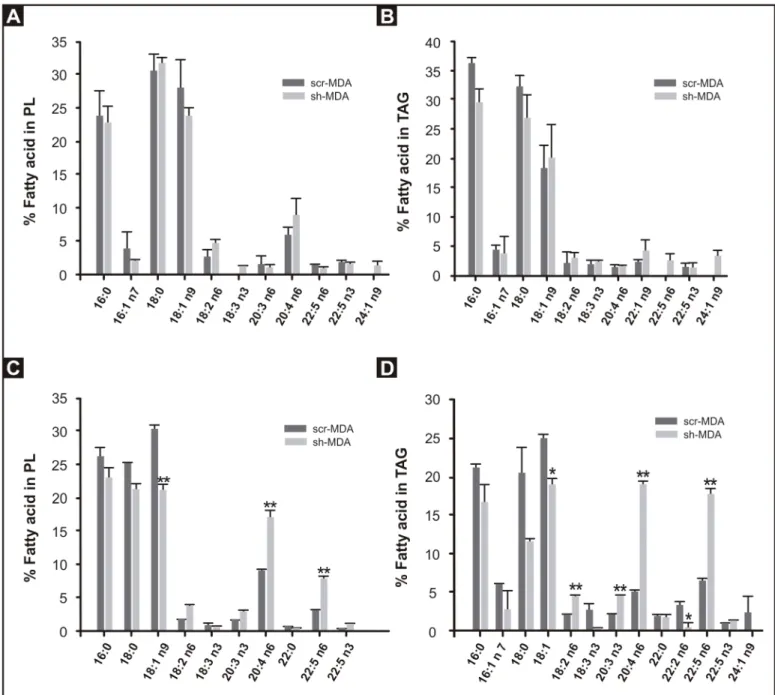
To do this, we isolated the PL and TAG fractions from scr-MDA and sh-MDA cells grown in routine medium and analyzed the FA compositions (Fig 2A and 2B). Surprisingly, no signif-icant differences were observed in the AA content of TAG and PL in either cell line. Because the concentration of AA in the media was low and to expose the cells to a higher amount of AA, we analyzed the FA composition of PL and TAG fractions of cells, grown for 3 days in DMEM plus 50μM AA (Fig 2C and 2D). We chose this AA concentration because incubation of MDA-MB-231 cells with 200μM AA for 72 h does not affect cell viability [20], but sh-MDA cells were more vulnerable and died when exposed to 100μM AA. In the presence of 50 μM AA for 3 days, sh-MDA cells incorporated more than twice as much AA than scr-MDA cells in both PL (17.2 vs 8.9%; p< 0.01) and TAG (19.0 vs 5.1%; p< 0.01). The 22:5n6 product of AA was similarly increased in glycerolipids in the supplemented cells.
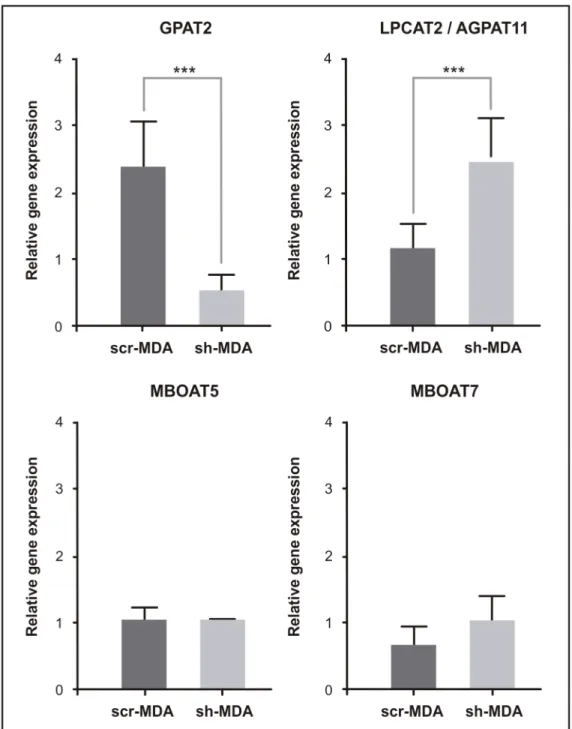
AA is an essential FA that is obtained directly from the diet, or indirectly synthesized from linoleic acid. AA plays important roles in cell metabolism. The bulk of AA in mammalian cells is rapidly incorporated into cell membrane phospholipids. In addition to its use as a substrate for glycerolipid synthesis, free AA may exert signaling functions as an inducer of apoptosis or as an eicosanoid precursor. Because eicosanoids exert potent biological actions, cells keep AA at very low levels by promoting their esterification into cell lipids [21]. Taking into account the biologi-cal importance of AA, we suspected that to compensate the lack of GPAT2, sh-MDA cells might overexpress other enzymes capable of incorporating AA into glycerolipids. To test this hypothe-sis we measured the expression of other three enzymes involved in the glycerolipid metabolism: AGPAT11/LPCAT2, MBOAT5/LPCAT3 and MBOAT7/LPIAT1. These three enzymes are able to use arachidonoyl-CoA as a substrate [21–24]. 1-acyl-glycerol-3-phosphateO-acyltransferase
(AGPAT) and membrane boundO-acyltransferase (MBOAT) are two families of lipid
acyltrans-ferases. The MBOAT family is comprised of members specifically involved in the Lands cycle of phospholipid FA remodeling, whereas members of the AGPAT family are typically involved in the pathwayof de novo glycerolipid biosynthesis. qRT-PCR analysis showed that compared to
scr-MDA cells,AGPAT11 expression in sh-MDA cells was 2-fold higher. The expression levels
ofMBOAT5 and MBOAT7 were equivalent in both cell lines (Fig 3).
GPAT2 specifically uses AA as a substrate [2], andGPAT2 silencing increased the
expres-sion of another glycerolipid biosynthetic enzyme that prefers AA, AGPAT11 (Fig 3). AGPAT11 uses arachidonoyl-CoA as a substrate for both its
1-acylglycerol-3-phosphate-O-acyltransferase and lysophosphatidylcholine 1-acylglycerol-3-phosphate-O-acyltransferase activities [24]. Because GPAT iso-forms catalyze the first and rate-limiting step inde novo glycerolipid biosynthesis, we propose
that AGPAT11 overexpression compensated for the decrease of GPAT2 and may be partially responsible for the higher AA content of the glycerolipids after GPAT2 silencing. AA incorpo-ration into glycerolipids depends on its concentincorpo-ration (high or low affinity pathways), the cell type, and the activity of many different enzymes [21], so we cannot exclude the possibility that other enzymes may be also be important in determining the overall composition of the cell gly-cerolipids in both culture conditions.
Cells with deficient GPAT2 exhibit smoother topography and pore-like
structures
The plasma membrane is involved in several cellular functions, including proliferation, signal transduction, motility, and differentiation. BecauseGPAT2 silencing alters cell proliferation
Fig 1. GPAT2 knock-down in MDA-MB-231 cells. MDA-MB-231 cells were silenced for human GPAT2 with HuSH-29 plasmid coding for a
shRNA against human GPAT2 mRNA (sh-MDA). A non-effective scrambled sequence shRNA plasmid was used to create a negative control (scr-MDA). A) Protein expression was measured by Western blot. Total cell lysate (100μg protein) from scr-MDA and sh-MDA cells was probed with anti-GPAT2 antibody and with anti-β-actin antibody as a loading control. B) Protein band intensities were quantified with the ImageJ program. Results are representative of three independent experiments (**p<0.01). C) Fluorescence image showing GFP expression in scr-MDA and sh-MDA at 200x magnification confirm that cells were transfected.
and migration [8], we decided to study the topography and plasma membrane functionality in our cell model. For this, we used AFM technique. AFM provides a tri-dimensional mapping of the cell surface, resulting in the generation of true topographic data with vertical resolution into the subnanometer range. To minimize the tip impact onto the cell surface we used a dynamic or intermittent contact mode, commonly known as Tapping mode. Tapping mode is characterized for the rapid up-and-down oscillation of the tip, which slowly scans the sample laterally and touches the surface for very short periods of time [13]. Because AFM images may be affected by the geometrical shape of the probe [25,26], and to minimize the artifacts in cell
Fig 2. Fatty acid composition of scr-MDA and sh-MDA cell PL and TAG. Total lipids were extracted from scr-MDA and sh-MDA cells, separated by
TLC, and fatty acid composition of the PL and TAG fractions was determined by GLC. A and B) Cells grown in DMEM 10% FBS. C and D) Cells grown in DMEM 10% FBS plus 50μM of AA for 3 days. Values represent the mean±SD of 3 independent experiments (*p<0.05,**p<0.01).
imaging and mechanical measurements, conventional AFM pyramidal tips are routinely used [27]; so we used pyramidal tips for all our measurements.
Since AFM is a novel tool to observe biological samples, one of its difficulties is the lack of optimized protocols, mainly for the pre-analytical phase of sample preparation, which makes it difficult to compare results between laboratories. In this sense, it have been reported that the
Fig 3. mRNA expression of acyltransferases involved in arachidonic acid metabolism. Total RNA from
scr-MDA and sh-MDA cells was extracted, subjected to cDNA synthesis, and amplified by qRT-PCR with primers for human GPAT2, AGPAT11, MBOAT5 and MBOAT7 genes and normalizing expression levels to that of TATA-Box binding protein (TBP) housekeeping gene (***p<0.001. ANOVA-Tukey test).
measurements of roughness and viscoelasticity, as well as the cell morphology, are affected depending on the fixation method, suggesting the necessity of an standard fixation method, applicable to various cell types [28,29]. Also, the fixation procedure may introduce artifacts such as cell debris, crystals (commonly derived from the washing buffer, PBS) or depressions [30]. In addition, for many of the commercially available cell lines there are no previous data of AFM topography studies. Fortunately, the structure of MDA-MB-231 cells has previously been elucidated using AFM [31], so we decided to use the same fixation conditions. This fixa-tion method preserves the epithelial morphology of MDA-MB-231 cells, and during the acqui-sition of our images, we did not detect any of the most common fixation artifacts reported in the bibliography [30].
Surface nanostructure imaging (Cell topography). To determine the phenotypic
differ-ences betweenGPAT2 expressing and silenced cells we analyzed two types of images from
AFM: topography and amplitude images (Fig 4). Topography images show the contour heights, while amplitude images show how the tip deflected as it encountered simple topography.
Direct comparison of scr-MDA and sh-MDA cells (Fig 4C and 4D(scr-MDA) andFig 4I and 4J(sh-MDA)) revealed marked differences in surface morphology at micro- and nano-scale. The most notable was the presence of pore-like structures in the sh-MDA cells (white arrow,Fig 4I and 4J).
Comparing optical microscopy (Fig 4F and 4L) with AFM (Fig 4A and 4G) images, we observe that the fixed cell morphology is consistent with that of live cells.
Cell surface imaging was earlier considered as an important biological application of the scanning probe microscopy and, more particularly, of the AFM. Thus, these observations dem-onstrate the uniqueness of AFM for detecting micro- to nanoscale differences for the morpho-logical characterization of mammalian cell surfaces.
Roughness. The topography images also provided information about the details of the cell
surface structure and its smoothness or roughness. Because roughness value depends on the size of the sampling field, we analyzed all images in areas of a fixed size of 5× 5 μm2[23], above the cytoplasmic region, on topography images of 15 x 15μm2
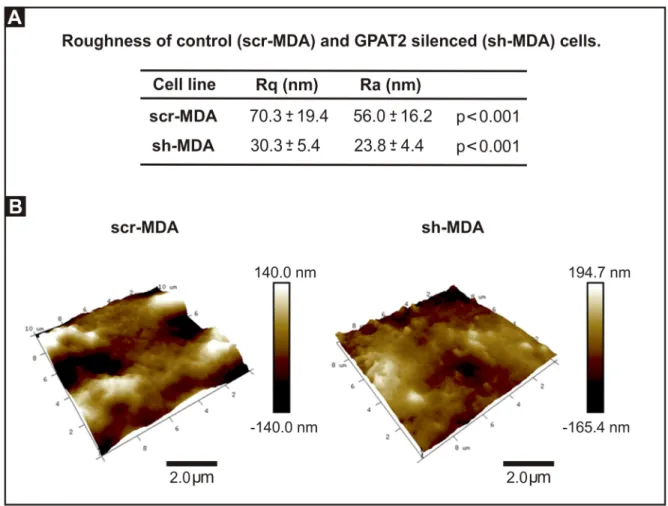
; and we determine that Ra and Rq, measures of surface roughness, both decreased significantly in sh-MDA cells. Com-paring the Rq values,GPAT2 silencing decreased roughness by 57% (Fig 5). To discard the possibility that the difference in roughness was due to the fixation method we repeated the roughness analysis using cells fixed for 15 minutes with 2.5% paraformaldehyde in PBS and we obtained equivalent results (GPAT2 silencing decreased Rq by 36%).
Surface roughness analysis demonstrated measurable differences betweenGPAT2-silenced
and control cells, providing novel quantifiable data of cellular changes related toGPAT2
expression at the cell surface level.
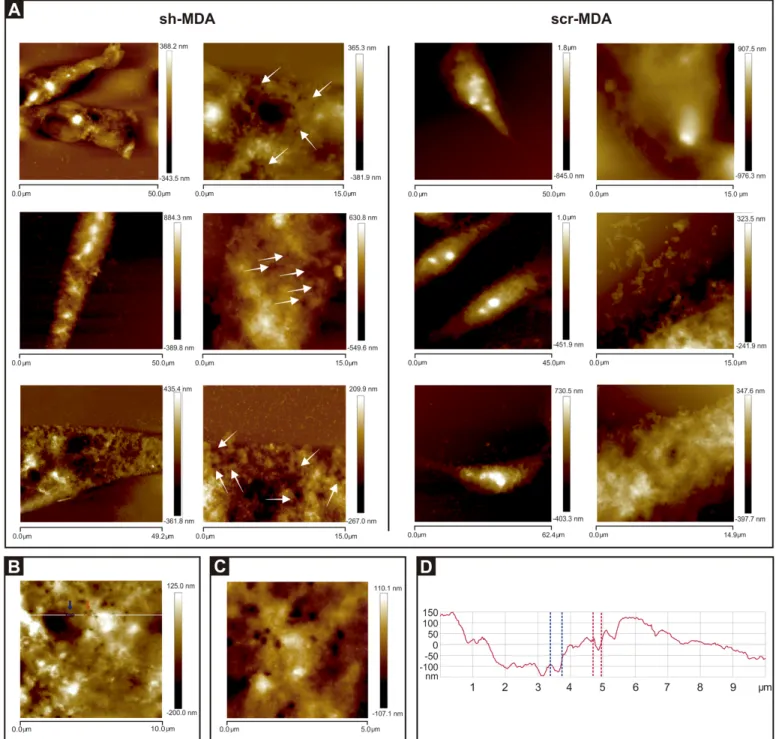
Membrane integrity. High-resolution AFM imaging revealed membrane damage,
visual-ized as pore-like structures randomly distributed on the surface of sh-MDA cells (white arrows
Fig 6A). The amount of pore-like structures observed in sh-MDA cells was 0.56± 0.11 pore-like structures/μm2
. We performed the section analysis of our images of sh-MDA cells and the average pore size diameter was 270.4± 52.1 nm (n = 21). In none of the scr-MDA images (Fig 6A) pore-like structures were observed.
AFM has been used to study pore formation in other biological systems [19,32,33]. How-ever, AFM technique is a single-cell assay so; to validate this result and to analyze the biological outcome of the pore presence we quantified LDH activity in the cellular supernatants of both cell lines. sh-MDA released 3.6-fold more LDH to the medium than scr-MDA cells (Fig 7). LDH is a cytosolic enzyme, its presence in the culture medium indicates membrane damage and is associated with less healthy cells [34,35]. This result correlates with our previously reported diminished cell proliferation rate for sh-MDA cells [8].
Fig 4. Optical microscopy and AFM images of scr-MDA and sh-MDA cells. AFM images were obtained in tapping topography
(A-D for scr-MDA and G-J for sh-MDA) and amplitude modes (E for scr-MDA and K for sh-MDA). Fig 4A presents topographical parameters of a complete scr-MDA cell. Fig 4E presents amplitude image. Fig 4G presents topographical parameters of complete sh-MDA cell, and Fig 4K presents amplitude image. Parameters of the pictures are 50.0μm x 50.0μm (Fig 4A, E, G and K); 30.0μm x 30.0μm (Fig 4B and H); 15.0μm x 15.0μm (Fig 4C and I); 10.0μm x 10.0μm (Fig 4D and J). All images have a resolution of 512 x 512 pixels. The height of the cell is expressed in color scale (right bar). White arrows in Figs 4I and J indicate pore-like structures. Optical images (Fig 4F and L) have a magnification of 200x.
GPAT2 is a cancer-testis gene (http://www.cta.lncc.br/). CTs are normally expressed in germ line cells but they are also activated in a wide range of cancer types, where they usually encode antigens that are immunogenic and present a potential use as biomarkers and targets for immunotherapy. Most of the CTs’ functions have not been elucidated yet, however, it was recently reported that they may have a role in the regulation and progression of the cell cycle, the control of transcription, cell survival and apoptosis [36].
In a previous work, we showed thatGPAT2 expression increased cell proliferation and cell
migration rate, and resistance to staurosporine-induced apoptosis [8]. All these features are related to the normal plasma membrane functionality, and for this reason in this work we studied for the first time the topography and membrane properties of human breast cancer-derived cells that express GPAT2 (scr-MDA), and compared with cells with silenced GPAT2 (sh-MDA).
We chose the MDA-MB-231 because it is the cell line with the highestGPAT2 expression
[8], and we found that althoughGPAT2 silencing did not produce significant changes in total
lipid membrane composition, it modified parameters directly related to the plasma membrane functionality, such as roughness and permeability.
In part, this did not surprise us because it was previously reported that cell topography and mechanical properties can change without major alterations in total lipid composition, as occurs in HeLa cells at different stages of the cell cycle [37].
Fig 5. Cells sub-expressing GPAT2 exhibit smoother topography. A) Ra and Rq values of scr-MDA and sh-MDA cells. B) 3D
AFM topography images of scr-MDA and sh-MDA cells at 10.0μm x 10.0μm showing cell surface details.
Nevertheless, our observation that cells expressingGPAT2 exhibit a rougher topography
and do not have pore-like structures compared toGPAT2 silenced cells, directly implicate
GPAT2 in the regulation of these cell-surface characteristics.
Surface roughness is an established method for quantitative surface analysis. Cellular health can be strongly implied by plasma membrane roughness, and AFM-Rq analysis is useful for
Fig 6. Cells sub-expressing GPAT2 exhibit pore-like structures. A) Representative AFM images of three different sh-MDA and scr-MDA cells
revealed pore-like structures only on the surface of sh-MDA cells indicated with white arrows in 15.0μm x 15.0μm images. B and C) High-resolution 10.0μm x 10.0μm and 5.0μm x 5.0μm images, respectively, of one sh-MDA cell showing pore-like structures. D) Section analysis showing the size of two pores along the white line shown in the Fig 6B. The dashed red and blue lines define the diameter and depth of the pores indicated with red and blue arrows, respectively, in Fig 6B. Fig 6B is the section analysis of the cell shown inFig 4J.
determining the signaling molecule effect on cells [19], gene silencing or overexpression [16], and malignant transformation [11,38]. Several studies have shown that membrane roughness increments correlate with tumor phenotype exacerbation [11]. In particular, for breast cancer, it was observed that compared to benign breast MCF-10 cells, the cancerous cells MCF-7 exhibit a more disorganized filamentous cytoskeleton structure with rougher membranes [38]. In addition, in human breast cancer histological sections, surface roughness increases in accor-dance with cancer grade [16].
In this work, we found that control cells were 2.3-fold rougher thanGPAT2 silenced cells.
Thus, our roughness measurements agree with those previously reported and with our previ-ous results showing thatGPAT2 expression contributes to the tumor phenotype of
MDA-MB-231 cells [8].
Surface roughness has also been used as a tool for investigating cytoskeleton structure and integrity [39–41]. The cytoskeleton framework is a dynamic structure mainly composed of microfilaments, microtubules and intermediate filaments. The activities of many proteins are deregulated in cancerous cells, and that includes the proteins involved in the dynamic reorga-nization of the cytoskeleton, which alter cell motility, morphology, adhesion and invasion [16]. Since the underlying cytoskeleton framework governs the cellular morphology, several studies have shown that membrane roughness variations are induced by cytoskeleton alter-ations. Those alterations were observed in both cytoskeleton structural and remodeling
Fig 7. GPAT2 silencing disrupts membrane integrity. Cells were grown in a 48-well microplate and LDH
activity was determined in the cellular supernatants and in total cell lysates using a commercial colorimetric method. Results are expressed as the percentage of LDH activity in the supernatants for each cell line. Results are the means±SD of 3 independent experiments. (*p<0.05)
proteins [11,40–43], and in non-cytoskeletal-related proteins, such as SMAR 1 [16]. The tumor suppressor protein SMAR 1 expression alters the cellular cytoskeleton, decreasing the roughness of the cell membranes [16].
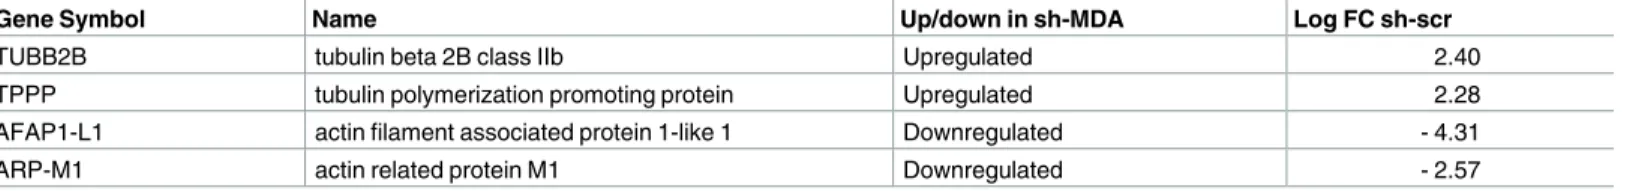
Like SMAR 1, GPAT2 is not directly related to cytoskeleton composition or remodeling. Then, to explain the cell roughness modifications associated with GPAT2 presence, we decided to study the expression of cytoskeleton and cytoskeleton-associated proteins in control and sh-MDA cells. For this, we analyzed the results of a transcriptomic experiment performed by our group in scr-MDA and sh-MDA cells using an Agilent SurePrint G3 Human Gene Expression 8x60K v2 Microarray (S1 File). After filtering off the data for a |Log Fold Change|
>2 and a p value<0.01 we observed that, compared to the control cells, some genes encoding
for proteins involved in the regulation of cellular cytoskeleton were upregulated or downregu-lated in cells subexpressing GPAT2 (Table 1).
These results imply that the decrease in roughness inGPAT2 subexpressing cells could be
due to the alterations in the expression of cytoskeleton and cytoskeleton remodeling proteins, but more detailed studies will be necessary to correlateGPAT2 expression with cytoskeleton
function and remodeling.
On the other hand, the AFM resolution is able to reveal the presence of micro-irregularities such as pore-like structures. In this sense, pore-like structures were studied at the apical mem-brane of pancreatic acinar cells [32], in the outer mitochondrial membrane [33], and at the rituximab induced lysis of lymphoma cells [44]. Thus, this technique has been used to study pore presence or formation in both physiological and non-physiological conditions.
Membrane integrity is critical to cell survival and function, and a reduction in cell viabil-ity induced by pore formation is commonly observed in pathological conditions such as drug treated, malignant, or virally transformed cells [44]. Here, we observed that only sh-MDA cells exhibited pore-like structures and they were not present inGPAT2 expressing
cells. We discard that pore-like structures are a consequence of the fixation procedure because first, both cell lines were fixed and AFM scanned under the same optimal conditions, being the pore-like structures present exclusively in MDA cells; and second, only MDA cells present physiological alterations compatible with membrane damage. The sh-MDA cells show a higher release of LDH to the medium and a lower proliferation rate, com-pared to control cells. Moreover, the disturbance in the cytoskeleston integrity can be linked to the formation of pores. In this sense, AFM analysis showed that the treatment of HeLa cells with colchicine, a microtubule-depolymerazing drug, produced pores in the cell mem-brane [42]. Therefore, these results suggest thatGPAT2 silencing alters the integrity of the
cell membrane, leading to an increase in its permeability and a reduction in the cellular pro-liferation rate previously reported.
Conclusion
AFM is a powerful tool for basic research in cancer biology and the characterization of this disease progression. In this sense, most of the recent studies have used AFM for exploratory
Table 1. Cytoskeleton related genes upregulated or downregulated in sh-MDA cells.
Gene Symbol Name Up/down in sh-MDA Log FC sh-scr
TUBB2B tubulin beta 2B class IIb Upregulated 2.40
TPPP tubulin polymerization promoting protein Upregulated 2.28
AFAP1-L1 actin filament associated protein 1-like 1 Downregulated - 4.31
ARP-M1 actin related protein M1 Downregulated - 2.57
research on cancer cell morphology, cell topography and mechanical properties, or the rela-tionship of these to cell function.
In the present work, we report for the first time the morphological differences between cells that express or subexpress a cancer-testis geneGPAT2 in a breast cancer cellular model. GPAT2 silencing decreases cell roughness and induces the formation of pore-like structures,
which correlates with an increment in cell membrane permeability. Cancer-testis genes have been proposed as targets for anticancer vaccines, however, the roles of these reactivated testis genes in supporting tumorigenic features have been less studied. Here, based onGPAT2
expression, we validated AFM as a modern and valuable tool to correlate plasma membrane topographical alterations with malignant phenotype.
Supporting information
S1 File. Microarray transcriptomic data. scr-MDA and sh-MDA cell mRNA expression
pro-file was analyzed using an Agilent SurePrint G3 Human Gene Expression 8x60K v2 Microar-ray.
(XLSX)
Acknowledgments
We thank Mario Raul Ramos for the illustrations, Marianela Santana and Guillermina Man-gione for technical assistance and Rosana del Cid for English edition. MRGB and MAM are members of the Carrera del Investigador Cientı´fico y Tecnolo´gico, and MBGF is a fellow of CONICET, Argentina.
Author Contributions
Conceptualization: Elizabeth R. Cattaneo, Eduardo D. Prieto, Maria B. Garcia-Fabiani, Maria
R. Gonzalez-Baro.
Formal analysis: Eduardo D. Prieto, Maria B. Garcia-Fabiani, Mauro A. Montanaro. Funding acquisition: Maria R. Gonzalez-Baro.
Investigation: Elizabeth R. Cattaneo, Eduardo D. Prieto, Maria B. Garcia-Fabiani, Mauro A.
Montanaro.
Methodology: Elizabeth R. Cattaneo, Eduardo D. Prieto. Project administration: Maria R. Gonzalez-Baro. Resources: Herve Guillou, Maria R. Gonzalez-Baro. Supervision: Maria R. Gonzalez-Baro.
Writing – original draft: Elizabeth R. Cattaneo.
Writing – review & editing: Elizabeth R. Cattaneo, Eduardo D. Prieto, Maria R.
Gonzalez-Baro.
References
1. Wendel AA, Lewin TM, Coleman RA (2009) Glycerol-3-phosphate acyltransferases: rate limiting enzymes of triacylglycerol biosynthesis. Biochim Biophys Acta 1791: 501–506.https://doi.org/10.1016/ j.bbalip.2008.10.010PMID:19038363
2. Cattaneo ER, Pellon-Maison M, Rabassa ME, Lacunza E, Coleman RA, Gonzalez-Baro MR (2012) Glycerol-3-phosphate acyltransferase-2 is expressed in spermatic germ cells and incorporates
arachidonic Acid into triacylglycerols. PLoS One 7: e42986.https://doi.org/10.1371/journal.pone. 0042986PMID:22905194
3. Garcia-Fabiani MB, Montanaro MA, Lacunza E, Cattaneo ER, Coleman RA, Pellon-Maison M, et al. (2015) Methylation of the Gpat2 promoter regulates transient expression during mouse spermatogene-sis. Biochem J 471: 211–220.https://doi.org/10.1042/BJ20150730PMID:26268560
4. Fonteh AN, LaPorte T, Swan D, McAlexander MA (2001) A decrease in remodeling accounts for the accumulation of arachidonic acid in murine mast cells undergoing apoptosis. J Biol Chem 276: 1439– 1449.https://doi.org/10.1074/jbc.M006551200PMID:11022038
5. Perez R, Matabosch X, Llebaria A, Balboa MA, Balsinde J (2006) Blockade of arachidonic acid incorpo-ration into phospholipids induces apoptosis in U937 promonocytic cells. J Lipid Res 47: 484–491.
https://doi.org/10.1194/jlr.M500397-JLR200PMID:16326977
6. Wolf LA, Laster SM (1999) Characterization of arachidonic acid-induced apoptosis. Cell Biochem Bio-phys 30: 353–368.https://doi.org/10.1007/BF02738119PMID:10403056
7. Cao Y, Pearman AT, Zimmerman GA, McIntyre TM, Prescott SM (2000) Intracellular unesterified ara-chidonic acid signals apoptosis. Proc Natl Acad Sci U S A 97: 11280–11285.https://doi.org/10.1073/ pnas.200367597PMID:11005842
8. Pellon-Maison M, Montanaro MA, Lacunza E, Garcia-Fabiani MB, Soler-Gerino MC, Cattaneo ER, et al. (2014) Glycerol-3-phosphte acyltransferase 2 behaves as a cancer testis gene and promotes growth and tumorigenicity in the breast cancer MDA-MB-231 cell line. PLoS One 9: e100896.https:// doi.org/10.1371/journal.pone.0100896PMID:24967918
9. Hofmann O, Caballero OL, Stevenson BJ, Chen YT, Cohen T, Chua R, et al. (2008) Genome-wide anal-ysis of cancer/testis gene expression. Proc Natl Acad Sci U S A 105: 20422–20427.https://doi.org/10. 1073/pnas.0810777105PMID:19088187
10. Whitehurst AW (2014) Cause and consequence of cancer/testis antigen activation in cancer. Annu Rev Pharmacol Toxicol 54:251–72.https://doi.org/10.1146/annurev-pharmtox-011112-140326Epub;% 2013 Oct 11.: 251–272. PMID:24160706
11. Canetta E, Riches A, Borger E, Herrington S, Dholakia K, Adya AK (2014) Discrimination of bladder cancer cells from normal urothelial cells with high specificity and sensitivity: combined application of atomic force microscopy and modulated Raman spectroscopy. Acta Biomater 10: 2043–2055.https:// doi.org/10.1016/j.actbio.2013.12.057PMID:24406196
12. Francis LW, Lewis PD, Wright CJ, Conlan RS (2009) Atomic force microscopy comes of age. Biol Cell 102: 133–143. PMID:20001971
13. Sokolov I (2007) Atomic Force Microscopy in Cancer Cell Research. Chapter 1, 1–17. American Scien-tific Publishers’ Inc.
14. Cross SE, Jin YS, Rao J, Gimzewski JK (2007) Nanomechanical analysis of cells from cancer patients. Nat Nanotechnol 2: 780–783.https://doi.org/10.1038/nnano.2007.388PMID:18654431
15. Lekka M (2012) Atomic force microscopy: A tip for diagnosing cancer. Nat Nanotechnol 7: 691–692.
https://doi.org/10.1038/nnano.2012.196PMID:23132222
16. Kaul-Ghanekar R, Singh S, Mamgain H, Jalota-Badhwar A, Paknikar KM, Chattopadhyay S (2009) Tumor suppressor protein SMAR1 modulates the roughness of cell surface: combined AFM and SEM study. BMC Cancer 9: 350.https://doi.org/10.1186/1471-2407-9-350PMID:19799771
17. Bligh EG, Dyer WJ (1959) A rapid method of total lipid extraction and purification. Can J Biochem Phy-siol 37: 911–917.https://doi.org/10.1139/o59-099PMID:13671378
18. Lara-Cruz C, Jimenez-Salazar JE, Ramon-Gallegos E, Damian-Matsumura P, Batina N (2016) Increas-ing roughness of the human breast cancer cell membrane through incorporation of gold nanoparticles. Int J Nanomedicine 11: 5149–5161.https://doi.org/10.2147/IJN.S108768PMID:27785020
19. Francis LW, Lewis PD, Gonzalez D, Ryder TA, Webb G, Joels LA, et al. (2009) Progesterone induces nano-scale molecular modifications on endometrial epithelial cell surfaces. Biol Cell 101: 481–493.
https://doi.org/10.1042/BC20080189PMID:19236310
20. Corsetto PA, Montorfano G, Zava S, Jovenitti IE, Cremona A, Berra B, et al. (2011) Effects of n-3 PUFAs on breast cancer cells through their incorporation in plasma membrane. Lipids Health Dis 10:73.https://doi.org/10.1186/1476-511X-10-73: 73–10. PMID:21569413
21. Perez-Chacon G, Astudillo AM, Balgoma D, Balboa MA, Balsinde J (2009) Control of free arachidonic acid levels by phospholipases A2 and lysophospholipid acyltransferases. Biochim Biophys Acta 1791: 1103–1113.https://doi.org/10.1016/j.bbalip.2009.08.007PMID:19715771
22. Perez-Chacon G, Astudillo AM, Ruiperez V, Balboa MA, Balsinde J (2010) Signaling role for lysopho-sphatidylcholine acyltransferase 3 in receptor-regulated arachidonic acid reacylation reactions in human monocytes. J Immunol 184: 1071–1078.https://doi.org/10.4049/jimmunol.0902257PMID:
23. Gijon MA, Riekhof WR, Zarini S, Murphy RC, Voelker DR (2008) Lysophospholipid acyltransferases and arachidonate recycling in human neutrophils. J Biol Chem 283: 30235–30245.https://doi.org/10. 1074/jbc.M806194200PMID:18772128
24. Shindou H, Hishikawa D, Nakanishi H, Harayama T, Ishii S, Taguchi R, et al. (2007) A single enzyme catalyzes both platelet-activating factor production and membrane biogenesis of inflammatory cells. Cloning and characterization of acetyl-CoA:LYSO-PAF acetyltransferase. J Biol Chem 282: 6532– 6539.https://doi.org/10.1074/jbc.M609641200PMID:17182612
25. Ricci D, Braga PC (2004) Recognizing and avoiding artifacts in AFM imaging. Methods Mol Biol 242: 25–37. PMID:14578511
26. Yeow N, Tabor RF, Garnier G (2017) Atomic force microscopy: From red blood cells to immunohaema-tology. Adv Colloid Interface Sci.https://doi.org/10.1016/j.cis.2017.05.011PMID:28515013
27. Rico F, Roca-Cusachs P, Gavara N, Farre R, Rotger M, Navajas D (2005) Probing mechanical proper-ties of living cells by atomic force microscopy with blunted pyramidal cantilever tips. Phys Rev E Stat Nonlin Soft Matter Phys 72: 021914.https://doi.org/10.1103/PhysRevE.72.021914PMID:16196611 28. Weyn B, Kalle W, Kumar-Singh S, Van ME, Tanke H, Jacob W (1998) Atomic force microscopy: influ-ence of air drying and fixation on the morphology and viscoelasticity of cultured cells. J Microsc 189: 172–180. PMID:9503661
29. Tomankova K, Kolarova H, Vujtek M, Zapletalova H (2007) Study of Cancer Cells Used Atomic Force Microscopy. In: Me´ndez-Vilas A, Dı´az J, eds. Modern research and educational topics in microscopy. Badajoz, Spain: Formatex Research Center; 2007: 23–28.
30. Moloney M, McDonnell L, O’Shea H (2004) Atomic force microscopy of BHK-21 cells: an investigation of cell fixation techniques. Ultramicroscopy 100: 153–161.https://doi.org/10.1016/j.ultramic.2003.12. 010PMID:15231305
31. Lara-Cruz C, Tapia-Tapia M, Gonzalez-Nunez L, Matsumura PD, Batina N (2008) Visualizacio´n de la superficie de membrana de lı´neas celulares de ca´ncer de mama por microscopı´a de fuerza ato´moca (AFM). IX Congreso Nacional de Microscopia, Asociacio´n Mexicana de Microscopia A.C.,https://www. yumpu.com/es/document/view/14199961/41-visualizacion-de-la-superficie-de-membrana-de-lineas-
celulares-32. Cho SJ, Quinn AS, Stromer MH, Dash S, Cho J, Taatjes DJ, et al. (2002) Structure and dynamics of the fusion pore in live cells. Cell Biol Int 26: 35–42.https://doi.org/10.1006/cbir.2001.0849PMID:11779219 33. Layton BE, Sastry AM, Lastoskie CM, Philbert MA, Miller TJ, Sullivan KA, et al. (2004) In situ imaging of mitochondrial outer-membrane pores using atomic force microscopy. Biotechniques 37: 564–3. PMID:
15517968
34. Jaureguiberry MS, Tricerri MA, Sanchez SA, Garda HA, Finarelli GS, Gonzalez MC, et al. (2010) Mem-brane organization and regulation of cellular cholesterol homeostasis. J Membr Biol 234: 183–194.
https://doi.org/10.1007/s00232-010-9245-6PMID:20336284
35. Peter A, Weigert C, Staiger H, Rittig K, Cegan A, Lutz P, et al. (2008) Induction of stearoyl-CoA desatur-ase protects human arterial endothelial cells against lipotoxicity. Am J Physiol Endocrinol Metab 295: E339–E349.https://doi.org/10.1152/ajpendo.00022.2008PMID:18523127
36. Cheng YH, Wong EW, Cheng CY (2011) Cancer/testis (CT) antigens, carcinogenesis and spermato-genesis. Spermatogenesis 1: 209–220.https://doi.org/10.4161/spmg.1.3.17990PMID:22319669 37. Atilla-Gokcumen GE, Muro E, Relat-Goberna J, Sasse S, Bedigian A, Coughlin ML, et al. (2014)
Divid-ing cells regulate their lipid composition and localization. Cell 156: 428–439.https://doi.org/10.1016/j. cell.2013.12.015PMID:24462247
38. Wang Y, Xu C, Jiang N, Zheng L, Zeng J, Qiu C, et al. (2016) Quantitative analysis of the cell-surface roughness and viscoelasticity for breast cancer cells discrimination using atomic force microscopy. Scanning 38(6):558–563.https://doi.org/10.1002/sca.21300PMID:26750438
39. Girasole M, Pompeo G, Cricenti A, Congiu-Castellano A, Andreola F, Serafino A, et al. (2007) Rough-ness of the plasma membrane as an independent morphological parameter to study RBCs: a quantita-tive atomic force microscopy investigation. Biochim Biophys Acta 1768: 1268–1276.https://doi.org/10. 1016/j.bbamem.2007.01.014PMID:17320813
40. Girasole M, Cricenti A, Congiu-Castellano A, Fenu S, Mancini F, et al. (2003) Low Roughness Values of RBCs Membrane in Cells with Cytoskeleton Alterations. AIP Conference Proceedings 696, 467 (2003);
41. Kronlage C, Schafer-Herte M, Boning D, Oberleithner H, Fels J (2015) Feeling for Filaments: Quantifi-cation of the Cortical Actin Web in Live Vascular Endothelium. Biophys J 109: 687–698.https://doi.org/ 10.1016/j.bpj.2015.06.066PMID:26287621
42. Wang J, Wan Z, Liu W, Li L, Ren L, Wang X, et al. (2009) Atomic force microscope study of tumor cell membranes following treatment with anti-cancer drugs. Biosens Bioelectron 25: 721–727.https://doi. org/10.1016/j.bios.2009.08.011PMID:19734031
43. Berdyyeva T, Woodworth CD, Sokolov I (2005) Visualization of cytoskeletal elements by the atomic force microscope. Ultramicroscopy 102: 189–198.https://doi.org/10.1016/j.ultramic.2004.09.008
PMID:15639349
44. Li M, Liu L, Xi N, Wang Y (2016) Applications of Atomic Force Microscopy in Exploring Drug Actions in Lymphoma-Targeted Therapy at the Nanoscale. BioNanoScience 6: 22–32.