HAL Id: hal-01567923
https://hal.archives-ouvertes.fr/hal-01567923
Submitted on 5 May 2018
HAL is a multi-disciplinary open access
archive for the deposit and dissemination of
sci-entific research documents, whether they are
pub-lished or not. The documents may come from
teaching and research institutions in France or
abroad, or from public or private research centers.
L’archive ouverte pluridisciplinaire HAL, est
destinée au dépôt et à la diffusion de documents
scientifiques de niveau recherche, publiés ou non,
émanant des établissements d’enseignement et de
recherche français ou étrangers, des laboratoires
publics ou privés.
Christel Kamp, Mathieu Moslonka-Lefebvre, Samuel Alizon
To cite this version:
Christel Kamp, Mathieu Moslonka-Lefebvre, Samuel Alizon. Epidemic spread on weighted networks.
PLoS Computational Biology, Public Library of Science, 2013, 9 (12), pp.e1003352.
�10.1371/jour-nal.pcbi.1003352�. �hal-01567923�
Epidemic Spread on Weighted Networks
Christel Kamp1*, Mathieu Moslonka-Lefebvre2,3, Samuel Alizon4
1 Paul-Ehrlich-Institut, Federal Institute for Vaccines and Biomedicines, Langen, Germany, 2 INRA, UR 0341 Mathe´matiques et Informatique Applique´es, Jouy-en-Josas, France, 3 AgroParisTech, F-75005 Paris, France, 4 Laboratoire MIVEGEC (UMR CNRS 5290, IRD 224, UM1, UM2), Montpellier, France
Abstract
The contact structure between hosts shapes disease spread. Most network-based models used in epidemiology tend to ignore heterogeneity in the weighting of contacts between two individuals. However, this assumption is known to be at odds with the data for many networks (e.g. sexual contact networks) and to have a critical influence on epidemics’ behavior. One of the reasons why models usually ignore heterogeneity in transmission is that we currently lack tools to analyze weighted networks, such that most studies rely on numerical simulations. Here, we present a novel framework to estimate key epidemiological variables, such as the rate of early epidemic expansion (r0) and the basic reproductive ratio (R0), from
joint probability distributions of number of partners (contacts) and number of interaction events through which contacts are weighted. These distributions are much easier to infer than the exact shape of the network, which makes the approach widely applicable. The framework also allows for a derivation of the full time course of epidemic prevalence and contact behaviour, which we validate with numerical simulations on networks. Overall, incorporating more realistic contact networks into epidemiological models can improve our understanding of the emergence and spread of infectious diseases.
Citation: Kamp C, Moslonka-Lefebvre M, Alizon S (2013) Epidemic Spread on Weighted Networks. PLoS Comput Biol 9(12): e1003352. doi:10.1371/ journal.pcbi.1003352
Editor: Christophe Fraser, Imperial College London, United Kingdom
Received March 26, 2013; Accepted October 5, 2013; Published December 12, 2013
Copyright: ! 2013 Kamp et al. This is an open-access article distributed under the terms of the Creative Commons Attribution License, which permits unrestricted use, distribution, and reproduction in any medium, provided the original author and source are credited.
Funding: MML is supported by the French Ministries in charge of Agriculture and Environment. SA is funded by an ATIP-Avenir grant from CNRS and INSERM and by the IRD and the CNRS. The funders had no role in study design, data collection and analysis, decision to publish, or preparation of the manuscript. Competing Interests: The authors have declared that no competing interests exist.
* E-mail: [email protected]
Introduction
Contact structure between hosts is known to have a key influence on disease spread [1]. A striking result is for instance that the more heterogeneous the contact network is, i.e. the higher the variance in the number of contacts per individual, the more rapid the initial disease spread.
One way to capture contact structure is to use a network [2]. Such contact networks are typically described by a square binary adjacency matrix, where each term on the ith line and jth column can take the value 0 or 1 to indicate respectively the absence or the presence of a contact between individuals i and j. Contact networks are widely used because they possess several convenient properties, one of which being that the dominant eigenvalue of the adjacency matrix is an indicator of the initial propagation speed of an infectious disease spreading on this network [3,4].
The main limitation of contact networks is that their exact shape is often difficult to infer. This is why there is a continuous effort to predict disease spread from network summary statistics that are easier to estimate, such as the distribution of the number of contacts (degrees). For instance, the number of secondary infections generated by a typical infected host in a fully susceptible population, i.e. the basic reproductive number R0[1], scales with
the ratio of the second moment Sk2T and first moment (mean)
SkT of the distribution in the number of contacts k. This result holds both for static networks (denoted Rstat0 ) [5] as well as for fully mixed, dynamic networks (denoted Rmix0 ) [6,7] with
Rmix0 ~b c Sk2T SkT~ b c s2 k SkTzSkT ! " ð1aÞ Rstat 0 ~ b bzc Sk2T SkT{1 ! " ~ b bzc s2 k SkTzSkT{1 ! " ð1bÞ where s2k~Sk2T{SkT2is the variance of the distribution of the number of contacts. The static case corresponds to networks in which the identity of contacts is fixed (as approximatively seen in sexual contact networks) and the fully mixed dynamic case corresponds to a situation in which individuals update their contacts dynamically in a fully mixed fashion within the population (as approximatively seen in airborne infections).
Rstat
0 and Rmix0 represent the lower and upper bounds of the
basic reproductive ratio [8] for SIR epidemics on random networks if individuals transmit the infection at a rate b and recover from the infection at a rate c. On both static and dynamic heterogeneous networks with a large or even diverging variance in the distribution of the number of contacts, epidemics die out only for very small or even vanishing transmission rates b.
One of the typical key assumptions epidemiological models on networks make to obtain such elegant expressions for R0is that the
transmission rate is the same between all pairs of individuals. This is materialized by the fact that all the edges of the contact matrix have a weight of 0 or 1. This is known to be a simplifying assumption [9]. A well-studied example related to infectious diseases is that of sexual contact networks, where the number of sex acts per unit of time is not constant in all partnerships [10–12]. More generally, the number of interaction events (which correspond to potential transmission events) may vary among contact pairs and is likely to decrease with the number of contacts
an individual has (see also Figure S3). Simplifying the reality is commendable but the problem is that tampering with the weighting of the network has been shown to lead to the loss of important epidemiological properties of heterogeneous unweight-ed networks, such as the low value of the epidemiological threshold or the negative correlation between the epidemiological threshold value and network size [13]. To summarize, although contact networks appear to be ‘scale free’ in structure, they might not exhibit the properties one might expect from this structure.
An increasing number of studies in epidemiology point to the importance of considering weighted networks. Some examples include the spread of sexually-transmitted infections [13], disease transmission in sheep flocks [14], respiratory diseases of humans [15] or general infectious diseases of human spreading on a social contact network [16] or on airline connection networks [17]. Several more conceptual studies have also been published in the theoretical physics literature (e.g. [2,18–20]). Most of these studies have in common that they use weighted networks and resort to (heavy) numerical simulations. Indeed, contrary to unweighted networks, we lack analytical frameworks to analyze epidemic spread on weighted networks.
Here, we present an original framework, which builds on configuration type network epidemic approaches [21,22] that offers an alternative to simulating epidemics on full networks. It allows to model the dynamics of a disease spreading on a weighted network and to estimate key epidemiological variables from the network’s properties. The framework provides us with explicit expressions for the rate of early epidemic expansion (r0) and the
basic reproductive ratio (R0) of the infection without requiring
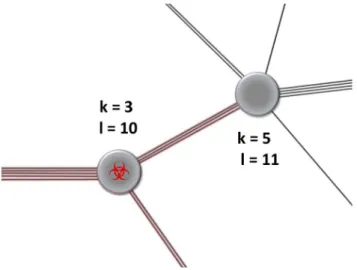
strong simplifying assumptions regarding epidemiological process-es or the distribution of weights on the contact network. It also allows for a derivation of the full time course of epidemic prevalence and contact behaviour of susceptible, infected and recovered individuals (in terms of the probability generating functions – PGFs – of the degree distributions). As sketched in Fig. 1, the parametrisation is done in a general fashion using the
joint probability distribution Pklof an individual to have k contacts
among which (s)he randomly distributes l interaction events. We validate our analytical results using numerical simulations on networks.
Importantly, since this framework relies on summary statistics of the network and does not require knowledge of the exact shape of the network, it can be parametrized using large scale survey data. The network information we lose by using these summary statistics requires that we make the assumption that there is no assortativity between individuals in our framework. However, we show that even with these assumption we can approximate epidemic dynamics better than with non weighted networks.
Materials and Methods The configuration model
Individuals have k contacts and l interaction events per time interval, which are distributed among their k contacts (l is sometimes also referred to as the strength of the node [9]).
The model is broadly applicable as it can be parameterised through any joint probability distribution of the number of partners (k) and number of interaction events (l). Such a joint probability distribution Pkl can be written as the product
Pkl~PkPlDk, PlDkbeing the probability distribution of the number of interaction events per time l given that the individual has k contacts. If PlDk~dlk, where dlkis 1 if l = k and 0 otherwise, we are
then back to a ‘classical’ network case, with an exact linear dependency between the number of contacts and the number of interaction events (for a detailed discussion, see Text S1, Section D, The recovery of the classical equations in the linear case). Our framework can capture more general situations by explicitly choosing PlDk.
Our analytical approximation assumes that an individual distributes his/her l interaction events multinomially among his/ her k contacts, which are static and are randomly assigned as in configuration models [21,22]. This individual is infected at a rate proportional to his/her average number of interaction events with
Figure 1. Weighting between contacts. Both the number of contacts that an individual maintains and the weight that (s)he assigns to each contact are relevant for the spread of an infectious agent. Here, each individual has l interaction events that (s)he can distribute among his/her k contacts. On the scale of the transmission network, these are modelled by the joint probability distribution Pklto find an individual
with k contacts and l interaction events per time interval. doi:10.1371/journal.pcbi.1003352.g001
Author Summary
Understanding how infectious diseases spread has public health and ecological implications. The contact structure between hosts strongly affects this spread. However, most studies assume that all types of contacts are identical, when in reality some individuals interact more strongly than others. This is particularly striking for sexual-contact networks, where the number of sex acts is not identical for all partnerships. This heterogeneity in activity can either speed up or slow down epidemic spread depending on how strongly the individuals’ number of contacts coincides with their activity. There are two limitations to current frameworks that can explain the lack of studies on weighted networks. First, analytical results are difficult to obtain, which requires numerical simulations. Second, inferring weighted networks from survey data is extremely difficult. Here, we present a novel framework that allows to alleviate these two limitations. Building on configuration type network epidemic approaches, we manage to capture disease spread on weighted networks from the distribution of the number of contacts and distribution of the number of interaction events (e.g. sex acts). This allows us to derive analytical estimates for the epidemic threshold and the rate of spread of the disease. It also allows us to readily incorporate survey data, as illustrated in this study with data from the National Survey of Sexual Attitudes and Lifestyles (NATSAL) carried out in the UK.
i infected contacts among his/her total k contacts (so 0ƒiƒk). This averaging implies the choice of a time scale for the number of interaction events such that SlTwSkT (the network shape is assumed to be constant over the time period considered so the number of contacts is not affected by the time scale). The analytical approach only relies on the nodes’ statistics and does not consider the constraints for half-contacts to match half-contacts with similar weight, whereas in reality, the weight on a link between two nodes should be the same for the two nodes. This could lead to an unrealistic network segregation for some artificial networks where SlTwSkT. This network segregation can affect epidemic dynamics in these networks in a way that is not seen in the analytical approach per se but can be considered through corrections in the analytical approach as we discuss later on.
The epidemiological model
A susceptible individual becomes infected at a rate proportional to the number of interaction events per time interval (l), the transmission probability per interaction event of the pathogen (b) and the probability for each of his/her contacts to points to an infected individual (pSI). The population dynamics of susceptible,
infected and recovered individuals with k contacts and l interaction events per time interval (denoted Skl, Ikland Rklrespectively) are
thus captured by the following set of differential equations:
_SSkl~{bpSIlSkl ð2aÞ
_IIkl~bpSIlSkl{cIkl ð2bÞ
_R
Rkl~cIkl, ð3cÞ
where c is the rate at which hosts recover and become immune to subsequent infection (see Table 1). This setting can capture lifelong infections if c = 0.
The dynamics of the total number of susceptible, infected and recovered individuals can be obtained by summing over k and l in equation system 2. This leads to:
_SS~{bpSISlTSS ð3aÞ _II~bpSISlTSS{cI ð3bÞ _R R~cI : ð3cÞ where SlTS~ P
k,llSkl=S is the average number of interaction
events per time a susceptible individual has.
To close the equation system (2)–(3), we need expressions for the temporal dynamics of the pAB, i.e. the probabilities for a status A
individual’s contact to be with an individual in state B. These can be derived through a careful assessment of the links/contacts among susceptible and infected individuals over the course of an epidemic. This means following the dynamics of the joint probability distribution to find k contacts and l interaction events per time among susceptible individuals PSkl~Skl=S through its
PGF, denoted GS(x,y,t). The temporal dynamics of GS(x,y,t) can
be calculated by observing that the dynamics of the corresponding joint probability distribution of contacts and interaction events of susceptible individuals are governed by the equation
_P PSkl~
_SSkl
S { _SS
SPSkl. Hence, we close equation system (2)–(3) with the following equations:
_ppSI~pSI bpSS SklTS SkTS {b(1{pSIzpSS) SlTS SkTS {c ! " ð4aÞ _ppSS~{bpSIpSS SklTS{2SlTS SkTS ð4bÞ _ G
GS(x,y,t)~bpSI(SlTSGS(x,y,t){yG(0,1)S (x,y,t)), ð4cÞ
where GS(0,1)(x,y,t) is the partial derivative of GS(x,y,t) with
respect to y. Note that SlTS~G(0,1)S (1,1,t) and SkTS~
GS(1,0)(1,1,t). For furthers details about the terms in this equation system, see Table 1.
The set of differential equations describing the epidemic process is derived by careful bookkeeping of the links along which an infectious agent spreads (a detailed derivation is provided in Text S1, Section A, Equations for the epidemic model on weighted networks).
Analytical results and their validation
Distributions used. To validate the analytical approach, we generated four types of networks corresponding to the combina-tions of homogeneous and heterogeneous behaviour in the number of contacts k and the number of interaction events l as well as the corresponding networks with a linear dependency between k and l. We studied the spread of an infectious agent on these artificial networks using the analytical approach by plugging the corresponding joint probability generating functions into equations (3) and (4).
More precisely, we consider combinations of Poisson and power law distributions for the number of contacts k and interaction events per time l. As we neglect isolated hosts, we use the Poisson distribution Pn~
1{dn0
1{e{SnT
SnTn
n! e
{SnTwith support for nw0 and
probability generating function g(x)~e
SnT(x{1){e{SnT
1{e{SnT and power law distributions with exponent l and cut-off k,
Pn~ n{le{n k Lil e{ 1 k # $ and g(x)~Lil xe {1 k # $ Lil e{ 1 k # $ (normalisation through the Polylogarithm Lil) for homogeneous and heterogeneous
behaviour, respectively. If the joint probability distribution Pklis
given by the product Pkl~PkPlof independent distributions with
PGFs g1(x) and g2(y), their joint PGF G(x,y) is also given by the
product G(x,y)~g1(x)g2(y). In the linear case with Pkl~Pkdkl,
the PGF G(x,y) is given by G(x,y)~g1(xy).
Generating networks from PGF. Networks were generated by assigning each host a number k of ‘half-contacts’ (stubs) and l interaction events per time interval drawn from the distribution Pkl. Each host then shared his/her interaction events
equi-probably at random (i.e. multinomially) among his/her k contacts. Pklwas chosen to satisfySlT~2SkT corresponding to a timescale
in which a host has on average 2 interaction events per contact. The matching of half-contacts (stubs) was done at random but by respecting their assigned number of interaction events per contact. The problem is that not all probability distribution Pkl
can be realised topologically within a network. Indeed, weighting of interactions between contacts can impose strong constraints on
network topology [23]. The fact that contacts can only occur between stubs with the same weight can lead to network segregation and assortative effects that are not seen in the analytical approach per se due to its node-centric view (see Text S1, Section E, Network segregation and the limiting case Pkl~PkdSlTl). It is
even possible to devise joint probability distributions Pkl that
cannot be represented through a network topology (although this is not a problem for Pkl empirically derived from realised
networks). In simulated networks, this necessity for exact matching segregates the network into subnetworks, which can show assortativity either with respect to the degree of connected nodes or with respect to their edge weights.
Correcting for assortativity. If the number of interaction events per time and per contact is large (i.e. ifSlT=SkT&1), hosts nearly equi-distribute their interaction events among all their contacts due to convergence under the law of large numbers. DecreasingSlT yields a more realistic network, as this introduces some variability in the number of interaction events among a host’s contacts, which offers more flexibility in the assignment of interaction events on short time scales and reduces assortative effects.
Weight assortativity arises in networks that have a (nearly) constant number of contacts k per individual and where the number of interaction events l is distributed in a heterogeneous way, thus leading to an early expansion among the most highly active individuals. This can accelerate the initial expansion of an epidemic but, at the same time, it also constrains disease spread compared to what one could expect from the analytical approach. Alternatively, the network can also segregate with respect to the
number of contacts an individual holds (i.e. contact or degree assortativity). An extreme case can be observed when a (nearly) constant number of interaction events has to be distributed among a heterogeneous number of contacts. This leads to a (near) isolation of individuals with single contacts from the epidemic process (see Text S1, Section E, Network segregation and the limiting case Pkl~PkdSlTl).
We can introduce some tolerance in ‘negotiating’ the number of interaction events per contact. Another way to deal with weight and degree correlations between neighbouring individuals is to drop the assumption that weights are multinomially distributed among an individual’s contact. Indeed, heterogeneous weight distributions among an individual’s contacts can reduce correla-tions among neighbouring individuals’ degrees and weights [23]. However, this cannot be done without changing Pkl to an
empirical distribution !PPkl, while at the same time deviations might
arise from the analytical approach as the assumption of multinomial distribution of weights is violated.
Simulations on weighted networks
Networks for simulation are obtained by first generating 10,000 nodes with k half-contacts (stubs) and l interaction events as drawn from the probability distribution Pkl. The l interaction events a
node has are then distributed multinomially among its k stubs. Stubs are randomly matched together, with matches being rejected if the weights of the stubs differ by more than one interaction event. In addition matches are rejected if they differ by more than 10% of the smaller weight involved to avoid biases in Table 1. Notations used in the study.
_ff(x,t)~ L Ltf (x,t)
partial derivative of function f with respect to t
f(a,b)(x,y,t)~La
Lxa
Lb
Lybf (x,y,t)
partial derivative of function f a times with respect to x and b times with respect to y
Akl number of individuals in group A with k contacts and l (potential) transmission events (per time interval)
A~Xk,lAkl number of individuals in group A
Nkl~
X
AAkl number of individuals with k contacts and l transmission events (per time interval)
N~Xk,lNkl total number of individuals
PAkl~
Akl
A
probability for an individual in group A to have k contacts and l transmission events per time interval GA(x,y,t)~
X
k,lPAkl(t)x
kyl probability generating function (PGF) of PAkl(t)
SkTA~G (1,0)
A (1,1,t) average number of contacts of A individuals
SlTA~G (0,1)
A (1,1,t) average number of transmission events per time interval of A individuals
SklTA~G(1,1)A (1,1,t) average number of contacts times transmission events per time interval of A individuals
Pkl~
Nkl
N
probability for an individual to have k contacts and l (potential) transmission events per time interval G(x,y,t)~Xk,lPkl(t)xkyl~
X
A
A NGA(x,y,t)
probability generating function (PGF) of Pkl(t)
SkT~G(1,0)(1,1,t) average number of contacts of individuals
MA~
X
k,lkAkl~AG (1,0)
A (1,1,t) number of links coming from A individuals
M~XAMA number of links
MAB number of links coming from A individuals and pointing to B individuals
pAB~
MAB
MA
probability for a link starting from an A individual to point to an B individual
A,B correspond to epidemic stages, i.e. S, I, R for susceptible, infected, recovered. doi:10.1371/journal.pcbi.1003352.t001
nodes with few links. If stubs with non-identical weights are matched, the contact is assigned the mean weight randomly rounded to the next integer. This results in the empirical distribution !PPklas mentioned in the previous subsection.
We use the Gillespie direct algorithm [24] to run stochastic SIR epidemics on continuous time. For each susceptible node i, transmission occurs at rateX
j[I
bWj,i, where b is the probability of
transmission per sex act, W is the weighted adjacency matrix listing the number of interaction events per time unit between all pairs of nodes, and I is the set of infected nodes connected to node i. Infected nodes recover at rate c. For each case analyzed, 20 nodes were initially infected uniformly at random in a population of 10,000 and 100 replicate simulations were carried out over each of 20 replicate networks.
Derivation of r0 and R0
The derivation of the early exponential growth rate r0is based
on the observation that the rate of epidemic expansion as described by equations (3a–3c) is proportional to the number of links/contacts between susceptible and infected individuals MSI,
i.e. pSISSlTS~ MSI MS SSlTS~MSI SlTS SkTS , with MS~SGS(1,0)
(1,1,t)~SSkTS being the number of contacts of susceptible
individuals.
As there is no explicit expression for MSI we have to rely on
approximate equations that are valid in the early stages of an epidemic. In the mean field approximation, MSI is approximated
by the number of infected individuals (I) and the average number of contacts per individual found originally in the total population (SkT~G(1,0)(1,1,0)). As soon as the epidemic is set, i.e. once we
are beyond the mean field approximation relying on a randomly picked node, MSI is given by the product of I and a slightly more
sophisticated estimate of the number of contacts of infected hosts than in the mean field approximation. More precisely, each infected node contributes to MSIby the average excess degree of a
recently infected node chosen proportional to its number of interaction events G
(1,1)(1,1,t)
G(0,1)(1,1,t){1~
SklT
SkT{1 (for details, see Text S1, Section A, Equations for the epidemic model on weighted networks). This means that the contact the infection has spread from is discounted and that all ‘new’ contacts are assumed to still be susceptible in the early phase of an epidemic. In order to correctly estimate MSI in the full chain of early infections, it is necessary to
discount not only the contact from which an individual got infected but also the contact along which the epidemic spreads further. This results in MSI&I
G(1,1)(1,1,t) G(0,1)(1,1,t){2 ! " ~ I SklT SkT{2 ! " . Altogether we have, _II~bpSISlTSS{cI ~bMSI SlTS SkTS {cI We also have MSI SlTS SkTS &MSI SlT
SkT where the approximation holds in the early phase of the epidemic.
If we assume that MSI&ISkT, then
_II~(bSlT{c)I: ð5Þ If we assume that MSI&I SklTSkT{2
# $ , then _II~ SklT{2SlT SkT ! " b{c ! " I: ð6Þ
The exponential growth rate of the infected population in equation (6) corresponds to r0. Approximation (5) corresponds to
a ‘mean field approximation’ representing the neighbourhood of a randomly picked node, i.e. not a node picked according to its number of interaction events per time interval. Approximation (6) considers that an infected individual has been picked with a probability proportionally to its number of interaction events per time interval. The doubling time tDcan be derived from the early
exponential growth rate r0as tD~ln(2)=r0.
The basic reproductive ratio R0 is the average number of
secondary infections that a typical infected host produces in a fully susceptible population. As for SIR models on classical random networks, it is derived by first evaluating the distribution of excess contacts of a typically infected host, i.e. the probability for a node chosen according to its number of interaction events per time (l) to have k excess contacts. This probability is Qkl~
lP(kz1)l
G(0,1)(1,1). R0is
calculated in Text S1 (Section C, The basic reproductive ratio R0) as
the number of infections that spread along these excess contacts before recovery of the typically infected host.
Results
Validation of the analytical model with simulations on networks
In order to test our analytical model, we consider epidemiolog-ical dynamics taking place on artificial networks on which we release the constraints found in ‘classical’/unweighted networks by assuming that the number of interaction events l an individual has does not necessarily increase linearly with his/her number of partners k. To create these networks, we used combinations of Poisson and power law distributions for the number of contacts k and interaction events per time l. This allowed us to introduce arbitrary combinations of homogeneous or heterogeneous behav-iour in the way contacts are made and in the number of interaction events established, that may be either independent or dependent (as in the linear case).
To validate the model, we compared the epidemic prevalence (I) from repeated simulation runs with the results derived from the analytical approach using the probability generating functions corresponding to Pkl and !PPkl, G(x,y) and !GG(x,y). (Note that
Pkl(0)~PSkl(0), PP!kl(0)~!PPSkl(0), G(x,y,0)~GS(x,y,0) and
! G
G(x,y,0)~ !GGS(x,y,0).) The epidemiological dynamics are
summa-rised in Fig. 2. In addition of the analytical approach for Pkl
(G(x,y)), !PPkl( !GG(x,y)), we also show an approximation (applied to
Pkl), in which we exclude individuals with one contact. The latter
is relevant for networks with heterogeneous number of contacts and (nearly) constant number of interaction events per individual (contact or degree assortativity). Quantitative measures to assess the level of discrepancy between simulations and approximations are provided in Text S1 (Section F, Agreement between approximations and simulations) and Table S2. The derivation of analytical expressions for the error (e.g. a 95% confidence interval) is likely
to be an extremely difficult task as these expressions should consider the complex implications on epidemic dynamics that are caused by deviations in the network topology from those of random networks. The simplest way might be to use numerical simulations to estimate the magnitude of the error for given networks.
Overall, the analytical approach matches the simulation results well if the constraints imposed by Pkl on the specific networks
topology are properly taken into account. The assortativity correction (in orange) is most relevant for a heterogeneous distribution of contacts (k follows a power law) and a homogeneous
Figure 2. Dynamics of the number of infected hosts (I) during epidemic spreading on different types of networks. The distributions in the number of contacts (k) and interaction events per time (l) are either homogeneous (Poisson) or heterogeneous (power law). For the number of interaction events, we also show the linear case in which l is strictly proportional to the number of contacts k, i.e. Pl~dkl. k and l are drawn from joint
distributions PklwithSlT~2SkT (except for the analytical Pklmodel’s linear case where l~k being compensated by a double transmission rate). The
figures show the epidemic prevalence I as the outcome of the simulation runs (grey, dotted lines), of the the numerical solution of the analytical model with Pkl(red, solid line) and !PPkl(red, dashed line). In addition, we show the epidemic prevalence when excluding individuals with only one
contact (k~1) which is relevant for epidemics on networks with heterogeneous numbers of contacts including many individuals with k~1 in combination with a (nearly) constant number of interaction events, as realised through a Poisson distribution (orange line, cf. specifically power law, Poisson). Parameters chosen correspond toSkT~4 (Poisson case: SkT~4, SlT~8, power law case: lk~1:4, ll~0:89, kk~kl~22). Epidemiological
parameters are b = 0.01 (0.02 for the analytical Pklmodel’s linear case), c = 0.004 in arbitrary units and I(0) = 20. The insets show the same data for the
early epidemic expansion in logarithmic scale showing early exponential growth according to I(0)er0t(black line) with r
0from Table 2.
distribution of interaction events (l is Poisson distributed). This is because the strongest constraints on network topology are expected to occur with these distributions (Fig. 2, top panel, right side). On the contrary, for more homogeneous networks (Fig. 2, left panel), the assortativity correction is less needed. In the linear case, the correction is not relevant (Fig. 2, bottom panel).
A particularly interesting observation is that epidemics spread slower on networks with heterogeneous contacts if the network is weighted than if the number of interaction events scales linearly with the number of contacts for each individual (i.e. ‘classical’ linear networks). This is particularly true in networks where the average weight per contact is inversely proportional to the number of contacts an individual has. In our simulations, this effect is the clearest when Pkfollows a power law distribution and Pla Poisson
distribution (Fig. 2 top panel, right side).
Capturing epidemic characteristics (expressions for r0
and R0)
There are different ways to assess the initial propagation of an infectious agent in an otherwise fully susceptible population. One possibility is to estimate the initial exponential growth rate in the number of infected individuals (r0). Another possibility consists in
estimating the number of secondary cases created by a newly infected host in a fully susceptible population, which is classically referred to as the basic reproductive ratio R0[1].
Subtle effects arise depending on whether we choose the neighbourhood of a random individual as a reference or the neighbourhood of a ‘typically’ infected individual. The first case corresponds to what is usually referred to as a ‘mean field approximation’ and captures well the very first infection events. The second case (using a ‘typical’ infected individual) is more appropriate to capture the next stages of early epidemic expansion because it accounts for the fact that spatial structure has been sensed or set by the epidemic process. We thus use it for the derivation of R0.
The expressions for r0and R0for the SIR model are shown in
Table 2 and are derived in details in the Materials and Methods and in Text S1, respectively. Note that these do not involve any approximation beyond those implied in the model’s assumptions, i.e. they are exact within the model framework. The derivation for R0 when cw0 is the only case that requires some further
approximations to obtain an explicit formula (see Text S1, Section C, The basic reproductive ratio R0).
In the expression for r0 and R0, all the occurrences of the
transmission probability (b) are weighted by the number of interaction events per contact. This makes sense because this corresponds to a transmission rate. Note that there is a slight difference between r0and R0because in the former we have the
ratio of the means (SlT=SkT), whereas in the latter we have mean of the ratios (Sl=kT). This is due to the fact that the averaging is done at a different step in the calculations.
More interestingly, the expressions for r0and R0both scale with
the second momentSklT of the joint probability distribution Pkl.
This implies that the number of contacts (k) and the interaction events (l) an individual maintains equally affect epidemic spread. At the same time the correlation between these quantities is relevant to model rapid epidemic spread: for epidemic control, targeting individuals with most contacts or interaction events can prove to be much less efficient than targeting those who maximise both. The formulae in Table 2 are generalisations of formula 1b, which corresponds to the linear case where the number of interaction events scales with the number of contacts a person maintains, i.e. SklT*Sk2T. Note that earlier approaches on
weighted networks correspond to the fully mixed situation in formula 1 in which k is interpreted as the number of interaction events [6].
Figure 2 shows epidemic expansion in different types of simulated networks (grey, dotted lines) in comparison with analytical approximations (red and orange lines). The insets in logarithmic scale show that the exponential growth rate r0~ SklT
SlT {2 ! "
SlT
SkTb{c calculated for the early epidemic expansion approximates well the simulation and analytical results. The early exponential growth rate r0 can slightly underestimate
the dynamics if the contact network is homogeneous (Pkis Poisson
distributed), while the distribution of interaction events is heterogeneous (Pl follows a power law). This underestimation is
due to the fact that weight assortativity generates a subnetwork of individuals with many interaction events, which speeds up epidemic expansion in its early phase (Fig. 2, middle panel, left side).
Application of the model to epidemiological data
The knowledge of transmission networks along which an infectious agent can spread within a host population is of great importance to public health. These networks might be hard to assess for air-borne infections because they are very dynamic [25,26] but easier to infer for sexually transmitted infections (STI) because they are more static. Such sexual contact networks have been surveyed in many studies covering homosexual as well as heterosexual populations and different societal contexts [27–29] to understand and prevent the spread of STI. The National Survey of Sexual Attitudes and Lifestyles (NATSAL [28]) provides detailed data on the situation in the United Kingdom, including distributions in the number of sexual partners (k) and sex acts (interaction events, l) a person has within certain time frames.
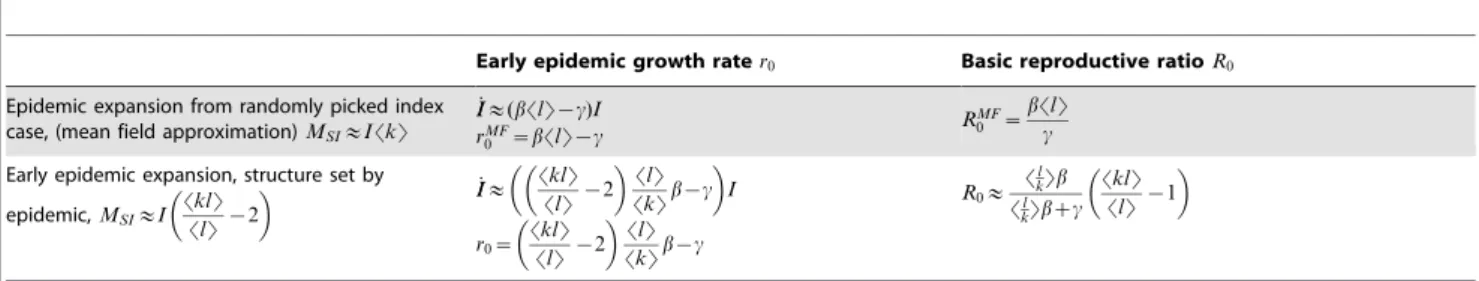
Table 2. r0vs. R0.
Early epidemic growth rate r0 Basic reproductive ratio R0
Epidemic expansion from randomly picked index case, (mean field approximation) MSI&ISkT
_II&(bSlT{c)I rMF 0 ~bSlT{c RMF 0 ~ bSlT c Early epidemic expansion, structure set by
epidemic, MSI&I SklTSlT{2 ! " _II& SklT SlT{2 ! "SlT SkTb{c ! " I r0~ SklT SlT{2 ! "SlT SkTb{c R0& Sl kTb Sl kTbzc SklT SlT{1 ! "
b is the transmission probability, c the recovery rate,SlT the average number of interaction events an individual has, SkT the average number of contacts per individual, SklT is the second moment of the joint probability distribution PklandSl=kT is the average number of interaction events per contact. Note that the equation for R0is
exact for c~0.
doi:10.1371/journal.pcbi.1003352.t002
As shown in Fig. 3A, both the number of partners (contacts, k) and sex acts (interaction events, l) an individual has are heterogeneously distributed. However, their joint distribution Pkl
does not show a linear behaviour, implying that the number of sex acts l does not scale linearly with the number of partners k an individual has. This is also supported by Pearson’s correlation coefficient which is 0.15, i.e. positive but not indicating a strong linear relationship between k and l (see also Supporting Figure S3). When they combine a linear relationship between number of partners and number of sex acts with the observed broad distributions of sexual contacts and sex acts, several models predict extremely rapid early epidemic expansion and an epidemic threshold that is potentially vanishing in the limit of infinite network size [5–8,30,31], as can be seen from equation (1).
In our ‘Validation’ section we have shown that, regarding the number of interaction events, a deviation from the linear
behaviour decreases epidemic expansion and peak prevalence, especially for transmission networks that are characterized by a heterogeneous distribution in the number of contacts per individual k and regardless of whether the distribution of interaction events/sex acts is homogeneous (Poisson) or heteroge-neous (power law). This is also reflected more quantitatively in the expression for R0, which is dominated by the second momentSklT
of Pkl. In other words, (as explained above when interpreting our
approximations) the more the number of partners (k) correlates with their number of sex acts (l) the faster the early epidemic expansion.
These differences between weighted and unweighted networks are visible in Fig. 3, which shows the epidemic expansion of a susceptible-infected (SI) epidemic with transmission probability b = 0.01 per sex act in two scenarios. We chose to model SI dynamics by setting c = 0 in order to simulate HIV spreading on a
Figure 3. Disease spread on a network inferred from data. A) Characteristics of the heterosexual contact network inferred from the NATSAL contact tracing study [28]. The network shows a heterogeneous joint probability distribution Pkl, which is the probability for an individual to have k
contacts during the last 5 years and l sex acts during the last 4 weeks (higher values of Pkl are in red and lower values are in green). This
heterogeneity is also seen for the marginal distributions Pk (on the right) and Pl (on the top). B) Dynamics of an SI epidemic spreading on an
unweighted (black line) or a weighted sexual contact network. The results of simulations on the weighted network are in grey, the approximations of our model are in red or in orange for the case with assortativity correction. The network has been reduced to nodes with k.0 and transmission probability per sex act is b = 0.01. C) Dynamics of the average number of contactsSkT of susceptible (in green) and infected individuals (in red) over the course of an epidemic spreading on the weighted network. The inset shows the probability of a host to be susceptible or infected at t = 10 years conditioned to the number of contacts during the last 5 years (more or less than 3 contacts). D) Same as panel C but for the number of sex actsSlT. In Panels B, C and D, the weighting is done using the Pklshown in panel A. Individuals with more contacts tend to be disproportionally infected (panel
C). Individuals with more sex acts tend to be even more infected (panel D). doi:10.1371/journal.pcbi.1003352.g003
short time scale, but the model could be evaluated with analogous results for SIR dynamics (see Text S1, Section G, Captions of the Supplementary Figures, Figure S1). In the first scenario (black curve, Fig. 3B), the number of sex acts grows linearly with the number of contacts respecting the average number of sex acts (SlT~6:05 during 4 weeks). In the second scenario we use a weighted network, where the joint probability distribution Pkl is obtained
from the NATSAL data (red curve, Fig. 3B) and can be complemented by a correction for assortative effects (orange curve, Fig. 3B).
The exponential growth rates of the epidemics are r0~0:021
per year for the linear, unweighted, network and r0~0:0034 per
year for the weighted network. This confirms that the ‘linear’ scenario supports faster epidemic expansion. The correction for assortative effects underestimates the epidemic prevalence in the network because in the NATSAL network heterogeneity in the number of contacts and interaction events does not lead to a strong network segregation, i.e. individuals with a single or few contacts are not isolated (see Fig. 2 and the case in which both Pkand Pl
follow power law distributions). Although the survey data shown in Fig. 3A only provide us with a rough picture of the real transmission network and although relying on the number of partners during 5 years overestimates the number of concurrent partners, the data are sufficient to confirm a remarkable reduction in the speed of epidemic expansion when shifting from a classical unweighted transmission network towards a more realistic weighted transmission network. This finding is in particular consistent with an earlier simulation study on epidemic spreading along a network of homosexual contacts [13].
The framework can also be used to follow the dynamics in the epidemic subgroups and to identify risk groups along the course of the epidemics (see Text S1, Section B, Conditional probabilities and risk groups). Fig. 3C and D show that the average number of contacts SkT and sex acts SlT per individual increases early on in the infected population and decreases in the healthy population. This reflects the over-representation of some individuals among those being infected as sketched by the insets: during the epidemic (here shown at t = 10 years) the probability of being infected grows with the number of contacts k an individual has, and even more so with the number of sex acts l (s)he has.
Discussion
Network theory has broadened our understanding of the spread of infectious agents — or other entities such as information, money, travellers or goods — in complex settings. In their simplest form, network models do not consider that contacts may show variability in their transmission capacity. However, the probability of disease transmission along a contact strongly depends on the intensity of the contact, transportation links vary in their throughput and information may not be shared equally among all possible channels. Although earlier studies have shown that this weighting in terms of interactions between contacts has non-negligible impact on the spreading dynamics, the modelling of epidemics on weighted networks largely focuses on simulation studies [13,16,32], regular networks [33], mean field approxima-tions [34,35] or discrete time dynamics [20,36]. Therefore, explicit expressions for epidemic characteristics such as the basic reproductive ratio R0are available only in special cases.
It is possible to simplify the epidemiology by using a Reed-Frost model. For this, one needs to assume that infections take place in discrete time steps, with non-overlapping generations and that each infected individual recovers with certainty one time step after infection. These simplifications allow to assess outbreak
probabilities using branching processes [20]. In this formalism, as shown in [36], R0, denoted RRF0 , can be derived as the dominant
eigenvalue of the mean offspring matrix (md,k§2), where md,k
represents the expected number of individuals with k contacts that an individual with d contacts infects considering potentially degree-dependent network weights. Importantly, it is only because Britton et al. make strong simplifying assumptions in their model, such as the independence between network weights and nodes’ degrees, that they can derive an explicit form of R0. In contrast to
our findings on NATSAL data, the Reed-Frost approach systematically predicts negative exponential growth rates of the epidemics for both scenarios (the network average of linear case is SRRF
0 T~0:2 and that of survey data case is SRRF0 T~0:1). The
discrepancy between our model and that of [20] stems from the implicit assumption of the Reed-Frost model with discrete time steps they use, which is that recovery occurs immediately after infection and therefore that c&b.
We extend earlier results by developing a framework based on partial differential equations that allows to model continuous time SIR epidemic dynamics for general weighted networks defined through the joint probability distribution for an individual to have k contacts and l interaction events. From this we are able to derive the full epidemic dynamics in terms of the number of susceptible, infected and recovered individuals over time as well as explicit expressions for the basic reproductive ratio R0and the exponent of
early epidemic expansion r0. The application of the method to
epidemics on artificial and empirically-motivated networks matches well with simulation results on these same networks. Moreover, it also stresses the impact of assortative effects introduced by contact weighting on epidemic dynamics; an aspect that will need closer attention in future research.
One limitation to our approach is due to potential errors in the inference of the network. There are known biases in the self-reporting of number of partners (with different trends between men and women [37]) and self-reported number of sex acts are likely to exhibit similar biases. One extension of this study would be to see how such noise in the network inference could affect epidemic spread. Our intuition is that the consequences should be less important than for non weighted networks because heteroge-neity in the weights is already likely to dampen striking network properties in terms of disease spread [13].
As many earlier methods, ours analyses model disease spread on networks from a node centric summary statistics, by considering the number of contacts and transmission events per time. Therefore, it inherently neglects correlation between nodes. In other words there is no consideration of assortativity between individuals based on their number of contacts or transmission events per time. At the same time, individuals share their activity randomly among all their contacts (weights are homogeneously, or multinomially, distributed among edges that leave a node), which can enforce correlations among nodes in certain networks. Also clustering is observed in many contact networks [38] and this issue should be addressed in an extended version of our model.
Most analytical and numerical models predict disease spread on network using only one summary statistics, the distribution of the number of partners. We show that additional insights can be gained, while maintaining some analytical results, by including another summary statistics, such as the distribution of the number of sex acts knowing the number of partners. These data are easier to collect than full information of the contact network (especially for a weighted network), which makes our framework widely applicable. We demonstrate this applicability here using data from the NATSAL study conducted in the UK. We note that for some artificial distributions, our results begin to diverge from simulations
on real networks. However, the framework has proven to be applicable for empirical distributions and analysis of more empirical data will allows us to further test the robustness of the method using more realistic assumptions.
Supporting Information
Figure S1 Epidemic SIR dynamics on the network as presented in Fig. 3 of the main manuscript. Transmission probability per sex act is also b = 0.01 but recovery can occur at a rate c = 0.004 per 4 weeks, i.e. parameters corresponding to Fig. 2 of the main manuscript. Different from the SI dynamics shown in Fig. 3 of the main manuscript hosts may recover and do not spread infection indefinitely.
(PNG)
Figure S2 Epidemic incidence or rate of infection bpSISG(0,1)S (1,1,t)~bpSISSlTS (cf. equation 3b) for SI dynamics
(grey line) and SIR dynamics (dark grey line) on the network as presented in Fig. 3 of the main manuscript.
(PNG)
Figure S3 Relationship between a person’s total number of sex acts and number of partners derived from the NATSAL data. In Panel A, we plot the self-reported number of sex acts over the last 4 weeks vs. the self-reported number of sexual partners over the last 4 years. In Panel B, we plot the self-reported number of sex acts over the last 4 weeks vs. the self-reported number of sexual
partners over the last 3 months. In Panel C, we plot the reported number of sex acts over the last 7 days vs. the self-reported number of sexual partners over the last 3 months. In all three cases, the data do not support a linear relationship (the number of sex acts per partner decreases with the number of partners/contacts).
(PNG)
Table S1 Model notations. (PDF)
Table S2 Agreement between approximations and simulations. (PDF)
Text S1 Supporting Information. (PDF)
Acknowledgments
Many thanks to Herve´ Monod and Elisabeta Vergu for helpful discussions and insights, Oliver Ru¨benko¨nig for consulting with the Mathematica code, and Andreas Bunten for his support in the final stages of the manuscript.
Author Contributions
Conceived and designed the experiments: CK MML SA. Performed the experiments: CK MML. Analyzed the data: CK MML. Contributed reagents/materials/analysis tools: CK MML SA. Wrote the paper: CK MML SA.
References
1. Anderson RM, May RM (1991) Infectious diseases of humans: dynamics and control. New-York, USA: Oxford University Press.
2. Newman MEJ (2002) Spread of epidemic disease on networks. Phys Rev E 66: 16128.
3. Li C, van de Bovenkamp R, Van Mieghem P (2012) Susceptible-infected-susceptible model: A comparison of N-intertwined and heterogeneous mean-field approximations. Phys Rev E 86: 026116.
4. Moslonka-Lefebvre M, Harwood T, Jeger MJ, Pautasso M (2012) SIS along a continuum (SIS(c)) epidemiological modelling and control of diseases on directed trade networks. Math Biosci 236: 44–52.
5. Durrett R (2007) Random graph dynamics. Cambridge University Press. 6. May RM, Anderson RM (1987) Transmission dynamics 548 of HIV infection.
Nature 326: 137–42.
7. Moreno Y, Pastor-Satorras R, Vespignani A (2002) Epidemic outbreaks in complex heterogeneous networks. European Physical Journal B 26: 521–529. 8. Volz E, Meyers L (2009) Epidemic thresholds in dynamic contact networks.
J R Soc Interface 6: 233–241.
9. Barrat A, Barthelemy M, Pastor-Satorras R, Vespignani A (2004) The architecture of complex weighted networks. Proc Natl Acad Sci USA 101: 3747–3752.
10. Blower SM, Boe C (1993) Sex acts, sex partners, and sex budgets: Implications for risk factor analysis and estimation of HIV transmission probabilities. J Acquir Immune Defic Syndr 6: 1347–1352.
11. Nordvik MK, Liljeros F (2006) Number of sexual encounters involving intercourse and the transmission of sexually transmitted infections. Sex Transm Dis 33: 342–349.
12. Britton T, Nordvik MK, Liljeros F (2007) Modelling sexually transmitted infections: the effect of partnership activity and number of partners on 564 R0.
Theor Popul Biol 72: 389–99.
13. Moslonka-Lefebvre M, Bonhoeffer S, Alizon S (2012) Weighting for sex acts to understand the spread of STI on networks. J theor Biol 311: 46–53. 14. Schley D, Whittle S, Taylor M, Kiss IZ (2012) Models to capture the potential
for disease transmission in domestic sheep flocks. Preventive Veterinary Medicine 106: 174–184.
15. Stehle´ J, Voirin N, Barrat A, Cattuto C, Colizza V, et al. (2011) Simulation of an SEIR infectious disease model on the dynamic contact network of conference attendees. BMC Med 9: 87.
16. Eames KTD, Read JM, Edmunds WJ (2009) Epidemic prediction and control in weighted networks. Epidemics 1: 70–76.
17. Colizza V, Barrat A, Barthe´lemy M, Vespignani A (2006) The role of the airline transportation network in the prediction and predictability of global epidemics. Proc Natl Acad Sci USA 103: 2015–20.
18. Joo J, Lebowitz JL (2004) Behavior of susceptible-infected-susceptible epidemics on heterogeneous networks with saturation. Phys Rev E 69: 66105.
19. Wang HZ, Liu ZR, Xu HH (2007) Epidemic spreading on uncorrelated hetero-genous networks with non-uniform transmission. Physica 582 A 382: 715–721. 20. Britton T, Deijfen M, Liljeros F (2011) A weighted configuration model and
inhomogeneous epidemics. J Stat Phys 145: 1368–1384.
21. Volz E (2008) SIR dynamics in random networks with heterogeneous connectivity. J Math Biol 56: 293–310.
22. Kamp C (2010) Untangling the interplay between epidemic spread and transmission network dynamics. PLoS Comput Biol 6: e1000984.
23. Serrano MA, Bogun˜a´ M, Pastor-Satorras R (2006) Correlations in weighted networks. Phys Rev E 74: 055101.
24. Keeling MJ, Rohani P (2008) Modeling infectious diseases in humans and animals. Princeton: Princeton University Press.
25. Edmunds WJ, Kafatos G, Wallinga J, Mossong JR (2006) Mixing patterns and the spread of close-contact infectious diseases. Emerg Themes Epidemiol 3: 10. 26. Wallinga J, Teunis P, Kretzschmar M (2006) Using data on social 596 contacts to estimate age-specific transmission parameters for respiratory-spread infectious agents. Am J Epidemiol 164: 936–944.
27. Schneeberger A, Mercer CH, Gregson SAJ, Ferguson NM, Nyamukapa CA, et al. (2004) Scale-free networks and sexually transmitted diseases: a description of observed patterns of sexual contacts in Britain and Zimbabwe. Sex Transm Dis 31: 380–7.
28. Johnson AM, Mercer CH, Erens B, Copas AJ, McManus S, et al. (2001) Sexual behaviour in Britain: partnerships, practices, and HIV risk behaviours. Lancet 358: 1835–42.
29. Hamilton DT, Handcock MS, Morris M (2008) Degree distributions in sexual networks: a framework for evaluating evidence. Sex Transm Dis 35: 30–40. 30. Boguna M, Pastor-Satorras R, Vespignani A (2003) Absence of epidemic
threshold in scale-free networks with degree correlations. Phys Rev Lett 90: 028701.
31. Bansal S, Grenfell BT, Meyers LA (2007) When individual behaviour matters: homogeneous and network models in epidemiology. J R Soc Interface 4: 879–891. 32. Chu X, Guan J, Zhang Z, Zhou S (2009) Epidemic spreading in weighted
scale-free networks with community structure. J Stat Mech: P07043.
33. Rattana P, Blyuss KB, Eames KTB, Kiss IZ (2012). A class of pairwise models for epidemic dynamics on weighted networks. arXiv. ArXiv:1208.6036v1. 34. Chu X, Zhang Z, Guan J, Zhou S (2011) Epidemic spreading with nonlinear
infectivity in weighted scale-free networks. Physica A 390: 471.
35. Yang Z, Zhou T (2012) Epidemic spreading in weighted networks: An edge-based mean-field solution. Phys Rev E 85: 056106.
36. Deijfen M (2011) Epidemics and vaccination on weighted graphs. Math Biosci 232: 57–65.
37. Smith TW (1992) Discrepancies between men and women in reporting number of sexual partners: a summary from four countries. Soc Biol 39: 203–11. 38. Danon L, House TA, Read JM, Keeling MJ (2012) Social encounter networks:
![Figure 3. Disease spread on a network inferred from data. A) Characteristics of the heterosexual contact network inferred from the NATSAL contact tracing study [28]](https://thumb-eu.123doks.com/thumbv2/123doknet/13751658.437761/9.918.85.814.372.922/figure-disease-network-inferred-characteristics-heterosexual-contact-inferred.webp)
