Printed in Great Britain
Trends and Challenges in Experimental
Macromolecular Crystallography
N. E. CHAYEN*1, T. J. BOGGON2, A. C A S S E T T A2§ , A. DEACON*2,
T. G L E I C H M A N N2§ , J. HABASH2, S. J. HARROP2,®,
J. R. H E L L I W E L L *2, Y. P. NIEH2, M. R. P E T E R S O N2, J. RAFTERY2, E. H. S N E L L *2 +, A. HADENER3, A. C. N I E M A N N3, D. P. S I D D O N S4, V. S T O J A N O F F4t , A. W. T H O M P S O N5 6, T. URSBY6 AND M. W U L F F6 1 Biophysics Section, Blackett Laboratory, Imperial College of Science, Technology and Medicine, London,
SW7 2BZ, UK 2
Chemistry Department, University of Manchester, Manchester, Ml3 <)PL, UK 3
Chemistry Department, University of Basle, Switzerland
* National Synchrotron Light Source, Brookhaven National Laboratory, Upton, USA
6 EMBL, Avenue des Martyrs, Grenoble Cedex, France
'ESRF, BP220, Grenoble Cedex, France
1. I N T R O D U C T I O N 2 2 8
2. P R O T E I N CRYSTALLIZATION 229
2.1 Screening and optimisation of crystallization conditions 229 2.2 Choice of crystallization methods 230
2.3 Solubility and phase diagrams 231 2.4 Control of nucleation 234
2.5 Crystallization in microgravity 235 2.6 Database of crystallization conditions 237
3. MONITORING DIAGNOSTICS OF PROTEIN CRYSTAL GROWTH 237 3.1 Light scattering 237
3.2 Video microscopy 238 3.3 Interferometry 238
3.4 Atomic force microscopy 241 3.5 Small angle neutron scattering 242
4. QUALITY CHARACTERISATION OF PROTEIN CRYSTALS 242 4.1 Rocking curves and mosaicity of the crystal 244
4.2 X-ray diffraction topography 246
4.3 Relative Wilson plots and resolution limit 246
§ EU Host Institute Fellows in Manchester.
@ Current address: School of Physics, University of New South Wales, Kensington, Australia.
+
Current address: NASA, Code ES76, Building 4464, Marshall Space Flight Center, Huntsville,
Alabama 35812, USA.
t Current address: ESRF, BP220, Grenoble Cedex, France.
• The email addresses of the principal authors to whom correspondence should be sent are: [email protected],[email protected], [email protected],[email protected]
5. SYNCHROTRON X-RAY SOURCES 248
5.1 Flux, brightness, brilliance and, a new term, fluence 248 5.2 Insertion Devices (ID's) 248
5.3 Machine emittance and crystal sample acceptance 249 5.4 Properties of the beam at the sample position and intensity of
diffraction 250
5.5 Synchrotron beam requirements in different applications 251 5.6 Criteria for the choice and design of SR sources for macromolecular
crystallography 252 6. DETECTORS 253
7. CRYO-CRYSTALLOGRAPHY 254 8. MAD PHASING 256
8.1 Principles and examples 256 8.2 Facility Developments 258
9. ATOMIC AND ULTRA-HIGH RESOLUTION DATA COLLECTION 260
9.1 Scattering efficiency 260
9.2 Case study: Concanavalin A at 0-94 .<4 resolution and beyond 261
10. DYNAMICAL STUDIES OF PROTEINS IN CRYSTALS 262 10.1 The Laue method: recent developments 263
10.2 Monochromatic large-angle methods: Weissenberg, LOT 264 10.3 Time-resolved structural studies 265
11. OVERVIEW AND CONCLUDING REMARKS: X-RAYS, NEUTRONS AND ELECTRONS 265
12. ACKNOWLEDGEMENTS 266 13. REFERENCES 266
I. INTRODUCTION
Macromolecular X-ray crystallography underpins the vigorous field of structural molecular biology having yielded many protein, nucleic acid and virus structures in fine detail. The understanding of the recognition by these macromolecules, as receptors, of their cognate ligands involves the detailed study of the structural chemistry of their molecular interactions. Also these structural details underpin the rational design of novel inhibitors in modern drug discovery in the pharmaceutical industry. Moreover, from such structures the functional details can be inferred, such as the biological chemistry of enzyme reactivity. There is then a vast number and range of types of biological macromolecules that potentially could be studied. The completion of the protein primary sequencing of the yeast genome, and the human genome sequencing project comprising some io5 proteins that is underway, raises expectations for equivalent three dimensional structural databases.
Such aspirations set the scene for a terrific experimental challenge to macromolecular crystallography. Indeed there has already been a tremendous
acceleration of the method in the last 15 to 20 years. This has been via the harnessing of synchrotron X-ray sources, as well as more powerful detectors. In addition, computer hardware capability, both involving compute engines and molecular graphics, and software have evolved greatly too. Quite an emphasis is put on protein crystal growth and characterisation methods aspects in this review. It also includes synchrotron sources, detectors, cryocrystallography, structure determination by MAD, and atomic resolution protein refinement, as well as the development of time-resolved methods (especially Laue diffraction) for the direct study of structure and reactivity. The context of X-ray diffraction methods compared with other probes of the structure of matter, namely electrons and neutrons, are then mentioned in the overview and concluding remarks.
2. PROTEIN CRYSTALLIZATION
The preparation of diffraction quality crystals is a key area of technical research and development. It is still not understood why many proteins stubbornly refuse to produce suitable crystals while others, from a wide range of different species, do crystallise easily. The task of overcoming the bottleneck to produce suitable crystals (i.e. finding optimal conditions for growing protein crystals) is tackled by two major approaches: The first approach is to devise practical techniques (based mainly on trial and error) for growing protein crystals; a second approach is to make attempts to understand the crystallization process and use that knowledge to design experiments for obtaining better diffracting crystals. Books on the subject are from McPherson (1982) and Ducruix & Giege (1992). Monitoring of crystal growth and crystal characterisation techniques are described in sections 3 and 4. 2.1 Screening and optimisation of crystallization conditions
Once a lead is obtained, crystallization conditions can generally be optimised by varying the parameters involved (precipitant, pH, temperature etc.). However, there is generally no indication that one is close to crystallization conditions until a crystalline precipitant or the first crystals are obtained. Consequently, crystallization breaks down naturally into two aspects: screening, where one tries to obtain crystals of any description, and optimisation, where one tries to improve the size and diffraction-quality of the crystals.
There have never been any set rules or recipes as to where to start off when attempting to crystallise a new protein. Efficient methods were therefore required to help the experimenter. A major aid involves use of multifactorial screens (e.g. Carter, 1990, 1992; Weber, 1990; Jankarik & Kim, 1991; McPherson, 1992; Cudney et al. 1994a; Kingston et al. 1994).
The idea of screening was introduced already in 1979 (Carter & Carter, 1979), but did not become popular because the numerous experiments which were necessary for screening required repetitive pipetting which is laborious, time consuming and boring. However, with the development of automatic means of dispensing crystallization trials (e.g. Cox & Weber, 1987; Ward et al. 1988; Chayen et al. 1990, 1992, 1994; Rubin et al. 1991; Oldfield et al. 1991, Soriano &
Fontecilla-Camps, 1993; Sadaoui et al. 1994) screening procedures have taken on a new dimension. Consequently the combination of automation together with the availability of screening procedures is probably the major advance of recent years in the field of protein crystallization.
2.2 Choice of crystallization methods
Vapour diffusion is the most widely used technique and has produced more crystallised macromolecules than all other methods combined. Batch and dialysis have generated a smaller number of crystals, while free interface diffusion appears to have been less successful (McPherson et al. 1995). Handling difficulties associated with microdialysis are leading to the increased popularity of batch methods, particularly the microbatch technique, which automatically dispenses small trials (1-2 /i\ final volume) under oil (Chayen et al. 1990, 1992, 1994).
Diffusion methods involve an aqueous drop containing the protein solution and a reservoir which gradually acts to concentrate the ingredients in the protein drop until equilibrium is reached. In batch, the protein to be crystallised and the crystallising agents are mixed at their final concentrations at the start of the experiment, and conditions remain constant as no equilibration is required.
(Baldock et al. 1996) compared the outcome of screening experiments performed by vapour diffusion and microbatch, concluding that both methods should be applied to ensure full coverage of all possibilities. The authors also suggest strategies for screening depending on how much protein, time and manpower are available to the experimenter. Since many of the more interesting proteins are mostly available in limited supply there is demand for techniques which rapidly obtain as much information as possible on a protein whilst using the smallest possible quantity of material.
One method for saving on material is the automated microbatch method which was developed for screening and optimising crystallization conditions on a microgram scale (Chayen et al. 1990, 1992, 1994). A computer controlled microdispenser (IMPAX) automatically dispenses crystallization drops (final volume of 1-2 /i\) containing the protein and the precipitating agents. These drops are dispensed through a very fine tip as batch trials under oil where they are protected from evaporation, contamination and physical shock by the oil. A hundred trials can be prepared using approximately 1 mg of protein.
When favourable conditions for crystallization have been found using the screening mode of the system, the size and quantity of crystals are optimised by a second phase of work which generates a set of conditions throughout the regions of the conditions that are of interest. Crystals of diffraction size and quality have often been grown in 1 /il drops. Using this approach, many proteins have been crystallised, among them some which did not yield crystals otherwise (e.g. Wilson
et al. 1991; Normile, 1995; Chayen et al. 1996 a) .
Refinements of the microbatch technique for both the screening and optimisation stages allows the evaporation rate from trials to be regulated (D'Arcy
Although microbatch has the advantage of consuming less protein than other methods, not every case is suitable for crystallization under oil, especially not samples containing small organic molecules, which are soluble in oil (N. E. Chayen, unpublished). New developments of the IMPAX automated crystallization system facilitate vapour diffusion trials to be conducted using quantities which are almost as small as those used in microbatch (Chayen et al. 1994). Stura et al. 1994 introduced a procedure named reverse screening to be used in cases of limited supply of a macromolecule. The vapour diffusion method is preferred due to its ability to concentrate the protein and the precipitating agents. The search is focused on a reduced set of conditions chosen on the basis of previous experience, specific information about the macromolecule or on information from the crystallization database. Solubility information obtained from the chosen precipitants is used to select conditions for nucleation and growth.
A new screening protocol which employs less classical precipitating agents and electrostatic crosslinking agents was introduced by Cudney et al. (1994 a). Based on the experience of Riess-Husson (1992) the authors also demonstrated the value of a detergent screen for optimising conditions for soluble proteins as well as membrane proteins. Further precipitants were introduced by Patel et al. (1995) and by Brzozowski and Tolley (1994) who used polyethylene glycol monomethyl ethers (as alternative precipitants to the common polyethylene glycols) for crystallization and for the improvement of existing protein crystals. McPherson (1995) reported a means for increasing the size of the microcrystals by fine-tuning of the pH at the high and the low ranges of the pH values at which any crystals appear, rather than just focusing on optimisation of the middle-range of pH.
Crystallization in gels has been shown to improve crystal quality by reducing sedimentation, convection and twinning since the use of gels presents experimental conditions which are unattainable in solution crystal growth (Robert & Lefaucheux, 1988; Robert et al. 1992; Cudney et al. 19946; Sica et al. 1994; Thiessen, 1994). Refinements of gel crystallization techniques include methods of growing crystals by microdialysis and vapour diffusion in gels (Thiessen, 1994), growth of crystals in ' gelled' hanging or sitting drops (Bernard et al. 1994) and the gel acupuncture method where the crystals grow inside an X-ray capillary, thereby also allowing continous monitoring of the crystals as they grow (Garcia-Ruiz & Moreno, 1994).
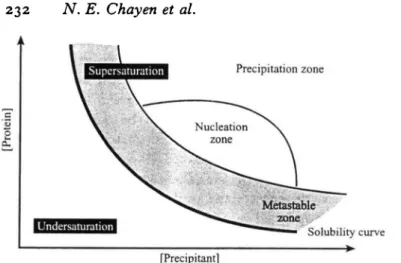
2.3 Solubility and phase diagrams
Crystallization is a phase transition phenomenon. Protein crystals grow from an aqueous protein solution, when the solution is brought into supersaturation (Ataka, 1993).
A phase diagram for crystallization shows which state (liquid, crystalline or amorphous solid [precipitate]) is stable under a variety of crystallization parameters. It provides a method for quantifying the influence of the concentrations of protein, precipitant(s), additive(s), pH and temperature on the
.5
Precipitation zone
Solubility curve
[Precipitant]
Fig. i. Schematic drawing of a protein crystallization phase diagram. (Based on Fig. i of Saridakis et al. 1994).
production of crystals, thus phase diagrams form the basis for the design of crystal growth conditions (Reis-Kautt & Ducruix, 1992; Mikol & Giege, 1992; Ataka,
1993; Saridakis et al. 1994; Stura et al. 1994).
Fig. 1 shows an example of a typical phase diagram based on two of the most commonly varied parameters: protein and precipitant concentration. The figure schematically illustrates four possibilities: (a) where the protein will just precipitate; (b) where spontaneous nucleation will take place; (c) an area of lower supersaturation just below the nucleation zone where crystals are stable and may grow but no further nucleation will take place (this 'zone' is referred to as the metastable zone which is thought to contain the best conditions for growth of large well ordered crystals); (d) an undersaturated area where the protein is fully dissolved in the solution and therefore will never crystallise.
Crystallization proceeds in two phases, nucleation and growth. A pre-requisite for crystallization is the formation of nuclei around which the crystal will grow. Nucleation requires a higher degree of supersaturation than the growth (Stura & Wilson, 1990; Mikol & Giege, 1992). The solution is brought to a supersaturated state by varying factors such as the concentrations of precipitant, protein, additives, and/or pH, temperature etc. Once the nucleus has formed, growth follows spontaneously. Often thousands of tiny crystals are formed instead of the desired large single crystals. The ability to separate the stages of nucleation and growth can provide the experimenter with a means to control a crystallization trial and direct it in the way that the experimenter would like it to proceed.
A practical means of separating the phases of nucleation and growth is by seeding. A variety of seeding techniques have proved very successful as reviewed in detail by Stura & Wilson (1990, 1992). However, seeding involves handling of often.fragile crystals and numerous trials for finding the optimal conditions in which to place the seed. Methods which would by-pass these difficulties are needed."
An easier way of conducting trials with a similar outcome to seeding is by use of dilution. Yonath et al. (1982) & Pryzbylska (1989) diluted the reservoir of a
hanging drop to slow crystal growth after nucleation. They had some success, but because vapour diffusion is a dynamic system where conditions are changing during the crystallization process it was not easy to determine which stage of the experiment was optimal for intervention. Such dilution experiments are much more reliable and reproducible in a batch system where the volume and composition of a trial drop are known and remain constant.
Saridakis et al. (1994) used the automated microbatch technique to establish a phase diagram for the enzyme carboxypeptidase G2. The concentrations of the
protein and precipitant were varied, while pH and temperature were kept constant. The conditions for nucleation were found by means of an automated system and 2 fi\ drops were set up as microbatch trials under these conditions. Some time later the drops were automatically diluted by the machine which inserted a fine tip into the drops and added a diluent. It took several weeks to find the optimum time and exact amount with which to dilute but once these factors were established single diffracting crystals were routinely obtained, equivalent to the best, very rarely obtained without using the dilution procedure.
Although phase diagrams offer one of the basic and most important pieces of knowledge necessary for growing protein crystals in a rational way, they are not often employed because accurate quantitative phase diagrams require numerous solubility measurements. The solubility is defined as the concentration of protein in the solute which is in equilibrium with crystals. Reaching this state of equilibrium can take several months (Ataka & Tanaka, 1986; Ataka & Asai, 1988; Ataka, 1993) because macromolecules diffuse so slowly. An additional limiting factor is the large quantity of sample required for solubility measurements. Hence, most phase diagrams and solubility studies have been performed with proteins which are plentiful in supply such as lysozyme (e.g. Howard et al. 1988; Ries-Kautt & Ducruix, 1992; Ewing et al. 1994), concanavalin A (Mikol & Giege, 1989), glucose isomerase (Chayen et al. 1988, 1989), canavalin (DeMattei & Feigelson, 1991) and cases of phase diagrams for membrane proteins have been reported (Odahara et al. 1994).
A method which accelerates the time needed for equilibrium to be achieved, by pumping protein solutions over a column packed with protein crystals was devised by Pusey & Gernert (1988) and Pusey & Munson (1991). Using this method, they determined a saturation equilibrium point within 24 hours.
Rosenberger et al. (1993) developed a scintillation method for determining the temperature dependence of the solubility, and of nucleation induction times of proteins in 50-100 /il volumes of solution in a space of a few hours. They used the data for the controlled separation of the nucleation and growth stages by changing the temperature when nucleation was observed (by means of light scattering). The authors invariably succeeded in limiting the number of crystals grown.
A technique which is increasingly being applied to determine the solubility of a protein within several hours is Michelson interferometry (Sazaki et al. 1996). Seed crystals of a chosen protein are grown in a cell designed for interferometric observation (Komatsu et al. 1993; Miyashita et al. 1994). The fringes around the crystals bend upwards or downwards with changes in temperature, corresponding
to either growth or dissolution of the crystals and remain flat at the equilibrium temperature for specific conditions. Using such interferometric techniques one can judge whether a solution is under- or super- saturated within approximately 20 minutes at each condition. Interferometry as a monitoring method is discussed further in section 3.3.
The three techniques mentioned above are powerful tools to measure the solubility accurately and can be applied within real time to improve the crystallization conditions. However, they still require relatively large quantities of protein (50-1000 fil), instrumentation and expertise, which in combination are not readily available. These previous studies have alerted the crystalliser to the fact that phase diagrams do need to be considered and have led to the development of methods to produce 'working phase diagrams' for more rapid use in rinding conditions for crystallization. A simple way of by-passing the technical difficulties in obtaining a phase diagram for the purpose of rapidly finding conditions for crystallization was devised by Shaw Stewart and Kahmisa (1994) by simply identifying the boundary of the nucleation zone using predispensed gradient matrices. A 'working phase diagram' was constructed in approximately 4 hours by Korkhin et al. (1995) using the automated microbatch technique to dispense six protein concentration values vs. 24 different precipitant concentrations. Conditions for microseeding were predicted from that phase diagram and, following seeding, crystals of a bacterial enzyme diffracting to 2 A were grown reproducibly. Stura et al. (1994) introduced a 'footprint solubility screen' to map out the solubility characteristics of a macromolecule. Typically, just four different precipitant concentrations at two or more protein concentrations are used.
2.4 Control of nucleation
Often thousands of tiny crystals are formed in a crystallization trial. The control of nucleation could instead provide a few nucleation centres which should grow into larger crystals. The use of temperature is a powerful tool to control nucleation (and also growth). It is advantageous over other methods for variation of the supersaturation because using temperature, the change of conditions is achieved without adding anything to the crystallization mixture. Crystallization by means of variation of temperature and application of temperature gradients have successfully been applied to protein crystallization on the ground (e.g. Feigelson & DeMattei, 1992; Rosenberger et al. 1993; Blow et al. 1994) and also in microgravity (Long et al. 1995). The problem remains, unfortunately, that not many proteins are sensitive to a temperature change.
The methods described above apply mainly to homogeneous nucleation. Yet nucleation can be initiated by a solid material in the crystallization medium, on which the growing crystal can form. This may happen on the wall of the crystallization vessel, on a crystalline surface (McPherson & Schlichta, 1988), on a foreign particle (Malkin et al. 1993) or on a biological contaminant (Chayen et
heterogeneous nucleants in a controlled manner (McPherson & Schlichta, 1988; Chayen et al. 1993).
Control of nucleation requires extremely clean solutions. The combination of modern filtration methods, which allow the removal of particles from small volumes, with the possibility of dispensing trials under oil where solutions are protected from contaminants present in air, creates ideal conditions for nucleation experiments. Chayen et al. (1993) have found that filtration of a crystallization trial through a 300000 MW cut-off filter can prevent nucleation under conditions previously considered as standard. This was confirmed by Hirschler et al. (1995). The nucleation and consequently the number and size of lysozyme and of carboxypeptidase G2 crystals was controlled at will by the addition of different
quantities of a nucleant to filtered trials containing these proteins (Chayen et al. 1993; Blow et al. 1994).
Solid surfaces can also have nucleation properties, which can be manifest even after filtration. Blow et al. (1994) succeeded in significantly reducing nucleation by reducing the area of contact between a crystallization sample and its supporting vessel simply by altering the dispensing procedure of microbatch trials. Creating a situation of ' containerless crystallization' by suspending a crystallization drop between oils of two densities (Blow et al. 1993) or in a density gradient further reduces the contact between the vial and the crystallization sample, leading to reduced nucleation but not eliminating it completely (Chayen, 1996; Lorber & Giege, 1996).
Experiments using high hydrostatic pressure have shown that pressure can influence the nucleation and growth of protein crystals (Suzuki et al. 1994; Lorber
et al. 1996).
Crystallization in gels has also been utilised to promote or inhibit nucleation depending on the type of gel applied (Robert et al. 1992, Cudney et al. 19946) and contamination studies (using various contaminants in the crystallization media), parallel to ones performed in solution (e.g. Abergel et al. 1991; Chayen et al. 1993; Lorber et al. 1993; Sazaki et al. 1994) have been conducted in gels (Provost & Robert, 1995; Hirschler et al. 1995).
2.5 Crystallization in microgravity
Microgravity is an important parameter for the exploration of crystal growth because sedimentation and convective mixing are eliminated (Walter, 1987); thus microgravity offers a slower, more homogeneous growth medium compared to growth on Earth, and is therefore likely to improve the degree of perfection of the crystals (see section 4.1). A number of reports show that crystallization of macromolecules in microgravity does indeed improve the quality of crystals obtained, considered in different ways (e.g. McPherson, 1993; DeLucas et al. 1994 (and references cited therein); Koszelak et al. 1995; Helliwell et al. 1995; Snell et al. 1995; Chayen et al. 19966).
It has been shown that the optimal conditions for crystallization in microgravity are not necessarily identical to those on Earth (Strong et al. 1992; Chayen, 1995),
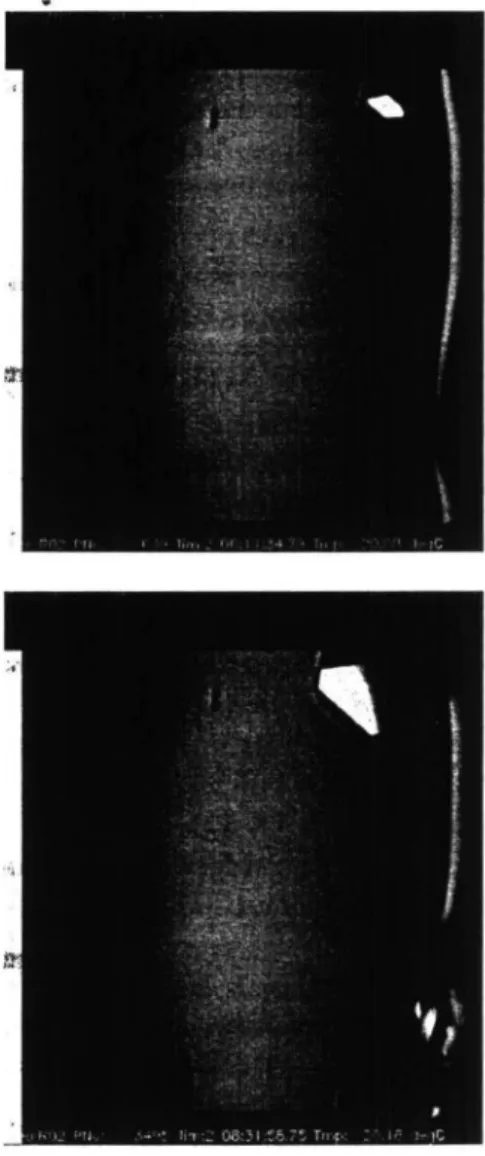
Fig. 2. Video sequence of growing crystals, aboard the NASA IML-2 Shuttle, of
(a) lysozyme at times, after the start of the mission, of 37 (top left), 54 (top right), 80
(bottom left) and 297 (bottom right) hours (from Snell et al. to be published); and (6) apocrustacyanin Ci at 8 hour intervals (from Chayen et al. 1996c).
hence apparatus for conducting both screening and diagnostic experiments in microgravity is now available using all methods of crystallization (e.g. DeLucas et
al. 1994; Snyder et al. 1991; Bosch et al. 1992). An increasingly popular apparatus
for flights is the Advanced Protein Crystallization Facility (APCF), built by Dornier under contract from the European Space Agency, which is now in the process of being upgraded to a 'Protein Crystallization Diagnostic Facility (PCDF)'. This will allow in situ diagnostics such as light scattering and interferometry as well as video microscopy. The latter diagnostic is already available with the APCF. See section 3 for details of such techniques.
2.6 Database of crystallization conditions
With the more sophisticated tools now available for searching and for optimising conditions for crystallization the labour and time required to obtain good crystals of a new protein is being considerably reduced, as indicated by the recent increase in the number of crystallization reports in the literature. A Biological Macromolecule Crystallization database facilitates access to macromolecular crystallization procedures and conditions for over 2300 crystal forms (Gilliland et
al. 1994).
3. MONITORING DIAGNOSTICS OF PROTEIN CRYSTAL GROWTH
The science of protein crystal growth is still young with many crystals resulting from empirical (albeit quite successful) methods. By monitoring the crystallization process with diagnostic instruments the crystal growth process can be examined and an understanding gained to optimize the process. Ultimately diagnostic measurements of e.g.. solution properties and growth rates will provide a picture of crystallization phenomona and a quantitative foundation for its modelling (McPherson et al. 1995).
Diagnostic monitoring techniques used should, ideally, be non-invasive to the system being studied and, indeed, more readily available to the protein crystallographer. Optical methods include light scattering, interferometry measurement and visual observation of the growing crystal. A promising technique is atomic force microscopy. Neutron scattering has also produced very valuable information. Finally, mosaicity, X-ray topographic techniques, and diffraction resolution assessment, give an indication of how successful the crystal growth process has indeed been. These latter methods and approaches will be discussed in section 4.
3.1 Light scattering
Dynamic and static light scattering are sensitive techniques to detect variations in the size and interactions of protein molecules in solution. They are useful for monitoring the pre-nucleation/nucleation state of the system, although the interpretation of the resulting measurements can differ (Pusey, 1991;
Rosenberger, 1996). Both methods can make use of the same optical apparatus with appropriate differing processing electronics.
Dynamic light scattering measures the intensity fluctuation caused by Brownian motion of the particles, within the detection volume, over time using correlation methods. It allows measurement of the nuclei until they reach a size suitable for visual observation (approx. 20 micron). With a knowledge of solvent viscosity, refractive index and sample temperature the frequency of fluctuation can be related to diffusion coefficients or hydrodynamic radii of the particles. Dynamic light scattering has been used with lysozyme showing an apparent increase in hydrodynamic radius as supersaturation proceeds (Mikol et al. 1989). Static light scattering measures the mean scattered intensity of all particles within the detection volume. With comparative techniques of calibration the static structure factors, molecular weight, virial coefficient and radius of gyration can be determined. Static light scattering can successfully detect the nucleation point of lysozyme, indicated by a sudden increase in relative scattered intensity (Casay & Wilson, 1992).
3.2 Video microscopy
Once nucleation has occurred and the crystal growth phase is starting, visual observation with a microscope becomes a powerful diagnostic technique (Koszelak
et al. 1991). By using a recording medium for images, i.e.. photographic film or
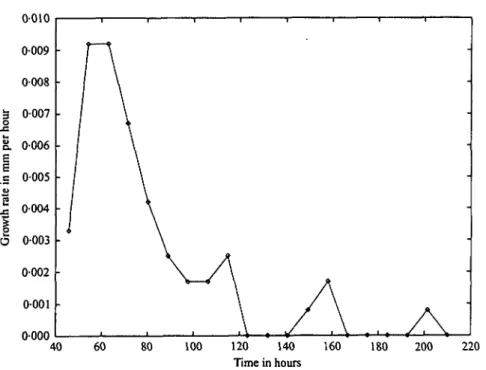
electronic storage, time-lapse images reveal the rate of growth and morphology. If a colour camera is used, additional information can be obtained by observing the birefringence using a polariser and analyser. Video monitoring has been used successfully for microgravity experiments in the European Space Agency, Advanced Protein Crystallization Facility; Fig. 2 illustrates some of the black and white CCD images obtained over time. From such images an estimate of the growth rate of a crystal can be made, in the case shown indicating in fact spurts of growth and periods of inactivity in the growth process (Fig. 3). Correlation of such observations with the mosaicity of a crystal, observed both by X-ray rocking curve (Helliwell et al. 1995; Snell et al. 1995) and X-ray topography (Stojanoffet
al. 1996) measurements is in progress.
Video microscopy observation is also useful for pinpointing crystals to be further investigated by other diagnostic techniques, e.g. Michelson and Mach-Zehnder interferometry.
3.3 Interferometry
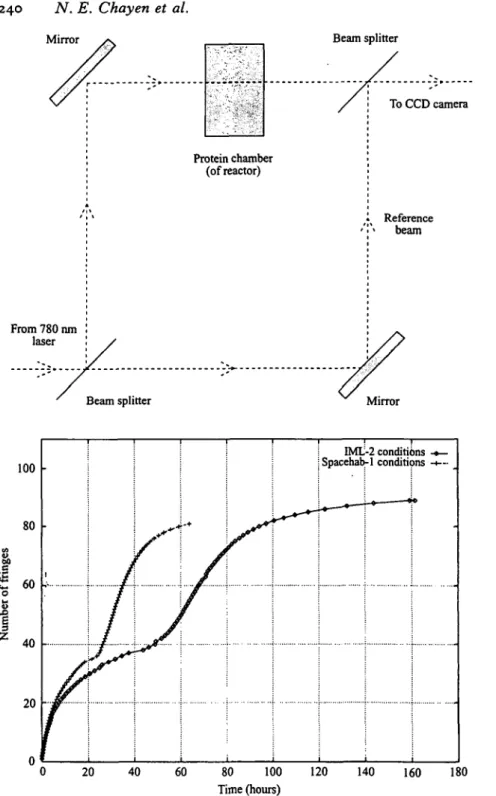
Several types of interferometer schemes are applicable to monitoring crystallization (Shlichta, 1986). Two successful types of interferometry that have been applied to monitoring crystal growth are Mach-Zehnder and Michelson interferometry. The Mach-Zehnder interferometer is suited to monitoring the global solution changes within the crystallization chamber and changes in concentration of solvent/protein around the growing crystal. The Michelson interferometer is used for direct measurement of growth of the crystal surface.
60 80 100 120 140 Time in hours
160 180 200 220
Fig. 3. Growth rate versus time derived from Fig. 2a, of lysozyme crystals shows spurts of crystal growth and then quiet periods.
The sensitivity of both types of interferometry can be greatly increased by phase shifting (Burning et al. 1974) and with suitable design of the crystallization reactor, can both be used simultaneously.
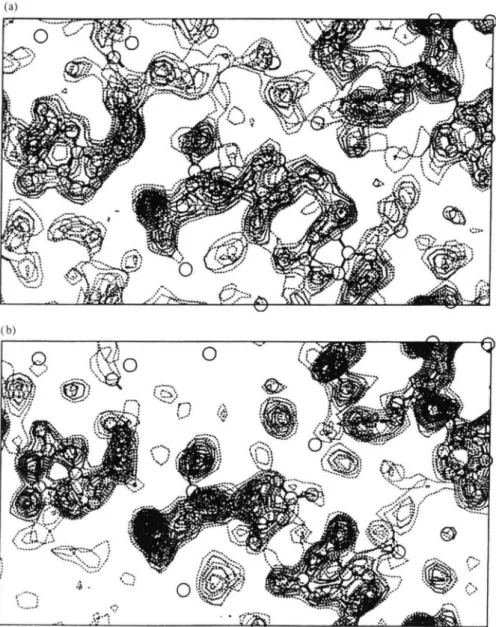
In the Mach-Zehnder interferometer any change in concentration of the solution will affect the refractive index producing interference fringes between the measuring and reference beams. Fig. \a shows a schematic of a Mach-Zehnder interferometer. The continual monitoring of such fringe patterns has been used to observe the crystallization of lysozyme (Snell et al. 1996; Boggon et al. to be published). By monitoring the rate of interference fringes passing through the crystallization chamber the concentration of salt as precipitant and the protein in solution can be determined over time. With the addition of phase shifting it is possible to measure the concentration boundary around the growing crystal (Onuma et al. 1993) although for this kind of observation the thickness of the solution layer should not be too great (Komatsu et al. 1993). Fig. 46 shows that the effect of simply altering the salt concentration is effectively monitored via the fringe pattern.
The Michelson interferometer is constructed such that the measuring beam is reflected by the growing crystal surface. Any change in the crystal surface will alter the distance the light travels causing shifts in interference fringes with respect to a reference beam. This is a very sensitive technique for measuring vertical displacement. Chernov et al. (1988) pioneered the use of Michelson interferometry for studying the kinetics of crystal growth It has also been used
Mirror Beam splitter
Beam splitter Mirror
100 80 60 40 -20 1 / / / -+ IML Spacehab • — • — -2 conditi -1 conditic -» » >ns -*— >ns H — _ 20 40 60 80 100 Time (hours) 120 140 160 180
Fig. 4. Mach-Zehnder interferometry of lysozyme crystal growth (a) schematic of the interferometer; (b) a graph of the cumulative number of fringes passing an observation window; note the effect at 40 and 27 hours which corresponds to the reversal of the direction of motion of fringes attributable to the start of protein leaving solution going into crystals for two different salt concentrations. (From Snell et al. 1996; Boggon et al. to be submitted).
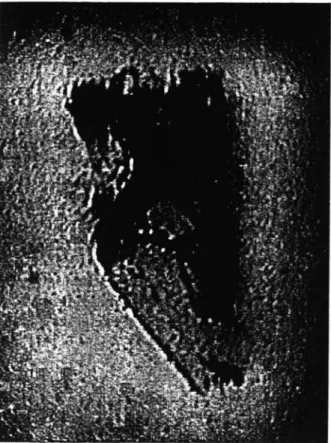
Fig. 5. In situ atomic force microscopy (AFM) image showing two and three dimensional nucleation on the surface of an STMV crystal (area 15x15 /im!). Planar defects are also present in this series as well as a number of other sources of step generation, almost all of them created by the same mechanism of three dimensional nucleus absorption and development. Although two dimensional nucleation is also present, growth from such sources contributed only marginally to the overall growth of the crystal. An adsorbed microcrystal is visible in the upper left corner of the image. This microcrystal did not produce growth steps, being apparently misoriented with respect to the underlying crystal, and was ultimately incorporated into the growing crystal. Based on Kuznetsov et al. (1996).
very successfully in studies of lysozyme (Vekilov et al. 1995) concanavalin, thaumatin and turnip yellow mosaic virus (Kuznetsov et al. 1995).
3.4 Atomic force microscopy
The atomic force microscope records the interatomic forces between the apex of its tip and the molecules in a growing crystal sample. The tip touches the surface with a very low force (Land et al. 1995), such that damage is minimised. The tip is deflected by the surface topography of the atoms and molecules. Scanning can be repeated over a two dimensional area (e.g. 20 x 20 micron2) with high precision for many days. In a study of canavalin growth (Land et al. 1995) molecular hillocks formed by multiple independent acting screw dislocation sources. Whilst growth occurred in monomolecular steps there was continual formation of a large number of molecular clusters on the terraces. Further studies on a sample of
proteins and viruses have revealed a diverse range of growth mechanisms, as well as sedimentation of microcrystals, Fig. 5 (Kuznetsov et al. 1996; Malkin et al. 1995, 1996).
3.5 Small angle neutron scattering
Recently, small angle neutron scattering has been applied as a diagnostic technique of the crystallization process (Niimura et al. 1994, 1995). The wavelength of cold neutrons used was around 10 A, i.e. the same order of magnitude as the size of protein molecules. The neutrons are scattered by the protein molecules, and sensitive then to their aggregation state. Since neutrons penetrate deeply into materials the crystallization process in bulk can be monitored. The energy of the neutrons is low so that non-destructive real-time monitoring is therefore realisable on the time evolution of the crystallization process for up to more than 1 day.
4. QUALITY CHARACTERISATION OF PROTEIN CRYSTALS
The key aims of protein crystallography are to produce an accurate structural model of the protein under study and relate the structure to the protein's function. The ability to do this depends on the quality of the diffracting crystal. In a protein crystal there are three types of disorder that may be present. Firstly, an average disorder of the molecules about the lattice points, secondly, specific defects and dislocations at the atomic level and, thirdly, the overall 'mosaic' structure of the crystal.
In the first type of disorder all (or virtually all) of the molecules within the crystal are very close to the mean orientation and the lattice point position, having a scatter about the lattice point roughly that of the average statistical disorder of all the molecules in the crystal. In essence, all of the molecules are reasonably ordered and the resolution limit of the X-ray diffraction data gives a measure of this average residual statistical disorder in conjunction with thermal vibration, which is, in essence, taken account of by 'B-factors'.
Specific defects and dislocations, the second type of disorder, contribute not to the crystal diffraction intensities but only to the X-ray background scatter. Defects and dislocations will therefore reduce the number of usefully scattering unit cells, to which the intensity is proportional, whilst at the same time increasing the diffuse scatter or background. The estimated error in intensity includes a measure of this scatter.
The crystal may have a mosaic structure, the third type of disorder, where there are several (or many) three dimensional regions of a crystal slightly misaligned to each other (Darwin, 1922). In the limit of very many small 'mosaic blocks' a crystal will have a crumbly nature (Stojanoff et al. 1996). This will cause spreading out of spots with distance from the crystal. In the minimisation of such effects, i.e. with a more perfect crystal, and with a correspondingly fine beam collimation, large crystal to detector distances (and/or fine angle scans) in X-ray data collection can be used. Hence, since the X-ray background under a reflection falls off as the
(a) 60000
Microgravity crystal -*— Earth grown crystal -<--(16 16 0) reflection (*) O
a
i
800 •18 8-20 8-22 8-24 Scan step in degrees8-26 8-28
-24-36 -24-38 -24-4 -24-42 Scan step in degrees
-24-44 -24.46
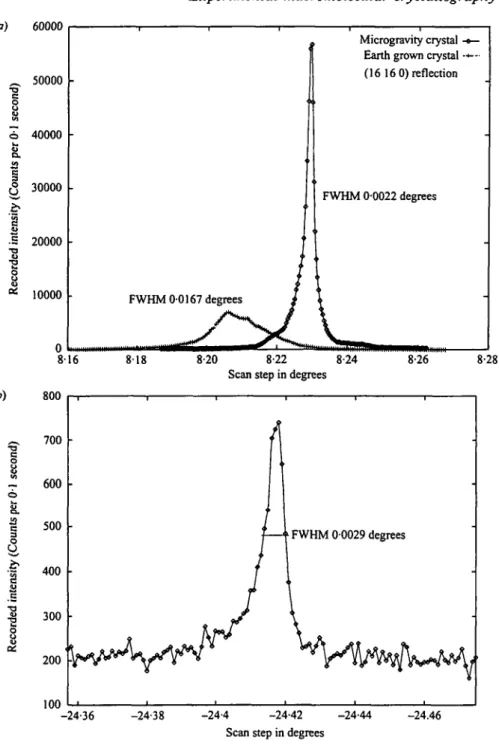
Fig. 6. Rocking curves (a) for the (16 160) reflection for microgravity versus earth grown lysozyme crystals; and (b) the (32 57 o) reflection, at vz A resolution for the microgravity grown lysozyme crystal. (Based on Helliwell et al. 1995; Snell et al. 1995).
inverse square law, then the peak to background of measurement can be improved (Helliwell, 1988). Such matters have practical importance in protein structural studies in terms of the quality and resolution of the X-ray crystallographic analysis achieved. The relevance also of such considerations to the design of synchrotron
X-ray machines in general, and machine emittance in particular, is discussed in section 5. Of course individual mosaic blocks in a protein crystal would contain identical protein structures! Mosaic blocks are purely a geometrical feature of a given protein crystal (see sections 4.1 and 4.2).
The different types of crystal disorder can be examined via X-ray rocking width measurements and topographic techniques. Overall, of course, the X-ray scattering strength of a crystal is assessed in terms of its diffraction resolution limit.
4.1 Rocking curves and mosaicity of the crystal
Strong intensity reflections can be used to estimate the sample mosaic spread or mosaicity. As such it is much more independent of reflection data processing techniques than the assessment of the resolution limit. The mosaicity gives an overall indication of the protein crystal geometric perfection. It is a parameter associated with the mosaic crystal model (Darwin, 1922), and which is commonly used to define ideally imperfect crystals. A mosaic sample is conceptualised as an assembly of a number of perfect domains slightly misorientated with respect to each other (e.g. each of a size greater than a few microns). The mosaicity is the actual angular misalignment of each block with respect to every other block. The mosaicity is a convolution of the intrinsic rocking width of each block and the angular misalignment of blocks. Assuming a perfect, single domain, protein crystal with typical unit cell dimensions, values calculated on the basis of dynamical theory of the mosaicity are less than 0-0003° (Helliwell, 1988). The experimental rocking width of a particular reflection is, however, a convolution of the overall sample mosaicity with the X-ray beam geometric and spectral parameters. It depends also on the coordinate of a reciprocal lattice point and the precise way in which it passes through the Ewald sphere (Greenhough & Helliwell, 1982). Accurate estimates of the beam parameters can be made and deconvoluted out, provided the magnitude of these beam ' smearing' parameters do not dominate the intrinsic mosaicity of the sample. There may also be anisotropies in the mosaic spread, which in the limit of a perfect crystal are simply related to the shape of the crystal (i.e. the number of unit cells in any given direction).
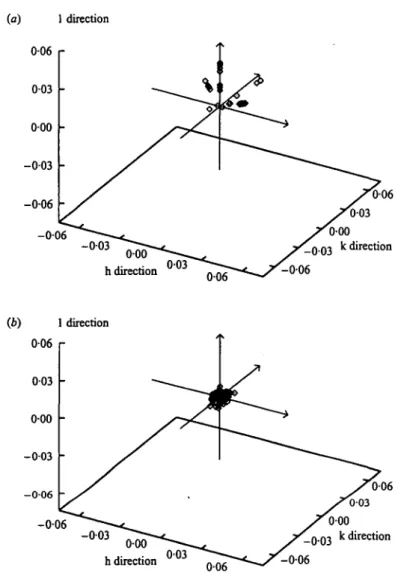
These methods have been used in a comparative analysis of protein crystals grown on earth and in microgravity. Fig. 6 a shows an example with the (16 160) reflection for an earth and a microgravity grown lysozyme crystal (Helliwell et al. 1995; Snell et al. 1995). The measurements were made with a high resolution diffractometer on the Swiss-Norwegian beamline of the European Synchrotron Radiation Facility. The microgravity crystal shows a peak height 8 times that of the earth grown one, a factor of four of which is due to increased crystal quality i.e. after taking into account the relative crystal sizes. This serves as an example of how a high quality crystal can improve the signal to noise. This will result in measurable diffraction to an increased resolution (Fig. 6b). Fig. 7 shows a summary of the reflection mosaicities plotted out for an earth and a microgravity
-003 006 k direction h direction 003 006 - 0 0 6 (b) 1 direction 006 r h direction 003 006
Fig. 7. Mosaicity plots of lysozyme (a) earth grown crystal; and (6) microgravity grown crystal.
grown lysozyme crystal. The reduction of mosaicity in Fig. 76 over 7a is very clear.
An example of anisotropic mosaic spread, and a comparison of microgravity versus earth grown crystals, is found in a study of apocrustacyanin Ci. Here there was not a consistent improvement overall due to microgravity (Snell et al. to be published). However the best peak to background of a reflection for this protein is for a microgravity grown crystal. Correlation of these rocking curve observations with the video time lapse photography shows that, for the vapour diffusion crystallization method employed in microgravity, the growing crystals are moving (Chayen et al. 1996 c) in a manner expected for Marangoni convection (Molenkamp et al. 1994; Savino & Monti, 1996). It will be interesting to see if consistent crystal quality achievements can be obtained with microgravity with a linear, liquid-liquid or dialysis method, for which convection, as well as
sedimentation, is absent in microgravity. Likewise if crystal movement is deliberately induced, using the Marangoni convection effect in e.g. the vapour diffusion case, will the crystal quality show deterioration ?
4.2 X-ray diffraction topography
X-ray diffraction topography involves illumination of a crystal with a planar wave front, either involving a monochromatic or polychromatic beam. The resulting diffraction pattern is detected on a high spatial resolution detector (e.g. fine grain film). Each diffraction spot on the film is a topographic image, a direct image, of the region of the crystal exposed to the X-ray beam. The varying contrast observed in each image is either due to orientation or extinction. The resulting topographs produced are direct images of the whole crystal showing varying contrast throughout a crystal in each spot. Orientation contrast results from the misalignment between different perfectly diffracting regions (blocks) of the crystal. Extinction contrast arises from distortions of the crystal lattice around a defect giving rise to different diffraction conditions from those in the surrounding lattice of the crystal.
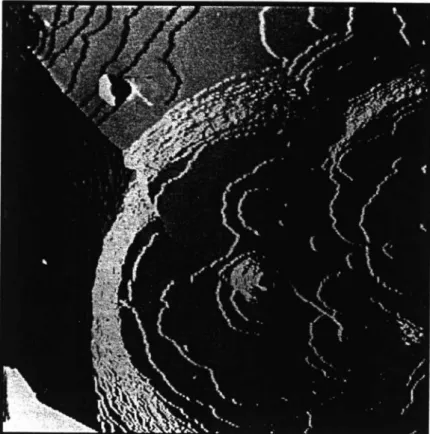
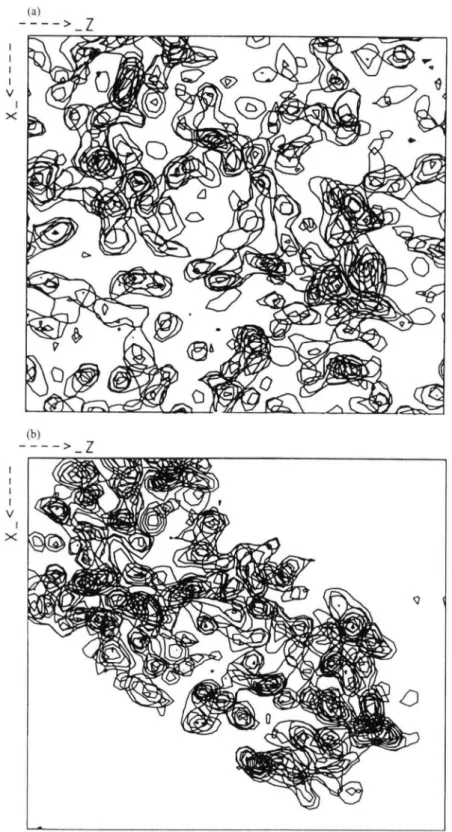
The X-ray topograph provides a direct indicator of crystal quality and is a rather rapid technique compared with mosaicity measurements. The results of each technique are closely related, as the misorientiation of spatially coherent regions seen in a topograph (Fig. 8), overall, form the mosaicity of a sample in rocking curve. For example, Fourme et al. (1995) took topographs from a lysozyme crystal for a reflection at three different points in the rocking curve, thus directly demonstrating the mosaic blocks in the crystal.
X-ray topography has been used to make comparisons between microgravity and earth grown tetragonal lysozyme crystals (Stojanoff et al. 1996). In the microgravity case several mosaic blocks could be seen. The ground control crystal topograph showed a high density of defects over the whole crystal rather than individual blocks; it appeared to be crumbly in nature rather than showing the definite block structure seen in the microgravity crystal. In other cases microgravity crystal topographs showed essentially a single mosaic block (i.e. a perfect protein crystal).
The evaluation of protein crystal quality is a rapidly growing field. X-ray diffraction topography provides a direct indicator of crystal quality and is a rather rapid technique compared with rocking width measurements. The results set bench marks for further improvements. The size of crystals and their angular perfection set basic limits on the emittance (brilliance) specification of the X-ray source itself (see section 5) and the size of the diffraction data collection apparatus (see section 6, detectors).
4.3 Relative Wilson plots and resolution limit
The Wilson plot can be used to evaluate the overall scattering strength of a crystal via the 'B value' which is a parameter that reflects the internal order within a
Fig. 8. X-ray topograph of a lysozyme crystal. (Based on Stojanoff et al. (1996)).
crystal. Relative Wilson plots, also known as difference Wilson plots, are useful for comparing two different crystals of a protein grown under different conditions.
The maximum extent of the diffraction pattern or resolution limit for any protein crystal is a function of the mosaicity, the statistical disorder of the molecules and atomic vibration. The maximum resolution can be based either on the ratio sigma(I)/(I) in resolution shells and on values of R-merge (the relative disagreement between intensities of symmetry equivalent reflections) as well as on completeness of observed data. For example the combined criteria of a sigma(I)/(I) greater than 3 sigma, an R-merge(I) less than 20 % and a completeness greater than 50% define the highest resolution shell actually measured reasonably successfully. These quantities are vulnerable to the experimental setup and conditions of measurement. Likewise the computer algorithm used to integrate the reflections can overestimate the reflection intensity, and even to regard a noise peak as signal if too much latitude is given to a predicted peak position. Obviously these problems are more manifest where weak data predominates i.e. at high resolution. However the use of large area detectors and/or fine angle scanning would optimise the measurement of weak data at high resolution. It is important then that the intrinsic quality of a crystal is exploited. A measure of a crystal's quality for the purposes of diffraction measurement is its
size and its angular perfection. The product of these parameters (the sample acceptance) defines a specification for the X-ray source emittance to match.
5. SYNCHROTRON X-RAY SOURCES
Synchrotron radiation (SR) is now a widely used tool in a variety of macromolecular crystallography applications; these include measurement of the highest possible resolution data, the study of large unit cells, acquisition of data from small crystals, use of anomalous dispersion effects for phase determination and dynamical, time-resolved, studies (Helliwell, 1992a; Ealick & Walter, 1993).
5.1 Flux, brightness, brilliance and, a new term, fluence
The properties of synchrotron radiation can be described in terms of high flux (large number of photons), high brightness (well collimated), and high brilliance (small source size and well collimated), as well as its tunable-continuum range, polarised nature, defined time (i.e. bunch) structure and exactly calculable spectra. The precise definitions of these quantities
are:-flux = photons/sec/o-i % 3A/A (ia)
brightness = photons/sec/o-i % <JA/A/mrad2 (ib)
brilliance = photons/sec/o-1 % <?A/A/mrad2/mm2 (ic)
Care needs to be exercised to check precisely the definition in use, particularly since brightness can be used as a term when brilliance is meant. The mrad2 refers to radiation solid angle emitted from the source, and mm2 the source cross-sectional area.
There is obviously a term 'missing' which can be called
fluence = photons/sec/o-1 % <JA/A/mm2 (id)
(for the relevance of this new term see section 5.4).
A key quantity is the synchrotron machine emittance e. This is invariant for a given machine lattice and electron/positron energy. It is the product of the beam divergence angle, cr', and the beam source size, or. Hence,
e = <r <r' (2)
The horizontal and vertical emittances need to be considered separately.
5.2 Insertion Devices (ID's)
These are multipole magnet devices placed (inserted) in straight-sections of the synchrotron or storage ring. They can be designed purposely to enhance specific characteristics of SR, namely
(a) extend the spectral range to shorter wavelengths (wavelength shifter); (b) increase the available intensity (multipole wiggler);
(c) increase the brilliance (via an interference effect) and also yield a
quasi-monochromatic beam (undulator);
(d) provide a different polarisation (e.g. rotate the plane of polarisation, produce
circularly polarised light etc.).
In these devices the electron beam oscillates as it experiences a periodic magnetic field. There is no net deflection and so these magnets are inserted into straight sections between the bending magnets. For a detailed description of these sources and comparisons between them see chapter 4 of Helliwell (1992 a).
Short wavelength undulator emission is the province of the new high energy, high brilliance, 3rd generation machines such as the ESRF in Grenoble, France (6 GeV), the APS at Argonne National Laboratory, Chicago, USA (7 GeV) and SPRING-8 at Harima Science Garden City, Japan (8 GeV). An important feature is to cover all the spectral range of interest to the user via the tuning range of the fundamental line and harmonics of an undulator. This is easier the higher the machine energy. However, important developments involving 'narrow gap' undulators (e.g. down to « 10 mm) erode the advantage of machine energies above 6 GeV for the production of X-rays within the photon energy range of primary interest to macromolecular crystallographers, namely 40 keV down to as 6keV.
5.3 Machine emittance and crystal sample acceptance
The qualities of a crystal that are pertinent to X-ray crystal structure analysis include size, mosaicity, resolution limit, radiation lifetime and crystal habit (shape). Typical values of these parameters can be considered in the specification of the synchrotron beam. The size of the crystal sample is important because the strength of the diffraction pattern is directly proportional to the volume of the crystal that is irradiated. Because of X-ray absorption, which reduces the intensities of spots and introduces systematic errors into the intensity measurements, there is a limit to the usable crystal size. However, the absorption also depends on the X-ray wavelength chosen. There is also a limit to the geometric size of the spots set by the detector parameters, i.e. simply in terms of large spots at one extreme and small spots at the other extreme. The mosaicity or intrinsic angular perfection of the crystal can be as small as io~3 degrees, but anyway usually increases to 0-25° or 0-5° with current freezing techniques (see section 7). This 'penalty' is tolerated because of the radiation endurance of a frozen crystal but the methods need then some further optimisation.
The sample acceptance, a, is a term that is useful as a direct analogue of the synchrotron machine emittance (equation 2), i.e.
a = t7/ (3) where t is the dimension of the sample and -tj is its mosaic spread. For example if t = o-i mm and, taking the smallest value, 97 = 20/trad (o-ooi°) (Snell et al. 1995) then a = 2 x io~9 metre radian or 2 nanometre radian. This is then' as severe
as one might wish to make the machine specification, from the macromolecular crystallographer's point of view.
5.4 Properties of the beam at the sample position and intensity of diffraction At the sample position the intensity of the beam, usually focused, is a useful parameter:
intensity = photons/sec/focal spot area . (4) Moreover the horizontal and vertical convergence angles are ideally kept smaller than the mosaic spread so as to measure reflection intensities with optimal signal to background.
To produce a focal spot area that is approximately the size of a typical crystal and with a convergence angle equal to the mosaic spread sets a sample acceptance parameter, similar to machine emittance, in the ideal limit. A machine with an emittance that approaches the acceptance of the sample greatly assists the simplicity and performance of the beamline (mirror and/or monochromator) optics design.
For example, at the SRS the initial emittance when the machine came on-line in 1981 included a horizontal source size of 137 mm (FWHM), a considerable mismatch with respect to a typical protein crystal size. A considerable improvement was realised with the SRS 'High Brightness Lattice' in 1985 which reduced this to w 2 mm. There was then an evolution of instrument and beam quality for macromolecular crystallography data collection at the SRS (Helliwell
et al. 1982, 1986; Brammer et al. 1988; Thompson et al. 1992; and reviewed in
Deacon et al. 1995 a). In addition to the focal spot area and convergence angles it is necessary to provide the appropriate spectral characteristics. In monochromatic applications, involving the rotating crystal diffraction geometry, a particular wavelength, A, and narrow spectral bandwidth, SX/X, are used.
In the collection of data, absorption effects of the sample can always be minimised by choice of a short wavelength. A wavelength of o-9 A has commonly been used. The absorbed fraction of the incident beam in the sample is (1 — e"''1), where /i is the sample linear absorption coefficient and t the thickness of the crystal. But depending on the thickness of the crystal a shorter or longer wavelength can be used. In the limit of very small crystals a much longer wavelength can be exploited than 0-9 A because the product /it remains small (Helliwell, 1993). This is useful to consider from the point of view of the intensity of diffraction spots. The total energy in the diffracted beam, E(hk<Q, in the monochromatic case, from a particular reflecting plane (hk/) for an ideally mosaic crystal rotating with constant angular velocity (0 through the reflecting position varies as
where Io is the intensity of the incident X-ray beam of wavelength, A, P is the
correction for polarisation, L is the Lorentz factor correction for the relative time spent in the reflecting position, A is a correction for sample absorption (ideally A = 10 if shorter wavelengths are chosen appropriately for a given sample size), Vx
is the volume of the crystal sample and Vo is the volume of the crystal unit cell.
Hence, a longer wavelength enhances E(hk<f) and increases the absorption efficiency of certain common detector types (IP, MWPC, TV etc.). This then counterbalances the desire for a short wavelength to reduce sample absorption. Note that since L varies as i/sin#, E(hk/) varies as A2 (not as first appears as A3 alone). The desired wavelength therefore for native data collection varies depending on a variety of factors. Certainly if absorption is small, i.e. if the sample is small, longer wavelengths can be considered. Radiation damage of crystals at room temperature has been reduced, in practice, by use of short wavelengths. The common methods now developed to freeze protein crystals, and more recently virus crystals, has generally relaxed the need to use shorter wavelengths as the determinant to control radiation damage. The widespread freezing of crystals is a radical change in laboratory practice in the field. A side effect is, however, an increase of mosaic spread to « 0-25° or worse (see section 4.1 for the quality that is possible without freezing). This alters what one desires from the machine emittance. Where the sample mosaic spread acceptance is large, less brilliant beams are adequate, and indeed X-ray beams with a higher fluence (equation id) are therefore important. Alternatively, methods for freezing may well be found where the mosaicity is not increased to such an extent or near-room temperature data collection can still be required.
5.5 Synchrotron beam requirements in different applications
The freedom to choose the wavelength for native data collection itself, as well as for the exploitation of anomalous dispersion effects (see section 8), requires tunability from the beamline optics and a machine to provide a good flux over a broad band of wavelengths. For the optics this ideally means in practice the chance to separate the function of monochromatisation from fine focusing of the beam. Fortunately over the last 15 years there has been a constant improvement of machines with a trend to improved (lower) emittance to facilitate this for macromolecular crystallography data collection (Deacon et al. 1995 a).
The fundamental aspects of beamline optics for macromolecular crystallography has been described in detail elsewhere [see chapter 5 in Helliwell, 1992 a] and will not be repeated here. However, there is now an interest in optics performing at higher photon energies and for which monochromators operating in transmission (Laue) mode, rather than reflection (Bragg) mode, have to be developed. A variety of prototype schemes is discussed by Suortti & Schulze (1995). Likewise Laue monochromators such as diamond are very interesting for high power beams. At the ESRF for example (BL20) a sequence of wafer-thin monochromator crystals will each extract a monochromatic beam from the same polychromatic beam, each monochromatic beam being different in wavelength, therefore more effectively
utilising the emission from the source in one beamline consisting of several hutches/instruments (Wakatsuki & Als-Nielsen et al. to be published). Beamline 20 involves a four hutch design fed by one undulator straight section.
Other novel types of beamline conditioning element are so called capillary optical devices, which are of special interest for small crystals (20 /tm or less) (for a review see Bilderback et al. 1994).
5.6 Criteria for the choice and design of SR sources for macromolecular
crystallography
Source parameters that need to be considered, as well as the emittance, include the machine energy, source position stability, circulating current and the lifetime (decay) of the beam. There have indeed been welcome trends in machine specifications over the years for macromolecular crystallographers. Machine energies have increased, thus providing more plentiful fluxes of photons at shorter wavelengths (e.g. down to 0-5 A) and encompassing most absorption edges of interest for anomalous dispersion (see section 8). Absorption errors can also be removed, i.e. brought to a similar level, as an error component in the data, as random errors i.e. ~ 1-2 % on I. Protein crystals are essentially transparent at the higher photon energies.
The machine emittance, as discussed above, has come to match the typical sample acceptance. Source sizes are generally in the sub-mm range and therefore match typical crystal size. Divergence angles are « 1 mrad in the horizontal and
ss o-i mrad in the vertical. Source positional stability has continually improved too. This is done both by feedback control and also better performance from the magnets that steer and deflect the electron beam in the synchrotron. For example, it is possible to reach better than 5 /tm peak-to-peak stability at ESRF, a need set at 10% of the source o~ value. Beam lifetimes are now attaining values of 40-60 hours ( i / e lifetime). For the future, the so-called top up mode of the beam is to be utilised at the APS whereby the circulating current can be replenished every few minutes to keep an essentially constant current in the machine. This will benefit the stability of beamline optics, which will then be constantly in thermal equilibrium.
The choice of which particular magnet should be used as source (bending magnet, wiggler, undulator) is never entirely a sharp boundary. In particularly demanding cases, however, certain trends become clearer. Such cases include (a) large unit cell (e.g. virus) crystal data collection upto say 1000 A unit cell; (b) small crystals down to say 10-20/tm; (c) time-resolved studies down to picosecond exposures. Undulator sources offer high brilliance beams well matched to the dense, weak, diffraction patterns of large unit cell crystals. Likewise undulators lend themselves to providing small focus beams for microcrystal studies. Multipole wigglers produce the broad band of wavelengths necessary for Laue diffraction. Undulators can reach the fastest exposures, but in a small bandpass. A hybrid design ' Wiggulator' or 'Wundulator', with tailored bandpass offers a compromise. Bending magnet sources offer considerable advantages where very
stable optics performance is required. Here relatively low heat loads are useful. Hence, a stable set of optics, and therefore beam intensity, allows highly precise measurements to be made, which is especially valuable for anomalous dispersion experiments. Obviously much stronger ID, tunable undulator, sources should be harnessed for anomalous dispersion data collection when small crystals or larger unit cells are involved, and whereby freezing of the crystal preserves the sample during data collection involving two, or possibly more, wavelengths (see section 8.2).
6. DETECTORS
Position sensitive area detectors (PSDs) are critical to measure efficiently diffraction data sets, which can reach up to io6 reflection intensities or more for virus cases. The detector devices available have evolved through various generations (see for e.g. Helliwell, 1982, 1984, 1992 a; Allinson, 1994; Lewis, 1994). These have still not reached an ideal state. The principal problem is to realise a combination of properties in the one device specification. There are, in addition, special data acquisition problems for time-resolved/perturbation crystallography (Moon et al. 1994; Bourgeois et al. 1996) and also in MAD data collection involving multiple passes of measurement (Deacon et al. 1995 a). For small crystals there are still limits set by detector noise floor. For atomic resolution protein crystallography there are strict demands involving the sensitivity and the detector quantum efficiency (DQE) to adequately measure weak signals/spots (e.g. at ultra-high resolution see section 9). The dynamic range of response can be improved to avoid the need to measure a quick crystal scan for the stronger reflections which would otherwise saturate a detector. The sensitivity of a PSD is less than 100% over the full wavelength range of interest, especially at short wavelengths. In addition, image read out times of the devices are still often not quick enough. Nevertheless great strides have been made. Hence, an evolution from photographic film and the single element scintillation counter through to wire chambers, TV detectors, image plates and now charge coupled devices has taken place over a period of 20-30 years. A new device beckons, the pixel detector (Hall, 1995), which is silicon based (like CCDs), but each pixel has an indepen-dent counting chain. A large pixel array (e.g. 1000 x 1000) will be costly. Essentially the rapid readout capability of CCDs with the large aperture of image plates, combined in one device is very desirable. Mosaics of individual CCDs, tiled together, offer another, more immediate approach, which is being pursued (Westbrook, 1988), including a variety of commercial devices based around 2 x 2 arrays (i.e. 4 tiles). Alternatively parallel readout, multiple read heads, with IPs offer the chance to both increase detector area or increase readout speed (Mallett pers comm). Sakabe (1983, 1991), and Sakabe et al. (1995), have exploited Weissenberg geometry, whereby the rotation of the crystal sample in the monochromatic beam is coupled with the detector translation and which allows the slow readout of IP's to be circumvented to a great extent. The latest 'giant' Weissenberg IP camera utilises plates upto o-8 x o-8 m2, which are read off-line.
These have a pixel size of 01 mm x o-i mm, and thus gives an extremely large data array to cope with a 200 rotation range of even very large, virus, unit cells.
7. CRYO-CRYSTALLOGRAPHY
Crystals of biological macromolecules suffer from radiation induced decay, when they are exposed to X-ray beams at room temperature. This damage is thought to occur when free radicals are generated, which diffuse through the crystal lattice (Blundell & Johnson, 1976). The effect manifests itself in a rapid loss of intensity for the highest resolution reflections, even within the first few minutes of data collection. The combined effect of radiation and thermal damage is an important consideration with high intensity X-ray beams (Helliwell & Fourme, 1983; Helliwell, 1984) and in the use of smaller protein crystals (Hedman et al. 1985). Both the quality and the quantity of data collected from a single crystal can be limited therefore and as a result data frequently have to be merged from several different crystals. Carrying out data collection at low temperature has long been recognised as a method of reducing radiation damage (Hope, 1988, 1990; Dewan & Tilton, 1987; Henderson, 1990; Young et al. 1993) and to deal jointly with thermal effects (Helliwell & Fourme, 1983). The resolution limit of the diffraction is often extended due also to reduced atomic thermal vibration. Moreover, this resolution limit can be maintained throughout the data collection. Protein structures refined against low temperature data give lower B-factors and often twice as much ordered solvent as equivalent room temperature data. A complete data set can usually be collected from a single crystal. Radiation damage can still be apparent at the highest resolution. For example, for frozen concanavalin A at 0-94 A resolution (see section 9.1), (Deacon et al. 19956) a fall-off in resolution limit (see section 9.1), over a 3 hour data collection time is observed for a given crystal.
Probably the earliest cooling experiments were carried out on insulin crystals (Low et al. 1966). They did not pursue this approach, however, because of the large increases in mosaic spread they observed. In their experiments the crystals were frozen whilst mounted inside glass capillaries. Thus an impeded rate of freezing may have caused excessive thermal stress in the crystal. The lack of cryoprotectant will have caused ice formation within the crystal. A method was then suggested to prevent such ice formation by soaking the crystals in a water/alcohol mixture of low freezing point (Petsko, 1975). This solution can fill the solvent channels of the protein and remain liquid to < 200 K. This method has been succesfully used in several protein structure determinations between 173 K and 200 K (Walter et al. 1982; Xuong et al. 1981). Using a similar cryoprotection technique the structure of a B-DNA dodecamer has been studied at 16 K (Drew et al. 1982), using a 3 day slow cooling protocol. A small molecule technique for cryo-temperature data collection at near liquid nitrogen temperatures was then used in a study of crambin and bovine pancreatic trypsin inhibitor (Hope, 1988, 1990). Crystals were coated in paratone-N mixed with mineral oil and were mounted on the end of glass fibres. Best results were obtained
when crystals were frozen as quickly as possible. Similar methods were used to carry out studies on ribonuclease crystals at temperatures from 220K to 98K. The crystals were first transferred to a 50% water/ 50% MPD cryoprotectant solution. They were then 'flash' frozen in a cold nitrogen gas stream. The crystals mounted on glass fibres proved to be much more stable than those mounted in quartz capillaries (Dewan & Tilton, 1987).
Recently, improvements have been made in both mounting techniques and in the optimisation of the cryoprotectant solution. A fast method for mounting crystals in a low temperature gas stream has been developed (Teng 1990), which involves suspending the crystals in a thin film of cryoprotectant solution, within a wire loop. This technique is ideally suited for flash freezing, since no capillary is present to impede the freezing rate. The absence of a glass capillary from the X-ray path also leads to a lower and more uniform X-X-ray background. The method is also ideal for handling fragile samples, since a crystal can be gently manipulated into the loop simply through surface tension effects. Further development of this method has led to the use of finer loop material, to minimise X-ray absorption, with rayon and glass wool fibres commonly being used. The loops are generally tailored to just match the size of the crystal. The mosaic spread of frozen protein crystals has been shown to be dependent on the cryoprotectant concentration (Mitchell & Garman, 1994). A concentration can be determined that results in a reduced mosaicity ( ~ 0-25° is about the best achieved so far), the highest possible resolution in a given case and no ice formation.
In determining cryoprotection conditions suitable for flash freezing, for a particular protein crystal, there are two important considerations: the type and concentration of cryo-protectant and also the equilibration process. Commonly used cryoprotectants include glycerol, ethylene glycol, PEG400 and MPD, used in concentrations from 10-30% (Gamblin & Rodgers, 1993). The first step in determining an optimal cryoprotectant concentration is to freeze the liquor alone. It should freeze into a glassy state without undue ice formation i.e. without being cloudy. In the ideal situation crystals can be grown in solutions that already have an amount of cryoprotectant present. Failing this, crystals can be equilibrated in the cryo-buffer prior to mounting, either by direct transfer through increasing concentrations of solution or dialysis. If the crystals are not stable in this environment then they can often be rapidly transferred into the cryoprotectant solution and then immediately into the cold gas stream.
Occasionally severe icing problems are encountered during low temperature data collection, particularly during a long data collection in a humid environment (Watenpaugh, 1991). In these extreme cases the crystal environment can be kept dry by surrounding it in a dry nitrogen 'tent'. Ice problems around the crystal itself are generally a result of turbulence in the nitrogen gas stream. These problems can usually be overcome by mounting the loops on the end of longer fibres or pins and also by carefully adjusting the flow rate of warm, dry, nitrogen gas that is normally provided on cryo-equipment, to surround the cold gas stream. Any excessive icing around the goniometer can be avoided through the use of a heated collar.