Publisher’s version / Version de l'éditeur:
Vous avez des questions? Nous pouvons vous aider. Pour communiquer directement avec un auteur, consultez la première page de la revue dans laquelle son article a été publié afin de trouver ses coordonnées. Si vous n’arrivez pas à les repérer, communiquez avec nous à [email protected]. Questions? Contact the NRC Publications Archive team at
[email protected]. If you wish to email the authors directly, please see the first page of the publication for their contact information.
https://publications-cnrc.canada.ca/fra/droits
L’accès à ce site Web et l’utilisation de son contenu sont assujettis aux conditions présentées dans le site LISEZ CES CONDITIONS ATTENTIVEMENT AVANT D’UTILISER CE SITE WEB.
International Thermal Spray Conference 2006 [Proceedings], 2006-05
READ THESE TERMS AND CONDITIONS CAREFULLY BEFORE USING THIS WEBSITE.
https://nrc-publications.canada.ca/eng/copyright
NRC Publications Archive Record / Notice des Archives des publications du CNRC :
https://nrc-publications.canada.ca/eng/view/object/?id=af8db8ff-2de4-4089-bec4-016c9e9ddde5 https://publications-cnrc.canada.ca/fra/voir/objet/?id=af8db8ff-2de4-4089-bec4-016c9e9ddde5
NRC Publications Archive
Archives des publications du CNRC
This publication could be one of several versions: author’s original, accepted manuscript or the publisher’s version. / La version de cette publication peut être l’une des suivantes : la version prépublication de l’auteur, la version acceptée du manuscrit ou la version de l’éditeur.
Access and use of this website and the material on it are subject to the Terms and Conditions set forth at
Optimization of laser cladding process using Taguchi and EM
methods for MMC coating production
Imi
2005-
\ lO~81-3C.NRQ-
L\i9L..\\
Optimisation of laser
cladding process
using Taguchi and EM methods for MMC coating production
L. Dubourg
Aluminium Technology Centre, National Research Council Canada, Saguenay, Quebec, Canada
L. St-Georges
REMACIndustrialInnovatorsInc.,Saguenay,Quebec,Canada
Abstract
This study investigates the influence of laser cladding parameters on the geometry and composition of metal-matrix composite (MMC) coatings. Composite coatings are made of a Ni-Cr-B-Si metallic matrix and of WC reinforcement with a volume fraction of 50 %. Optical microscopy is used to characterize the coating geometry (height, width and penetration depth) and to determine the real volumetric content ofWC. Laser cladding on low carbon steel substrate is carried out using a cw Nd:YAG laser, a coaxial powder injection system and a combination of Taguchi and E.M. methods to design the experiments. This combination explores efficiently the multidimensional volume of laser cladding parameters. The results, which express the interrelationship between laser cladding parameters and the characteristics of the clad produced, can be used to find optimum laser parameters, to predict the responses and to improve the understanding of laser cladding process.
Introduction
As shown in Fig. 1, laser cladding consists to cover a substrate surface with a coating of a different nature. This process can be carried out in different ways: with wire feed, lateral [1] or coaxial [2] powder injection (see Fig. 1). In the case of powder injection, the cladding powder is injected into the laser beam by an inert gas flow. The energy delivered by the laser is absorbed both by the powder stream and the substrate material. This enables the melting of the in-flight particles and the fusing of the powder onto the substrate surface. A clad is formed by moving the sample under the laser beam. An uniform layer is obtained by partially overlapping individual clads. A slight dilution of the cladding material into the substrate generates a perfect metallurgical bonding between them. Many studies on laser surface treatment have been carried out with the goal of improving the mechanical characteristics of cladded coatings (hardness, elastic modulus and wear resistance). These studies are done on steel [3-4], aluminium [5-11] and magnesium [12] substrates. Several authors have already investigated the formation of intermetallic compounds such as AlyXz(alloys Ni [5], AI-Fe [6], AI-Cu [7], AI-Mo [8] and AI-Cr [9]) for aluminium treatment and MgyXz (alloys Mg-Al [12]) for magnesium treatment. Another field of research consists in the
development of metal matrix composites (MMC) coatings. These materials are composed of hard reinforcement particles distributed in a softer metal matrix. In the case of steel, the reinforcement particles the most used are tungsten carbide [3-4], due to their relative low cost and high mechanical properties. On the other hand, for aluminium and magnesium surface treatment, the reinforcements are more often silicon carbide [10] or titanium carbide [11] due to their low densities. Studies show that no significant difference of wear resistance is observed between laser cladded MMC coatings containing TiC, SiC or WC particles, although the mechanical characteristics of these different reinforcement particles are dissimilar [13]. In the present study, coatings are made from a nickel-base matrix and WC with a volume fraction of 50 %. The study investigates the influence of the laser cladding parameters on the geometry and composition of MMC coatings. Experiments are done on low carbon steel substrate. The laser cladding is carried out using a coaxial powder injection system and a Nd:YAG laser. An optical microscopy is used to analyse and characterize the coating geometry.
Laser beam Coating
\
~
Experimental set-upLaser cladding is performed with a continuous wave 4000W Nd:YAG laser of 1,064 mm wavelength and a 600-llm diameter optical fiber. A lens with a 280-mm focal length is used to focus the laser beam. The cladding parameters are as follows. The laser beam power is adjusted to 4000 W on the workpiece surface and defocused with an out-of-focus distance from 45 to 70 mm. For this out-of-focus distance
range, the spot diameter on the workpiece evolves uom 6 to 8 mm (see Fig. 2). Accordingly, the power density varies uom 150 to 74 W.mm.2. At the same time, the power distribution of the laser beam also evolves uom a flat top profile at the focus point to a gaussian profile at a defocused position (as presented in Fig. 2). Cladding speed varies uom 0.4 to 1.6 m.min'l. The substrates are composed of Fe - 0.06 C (wt.%) and the sample size is 50 x 50 x 12 mm3. The powders of pre-allied Ni-base matrix (Ni - 4 B - 5 Si - 5 Fe - 10 Cr (wt.%)) and reinforcement particles are premixed prior to the injection with a volume uaction of 50 %. The resulting mixture is injected inside the laser beam at a rate ranging uom 30 to 120. .1 g.mm. 10
~~.
~
..
~=:1:X~065.
R'=0.99..
..
E 8 §. E to ~ 6 ~ <1> '" .!!1 '0 4I
~~
...
. to 2.
is.
.
0 0 10 20 30 40 50 60 Out-of-focus distance (mm) 70Figure 2: Effect of the out-of-focus distance on the shape and
the diameter of the laser beam.
In the investigation presented here, the influence of the laser cladding parameters (cladding speed, powder feed rate, out-of-focus distance and overlapping) on coating geometry is
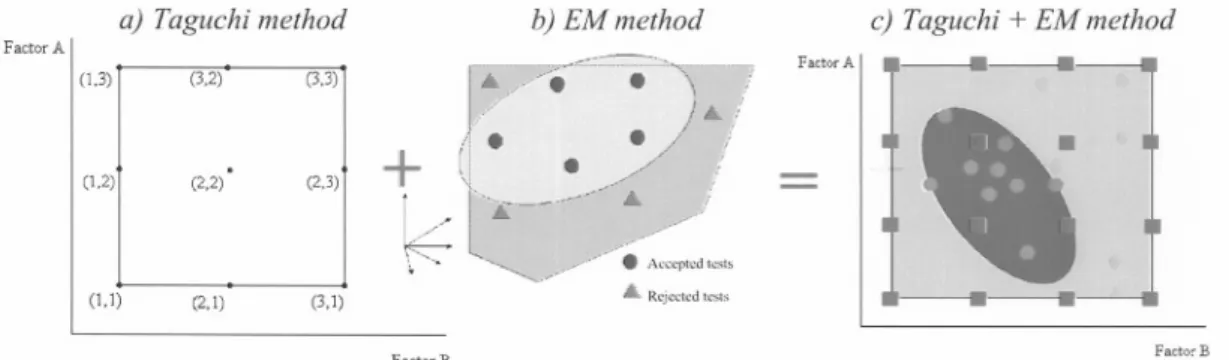
studied. A combination of Tagushi and EM design of experiments is used to optimise the cladding parameters and minimise the number of tests and characterisations. The Taguchi method relies on a normalized orthogonal matrix. Each set of matrix assures that the space is investigated in a way that the effect of every variable can be clearly detected. This can be done by varying many parameters at the same time along the orthogonal border of the orthogonal domain. For example, Fig. 3a shows a L9 matrix for 2 factors with 3 levels. Alternatively, E.M. technique is based on the Euclidian domain elaboration, which is modified in an interactive way by varying all the parameters at the same time. The process feasibility domain is then defmed by a multidimensional volume that discriminates the accepted tests inside this volume and the rejected tests outside it. Fig. 3.b illustrates this feasibility domain (blue zone). This method allows a more interactive approach using a dynamic construction of the feasibility domain throughout the data collection. In the present study, a combination of Taguchi and EM methods called Taguchi/EM is used as shown in Fig. 3.c. As the first step, the feasibility domain is promptly defined by a Li8 Taguchi matrix and the multidimensional volume is efficiently explored (red square plots in Fig. 3.c). Subsequently, the EM method is used to refine the domain (blue plots in Fig. 3.c), to find the key indictors that can explain the response variations and to optimise the cladding process. In the case of laser welding, this hybrid Tagushi/EM method has previously provided equivalent prediction models with less experimental tests than the ones provided by classic methods [14-15].
b) EM method
~}:;r.~-'=~"')':7
II.
./
Ii
+
II / !iI
/ il
i,>~=,-..~/.{~;~
.. jY'~"~'> " ~./;>.,,#'. Am,,"d les" ... Reje",d teSIS (1,]) (2.1) (3.1) FactorB c) Taguchi + EM method FactorAI 8
8
-.,
Factor BFigure3: a) Example ofTaguchi method: L9 designfor 2factors at 3 level each, b) Example ofE.M method:feasibility domain of the
process (blue zone),c) Example of Taguchi/EM method (.. point obtained with Taguchi, .: point obtained with EM, blue zone:
feasibility domain, yellow zone: domain explored with the Taguchi method).
In order to characterise the coatings, the cross section of the coatings is polished to a mirror finish (diamond with a grain size of 1 !lm). The coating geometry is evaluated using an optical microscope. Two tests are performed: a clad mode of a single pass (Fig 4.a) and a coating made of multi pass, obtained by overlapping (Fig 4.b). In the single pass clad, three dimensions are measured as shown in Fig. 4.a, where (H) and (L) are respectively the height and the width of the clad. The distance uom the surface substrate to the deeper point in
the substrate is defined as the penetration depth (P). On the overlapping coating, the coating thickness (T) and the overthickness (0) are measured as shown in Fig. 4.b. For the reinforcement particle measurements, optical microscopy images are discretised and analysed using an image analysis software. The reinforcement particles are isolated, implementing several filtering protocols. Five images defined randomly across the cross section are analysed on each sample and the results are subsequently averaged.
a) Taguchi method
FactorA
I
(1.3) (3.2) (3,3)
Hr=P-.L
~
pi
, a) °1 TI~
~>", , "-.:;'. . :"""':"'~ '., b).Figure 4: Dimensions measured for clad characterization. Results and discussion
With the Taguchi/EM method, two steps are considered. A LI8 matrix is used in the first step, combining 4 input parameters with 4 levels each, for a total of 18 trials. These input parameters are the laser scanning (ranging ITom400 to 1600 mm.min'[ by step of 0.4 m.min'I), the powder feed rate (ranging ITom30 to 120 g.min-l by step 000 g.min'\ the out-of-focus distance (ranging ITom 45 to 70 mm by step of 5 mm), and the overlapping for multi pass cladding (ranging ITom 4 to 7 mm by step of 1 mm). This exercise promptly
Visser
Q
LdefA2
defines the feasibility domain and explores efficiently the multidimensional volume. In the second step, the interactive EM technique is used, varying all the parameters at the same time. The domain is refined test after test and each subsequent test is selected in such a way to maximize the gain in new infonnation. This method takes a more interactive approach leading to the dynamic construction of the feasibility domain throughout the data collection. After these two steps, the feasibility domain is well known and the prediction equations are stable [14-15]. All regression equations modelling the different responses as function of the input parameters show R2regression coefficients above 70%, indicating a good fit. Sin2:le pass coatin\!
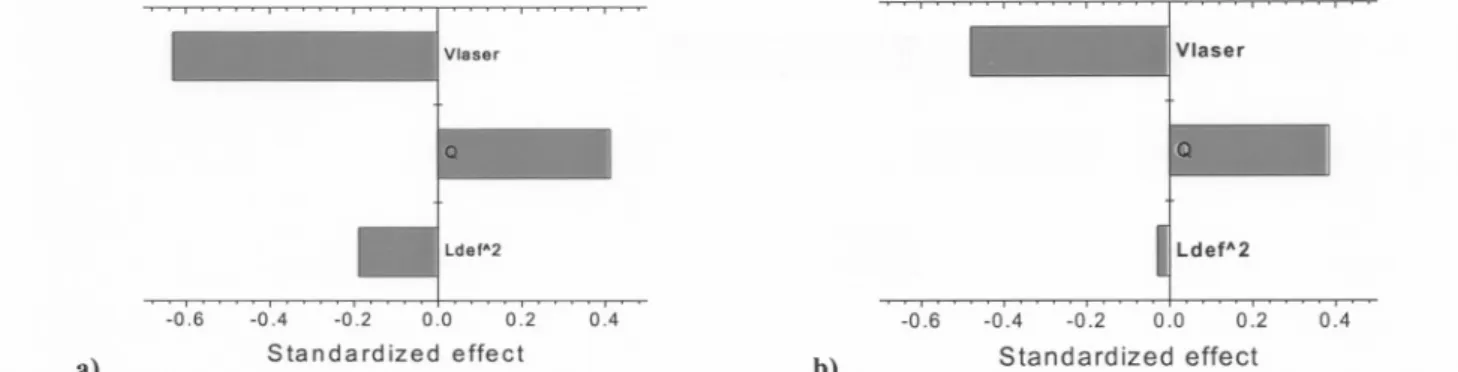
For a single pass coating, Fig. 5 shows the Pareto charts of the height (H) and the width (L) as a function of cladding parameters. The Pareto chart is an illustration of the estimated effects of the input parameters. The length of each bar on the chart is proportional to the positive or negative standardized effect.
,0.6 -0.4 -0.2 0.0 0.2 0.4 ,0.6 -0.4 -0.2 0.0 0.2
a) Standardized effect b) Standardized effect
Figure 5: Pareto charts of a) the height (H) of single pass clad, and (b) ) the width (L) of single pass clad. Input parameters:
cladding speed (1'Iaser),powder feed rate (Q) and square of the out-of-focus distance (Lde/,2).
According to Fig. 5, the clad size (i.e. height and width) is correctly predicted by the cladding speed (1'Iaser)and the powder feed rate (Q). As depicted in the Pareto chart, the influence of the cladding speed is predicted by a negative coefficient. When the cladding speed is lower, more powder is deposited on a given area of the substrate and consequently, the clad size increases. In contrast, the powder feed rate has a direct effect on the clad size (as illustrated by the positive value in the Pareto chart). For an increased feed rate, more powder is added on the substrate and, similarly, the clad size increases. The effect of out-of-focus distance is less pronounced than the two other parameters considered here. The out-of-focus distance has mainly an influence on the area of laser beam spot, and consequently, on the laser power density. This does not influence considerably the clad size. As the out-of-focus distance increases, the laser power density decreases and less in-flight particles can be melted, as showed by the negative effect of the out-of-focus distance on the clad height and width. Nevertheless, for the range of out-of-focus
0.4
distance considered here, the power density seems to be large enough to tolerate small variations of power density and melt appropriately the injected powders. This phenomenon is paradoxale as, in first sight, we can think that an increase of laser beam spot leads to an increase of clad width. According to the very small effect of the out-of-focus distance on the single pass clad height, the height can be correctly predicted only by the cladding speed and the powder feed rate and expressed by Eq. 1.
H=0.86-0.0011V'aser+0.016Q
Equation 1: clad height in mm as jUnction of cladding speed (1'Iaser)in mm.min" and powder feed rate (Q) in g.min".
In order to validate this predictive model, the result of this equation is plotted as function of experimental data in Fig. 6. The good relationship between the two sets of results
(r
equal to 0.83) conflnns the negligible effect of the out-of-focusdistance on the clad height and the validity of the predictive model developed here.
3.0 Y=0.83X + 0.16 R'=0.83 E 2.5 .s :g, 2.0 'ijj "~ .t::: ~ ~ 1;: 1.5 ~ 13 "
--§ 1.0 ~. 11 '*'/ 0; ~ U 0.5 ~...F /~ 0.01= 0.0 0.5 1.0 1.5 2.0 Measuredclad height (mm)Figure 6: Calculated clad height according function of measured clad height.
2.5 3.0
to Eq. 1 as
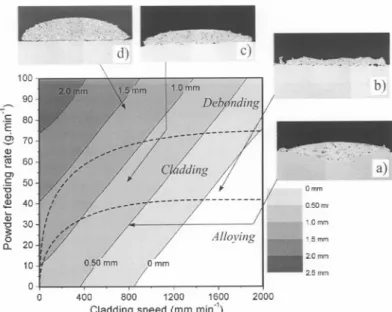
During this experiment, variations in the geometry and the quality of the cladding coating are observed. Theses variations are collected and used to produce the chart illustrated in Fig. 7. Three principal zones are then identified as function of cladding speed and powder feed rate, for various clad thickness: the debonding zone, the cladding zone and the alloying zone. In the Fig. 7, these zones are separated by dotted lines. In the alloying and the cladding zone, the powder is fused onto the substrate surface, resulting in a good metallurgical bonding. In debonding zone, a poor metallurgical bonding is obtained. Typically, four different geometries in the clad cross-section are observed. These four geometries, illustrated in Fig. 7, can be described as follows.
(i)Surface alloying (Fig. 7.a): in this zone, elevated cladding speeds are combined with low powder feed rates. The laser energy is mainly absorbed by the substrate and the dilution is important. The clad has a good bond with the substrate. However the clad is a combination of cladding material and substrate, the WC content is then low. (ii) Cladding with roughness, pores and cracks (Fig. 7.b): this clad has a good bond with the substrate and a low dilution. However, its surface exhibits high roughness, porosity and cracks.
(iii)Good cladding (Fig. 7.c): in this region, a good bond between the substrate and the clad is observed. The clad has a smooth surface and good profile without cracks and pores. A low dilution is obtained. (iv) Debonding cladding (Fig. 7.d): no bonding is created due to the significant lack of power on the workpiece (high powder feed rate and low cladding speed). The energy is sufficient to melt the in-flight particles only. The clad in this region is easily removed after the process. In Fig. 7, the clad height is also represented as function of cladding speed and powder feed rate according to Eq. 1. Various grey scales illustrate various clad thickness. According to the zones identified previously, this graphic illustrates the limitation of the process in term of clad height. For example, if a clad with a height exceeding 1.5mm is obtained, debonding should be expected. Good clad has typically a maximum thickness of 1,5 mm.
.~~~?,:~
_
..'. , ,'.". ..C.,._"";:.,.~) c'~-( ".::~ <'. 'j . ,.~) 100 b) 90 :5 80 E~
70 Q) '§ 60 -.-
"' :: """ ." .., ..- ,'.. ?-: .' "....a). Omm O.50ml 1.0mm 1.5mm 2.0mm 10 0 0 2.5mm 400 800 1200 1600 2000Cladding speed (mm.min")
Figure 7: Types of cladding obtained as function of cladding
speed and powder feed rate: a) surface alloying, b) cladding with roughness, pores and cracks, c) good cladding, d)
debonding cladding.
The methodology described previously is also used to evaluate the effect of cladding parameters on the WC content of a single pass clad. The parameters are the cladding speed
rVtaser),the powder feed rate (Q) and the out-of-focus distance
(Ldej.The Pareto chart obtained is presented in the Fig. 8. As depicted in this chart, the powder feed rate is the governing parameter, followed by the out-of-focus distance and the cladding speed. The effects of theses parameters are drastically different than the ones observed for the clad size. Consequently, no direct relationship can be expressed between the size and the WC content of the clad. According to Fig. 7, the powder feed rate mainly governs the bonding quality between the clad and the substrate. As the powder feed rate increases, the amount of laser power absorbed by the in-flight particles increases and less dilution is observed. This reduction of dilution has a direct impact on the chemical clad composition and results in higher WC content. In fact, when the dilution becomes more important, the chemical clad composition becomes a combination of cladding material and substrate (reduction of WC content). As the cladding speed increases, the energy transmitted to a given area of substrate decreases and less dilution is observed, resulting in a higher WC concentration. The effect of the out-of-focus distance on the WC content is similar. This distance has a direct effect on the power density of the laser beam. As the out-of-focus distance increases, the area of the laser spot increases and consequently, for a constant laser power, the power density is lowered. Less dilution in then obtained (higher WC content observed). Moreover, an increase of laser spot can lead to a higher molten pool under the laser beam, increasing the quantity of powders going into it and the WC content. Nevertheless, this explanation disagrees the previous
observation in Fig. 5.b: a higher laser spot does not lead to a higher clad width. This phenomenon can not be taken in account. Vlaser Q Ldef 23456 Standardized effect
Figure 8: Pareto chart of WC content of single pass clad.
Input parameters: cladding speed (Vtaser),powder feed rate (Q) and out-of-focus distance (Ldel
0 8
Using these parameters, the predicting equation of we content as function of powder feed rate (Q) and out-of-focus distance
(Lde)is obtained and showed in Eq. 2.
WC(%) =-18.95+ 0.33Q +0.55 Ldef
Equation 2: WC content in vol.% as function of powder feed
rate (Q) in g.min-Jand out-of-focus distance (Lde)in mm.
In Fig. 9, the numerical prediction of we content obtained using the Eq. 2 is compared to the experimental measurements. Again, the predictions are in good agreement with the experiments (r2 equal to 0.74). The interrelationship between the laser cladding parameters and the we clad content can be correctly predicted.
50 "#
-.:::;-' /0' .- .'"'/ /~ ../('.-. ~=-~ 40 " ~ 8 30~
~ 20 1ii B ~ 10-/
-.
/ y~0.74X + 9.06 R' ~0.74 0 0 10 20 30 40 50 Measured WC content (vol.%)Figure 9: Calculated WC content according to Eq. 2 as
function of measured WC content.
Multi pass coatinl!
The same methodology is used to analyse the effect of cladding parameters on coating thickness (T) of multi pass cladding. The resulting Pareto chart is shown in Fig. 10. For the multi pass cladding, similarly to single pass cladding, the coating thickness is mainly predicted by the cladding speed and the powder feed rate. Surprisingly, for the range of overlapping (n) used in this study, this parameter has not a big impact on the coating thickness. To understand this behaviour, the global geometry of the coating is analysed. The
overlapping has not a direct effect on the thickness but has a major impact on the global geometry of the coating, as presented below.
-0.6 -0.4 -0.2 0.0 0.2 0.4 Standardized effect
Figure 10: Pareto charts of thickness (T) of multi pass cladding. Parameters: cladding speed (Vtaser),powder feed rate (Q), square of out-of-focus distance (Lde/'2) and overlapping (n).
Neglecting the effect of out-of-focus distance and overlapping, the coating thickness can be expressed as Eq. 3. This equation is closed to Eq. 1, except the nominal term: 0.86 mm for single pass and 1.51 mm for multi pass cladding.
T=1.51-0.001 VIas<.-+0.020Q
Equation 3: clad height for multi pass cladding in mm as
function of cladding speed (Vjaser)in mm.min.J and powder feed rate (Q) in g.min,J.
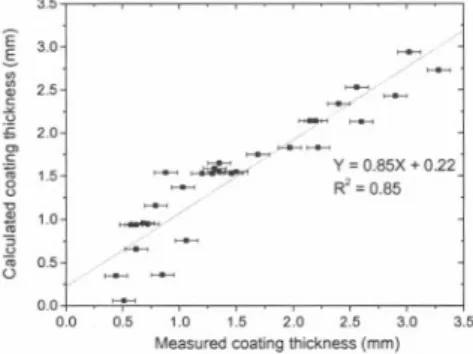
Using this equation, the coating thickness can be correctly predicted, as shown in Figure 11. In this graph, a good correlation between the numerical predictions and the experimental results is observed.
3.5 E oS 3.0 U> :IJ2.5 ~<J ;s 2.0 '" ,a :3 1.5 ." ~'" 1.0 B OJ 0.5 U
//-
_7 _7
-0::::;"'"
- ~-
- /
Y~0.85X+022
R'~O.85
-//_/
-0.0
0.0 0.5 1.0 1.5 2.0 2.5 3.0 Measured coating thickness (mm)3.5
Figure 11: Calculated coating thickness for multi pass
cladding according to Eq. 3 as function of measured coating
thickness.
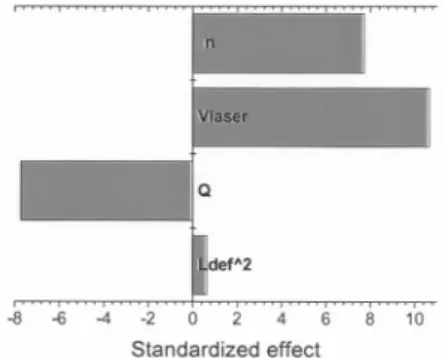
For multi pass cladding, the overthickness is also analysed. This parameter is partially representative of the global coating geometry, as presented above in Fig. 4, and cannot be analysed alone. Without any relationship with the total coating thickness, no correlation can be established between the overthickness and the cladding parameters. To determine the relative effect of cladding parameters on the global geometry of multi pass cladding, it is required to define a new
parameter, which considers the overthickness (0) relatively to the global thickness of the coating (1). This new parameter, called the relative overthickness (RO), can be defined as RO =
OIT. Using this new parameter, a good correlation can be established between the global geometry of multi-pass cladding and the cladding parameters. As illustrated in Fig. 12, the relative overthickness is governed by the cladding speed
~aser)' the overlapping (n) and the powder feed rate (Q).
-8 -6 -4 -2 0 2 4 6 8 10
Standardized effect
Figure 12: Pareto charts of the relative overthickness of multi
pass cladding. Input parameters: cladding speed ~aser)'
powder feed rate (Q), out-of-focus distance (Lde!2) and overlapping (n).
This relationship, written in a numerical form at Eq. 4, can be visually validated by the Fig. 13, where the numerical predictions are compared to the experimental measurements.
RO=-12.49+0.023 Vias...-O.334Q+8.460n
Equation 4: coating relative overthickness (AU) for multi pass
cladding, as function of cladding speed ~aser) in mm.min-J, overlapping (n) in mm and powder feed rate (Q) in g.min-J.
60 E ,S5<J ~ ~40 E " ~30 0 "> iii 20 E "0 * 10 3 ,. (J 0 0 ~ ~ ~~ ,-=~ y = 0.77X + 6.84 R' = 0.77
~--~-~
10 20 30 40 50 60 70Measured relativeoverthickness (mm)
Figure 13: Calculated relative overthickness for multi pass cladding according to Eq. 4 as function of the measured relative overthickness.
Conclusions
Using a combination of Taguchi and E.M. methods to design the experiments, the influence of different laser cladding parameters on the clad geometry and the WC content is investigated. For single pass and multi clad pass cladding, the predominant effects of the cladding speed and the powder feed rate on the clad size are confirmed. A relationship between the cladding parameters and the WC content is established and the influence of the out-of-focus distance was observed. For
the multi-pass cladding, a new parameter is defined to understand and predict the effect of the cladding parameters on the final geometry of a multi pass cladding.
Acknowledgements
The authors thank Martin Larouche for laser cladding experiments, Helene Gregoire and Dany Drolet for metallography and image analysis.
References
[1]: Y. Li, H. Yang, X. Lin, W. Huang, 1. Li and Y. Zhou, Mater. Sci. Eng. A, voL 360, nO1-2 (2003) 18-25.
[2]: J. Lin and W. M. Steen, J. Laser AppL, voLlO, n02 (1998) 55-63.
[3]: K. Van Acker, D. Vanhoyweghen, R. Persoons, J. Vangrunderbeek, Wear, voL 258 (2005) 194-202.
[4]: A. Yakovlev, Ph. Bertrand, I. Smurov, Thin Solid Films, voL 453 -454 (2004) 133-138.
[5]: D. K. Das, K. S. Prasad and A. G. Paradkar, Mater. Sci. Eng. A, voL 174 (1994) 75-84.
[6]: W. J. Tomlinson and A. S. Bransden, J. Mater. Sci. Let., vol. 13 (1994) 1086-1088.
[7]: L. Dubourg, H. Pelletier, D. Vaissiere, F. Hlawka and A. Comet, Wear, vol. 253 (2002) 1077.1085.
[8]: Y. Y. Qiu, A. Almeida and R.Vilar, J. Mater. Sci., vol. 33 (1998) 2639-2651.
[9]: Y. Y. Qiu, A. Almeida and R.Vilar, Scrip. Metal. Mater., vol. 33, n06 (1995) 863-870.
[10]: Y. T. Pei and 1. Th. M. De Hosson, Acta Mater., vol. 48 (2000) 2617-2624.
[11]: .L. Dubourg, D. Ursescu, F. Hlawka, A. Comet, Wear, vol. 258, 11-12 (2005) 1745-1754.
[12]: S. Ignat, P. Sallamand, D. Grevey, M. Lambertin,
Magnesium alloys laser cladding with side irifection of aluminium based powder, paper presented at 23rd International Congress on Applications of Lasers and Electro-Optics ICALEO, San-Francisco, CA, USA Oct. 4-7 (2004) Vol. LMP.
[13]: .L. Dubourg, A. Ott, F. Hlawka, A. Comet, Wear
behaviour of AI-based composite coatings obtained by laser cladding and reinforced with WC, TiC and SiC particles, , paper presented at Surface modification technologies 18, SMT
18, Dijon, France (2004).
[14]: L. Dubourg, B. Des Roches, A. Couture, D. Bouchard, H. R. Shakeri, Optimization of aluminium laser welding using
Tagushi and EM methods, paper presented at 23rd International Congress on Applications of Lasers and Electro-Optics ICALEO, San-Francisco, CA, USA Oct. 4-7 (2004). [15]: L. Dubourg, Experimental differences between aluminium welding of Tee and lap joints by a cw/Nd:YAG laser, paper presented at Trends in welding research, Pine Mountain, GA, USA May 16-19 (2005).
Conseil national de recherches Canada
National Research Council Canada
Institut des materiaux industriels Industrial Materials Institute
Fiche d'information et d'autorisation
pour documents internes, externes et conferences
Annee calendriE 2005
No de projet
Titre du document
Optimizationof laser cladding process using Taguchi and EMmethods for MMCcoating production
Statut du document
GeneralTypes de document
~ Sommaire (Abstract)
Ecrit final suivra ? DNon ~SiOui Date Septembre 2005D Document soumis pour publication
Si un sommaire (abstract) a ete soumis precedemment,
veuillez indiquer les numeros IMI CNRC
A
presenter dans Ie cadre deConference ITSC 2006
Date de la conference 15-17 Mai 2006 Lieu Seattle
A
paraitre dans Proceeding DateD
Rapport
D
TechniqueD
Industriel de serviceD
Autre (specifiez)
A etre completee par votre secretaire. Veuillez I'aviser lorsque I'information sera disponible. Annee calendrier
~
Publication
(janviera decembre)
D Revues et livres avec comite de lecture 2005
~
Proces-verbaux de conference avec comite de lectureD
Proces-verbaux de conference sans comite de lecture Si un sommaire (abstract) a ete soumis precedemment, veuillez indiquer les numeros IMIParu dans (vol. pp)
CNRC CNRC
Partenaires Remac Inc
Declaration d'invention Non Date
Demande de brevet deposee Non Pays
Si non, explications: Optimisation de procede
Auteur (nom prilnom)
I
Section
I
Groupe I Externe
* Laurent Dubourg 502300 502301
Lyne St-Georges Remac Inc
* Je certifie, en tant que premier auteur, que j'ai verifie avec le(s) partenaire(s) qu'il(s) n'a (n'ont) pas d'objection a ce document. Approbations:
Signature Chef de groupe
Signature Directeur de section
Date Date Signature
Directeurgeneral
Date
~CtQ~
-
I~() ~&1-~
CNRCOptimization of laser cladding process using Taguchi and EM methods
for MMC coating production
L. DUBOURGa,L. ST-GEORGESb
a Aluminium Technology Centre, National Research Council Canada, 501, Boul. de l'Universite,
Saguenay (Quebec), Canada, G7H 8C3.
b REMAC Industrial Innovators, 2953, Boul. du Royaume, Saguenay (Quebec), Canada, G7X 7V3.