HAL Id: hal-01015925
https://hal.archives-ouvertes.fr/hal-01015925
Submitted on 27 Jun 2014
HAL is a multi-disciplinary open access
archive for the deposit and dissemination of
sci-entific research documents, whether they are
pub-lished or not. The documents may come from
teaching and research institutions in France or
abroad, or from public or private research centers.
L’archive ouverte pluridisciplinaire HAL, est
destinée au dépôt et à la diffusion de documents
scientifiques de niveau recherche, publiés ou non,
émanant des établissements d’enseignement et de
recherche français ou étrangers, des laboratoires
publics ou privés.
Bayesian Programming for Topological Global
Localization with Fingerprints
Adriana Tapus, Stephan Heinzer, Roland Siegwart
To cite this version:
Adriana Tapus, Stephan Heinzer, Roland Siegwart. Bayesian Programming for Topological Global
Localization with Fingerprints. ICRA 2004, Apr 2004, New Orleans, United States. pp.598 - 603,
�10.1109/ROBOT.2004.1307214�. �hal-01015925�
Bayesian Programming for Topological Global
Localization with Fingerprints
Adriana Tapus, Stefan Heinzer, and Roland Siegwart
Autonomous Systems Lab
Swiss Federal Institute of Technology, Lausanne (EPFL) 1015 Lausanne, Switzerland
{Adriana.Tapus, Stefan Heinzer, Roland.Siegwart}@epfl.ch Abstract − This paper presents a localization algorithm for indoor
environments. The environmental model is topological and the approach describes how a multimodal perception increases the reliability for the topological localization problem for mobile robots, by using the Bayesian Programming formalism. For the topological framework the fingerprint concept is used. This type of representation permits a reliable and distinctive environment modeling. Experimental results of a mobile robot equipped with a multi sensor system composed of two 180° laser range finders and an omni-directional camera are reported.
I. INTRODUCTION
Research in mobile robot navigation has to focus on various issues. Environmental modeling, perception, localization and mapping are all needed in order to build a coherent working framework for navigation. Many methods have been proposed to represent an environment in the framework of autonomous navigation, from precise geometric maps based on raw data or lines up to purely topological maps using symbolic descriptions. Even though research has recently leaded to successful solutions, reliable and accurate perceptions of the environment, which is an important task for the localization of a robot, are rarely presented.
In this paper we will concentrate on the perception and environmental modeling within a topological context by using a probabilistic modeling, named Bayesian Programming. The robot has to recognize the objects that surround it in the environment in order to determine its own position. These objects must be modeled and recognized by means of the sensor data. Thus, a robust perception can be achieved by using redundancy, i.e. by combining the information obtained by several sensors.
Early works in topological localization [7] presented experiments in simulations, which avoided the perception problem. Following works [13] were concerned with controlled environments, where the perception with sonars was enough for the navigation purpose. Only recent works within the topological community address the perception problem in its whole complexity in the real world. Successful vision-based navigations are currently limited to indoor navigation because of its dependence on ceiling features [16], room geometry, or artificial landmark placement [14]. Other means for visual localization are applicable both indoors and outdoors, however
they are designed to collect image statistics while foregoing recognition of specific scene features, or landmarks [15, 18]. In this context [8] introduced the fingerprint concept, but its perception was restricted to the CCD camera. In [9] the extension to laser scanner and an omni-directional camera in a topological framework is presented. In the current paper it is shown how the fingerprint concept and Bayesian formalism can be closed in within the same framework.
The rest of the paper is structured as follows. We present in Section II the fingerprint concept, the way it is encoded and generated. In Section III we define the Bayesian Programming formalism. Section IV is dedicated to the probabilistic method used for the fingerprint matching. Experimental results are presented in Section V. The system will use both a laser scanner and an omni-directional camera for feature extraction. The experiments will focus on some important characteristics needed by a topological approach, like uniqueness and distinctiveness. To conclude, Section VI contains a discussion of the proposed approach and further research directions.
II. THE FINGERPRINT CONCEPT IN A TOPOLOGICAL
FRAMEWORK
The topological approach gives a compact representation and allows high-level symbolic reasoning for map building and navigation. With this method we try to eliminate the perceptual aliasing (i.e. observations at multiple locations are similar) and to improve the distinctiveness of places in the environment. To maximize the reliability in navigation, the information from all sensors available to the robot must be used. For this, the notion of fingerprint as described in [8, 9] is used. This characterization of the environment is especially interesting when used within a topological localization and multiple modality framework.
A. Fingerprint encoding
A fingerprint is a circular list of features, where the ordering of the set matches the relative ordering of the features around the robot. We denote the fingerprint sequence using a list of characters, where each character represents the instance of a specific feature type. In our case we choose to extract color patches and vertical edges from visual information and corners and beacons from laser scanner. We decided to use the letter ‘v’ to characterize an edge, the letters A,B,C,...,P to Proceedings of the 2004 IEEE
International Conference on Robotics & Automation New Orleans, LA • April 2004
represent hue bins, the letter ‘c’ to characterize a corner feature and the letter ‘b’ to characterize a beacon feature. Details about the visual features extraction can be found in [8, 11] and laser scanner features extraction can be found in [1].
B. Fingerprint generation
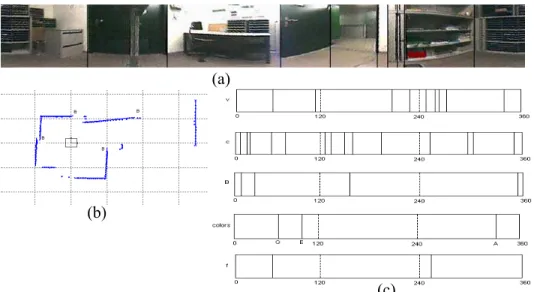
The fingerprint generation is performed in three steps (see Figure 1). The extraction of the different features (e.g. vertical edges, corners, color patches, beacons) from the sensors is the first phase of the fingerprint generation. The order of the features, given by their angular positions (0..359°) is kept in an array. At this stage a new type of feature, the virtual feature ‘f’ is introduced. It reflects a correspondence between a corner and an edge. The ordering of the features in a fingerprint sequence is highly informative and for that reason the notion of angular distance between two consecutive features will be added. This adds geometric information and increases once again the distinctiveness between fingerprints. Therefore, we introduced an additional type of feature, the empty space feature ’n’, for reflecting angular distance. Each ’n’ covers the same angle of the scene (20°). This insertion is the last step of the fingerprint generation. More details can be found in [9].
III. BAYESIAN PROGRAMMING FORMALISM The approach presented in this paper is based on the Bayesian Programming (BP) formalism. It is briefly described here, but more details can be found in [2, 4, 10].
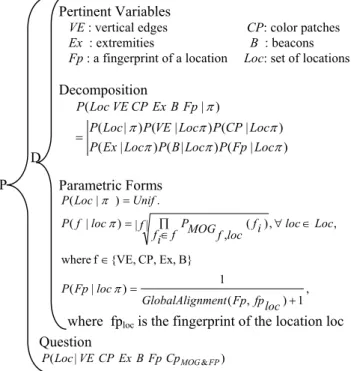
The BP formalism allows using a unique notation and structure to describe probabilistic knowledge and its use. The elements of a Bayesian Program are illustrated in Figure 2.
A BP is divided in two parts: a description and a question. The first corresponds of the declarative component. The purpose of a description is to specify a method to compute a joint distribution over a set of relevant variables {X1,X2,…,Xn},
given a set of experimental data δ and a preliminary knowledge π. This joint distribution is given by P(X1,X2,…,Xn │ δ π) and is
defined by three components: the set of relevant variables (and their domains), the decomposition of the joint distribution as a product of simpler terms (these terms describes dependant relationship between variables), and finally by the parametric forms assigned to each of the terms appearing in the decomposition. The second part is of a procedural nature, and consists of using the previously defined description with a question, i.e. computing a probability distribution of the form
P(Searched │ Known). Answering a question is an inference
process, which computes a value for the variable Searched according to P(Searched │ Known). It is well known that general Bayesian inference is a very difficult problem, which may be practically intractable. In the following we will assume that the inference problems are solved and implemented in an efficient manner by an inference engine.
IV. FINGERPRINT MATCHING
The string-matching problem is not easy. Usually strings do not match exactly because the robot may not be exactly located on a map point and/or some changes in the environment or perception errors occurred. The standard algorithms are quite sensitive to insertion and deletion errors, which cause the string lengths to vary significantly. The method adopted previously in the fingerprint approach for sequence matching is inspired by
Figure 2: Structure of a Bayesian Program
(c)
(a)
(b)
Figure 1. Fingerprint generation. (a) panoramic image with the vertical edges and color patches detection ‘v’ and color; (b) laser scan with extracted corners ‘c’ and beacons ‘b’; (c) the first four images depict the position (0 to 360°) of the vertical edges, the corners, the beacons and the colors (G-green, E-light green, and A-red) respectively. The fifth image describes the correspondence between the vertical edges features and the corner features. By regrouping all this results together and by adding the empty space features, the final fingerprint is: cbccbnfGcnEnvccncbcvncnnfvvvnccAcb
the minimum energy algorithm used in stereovision for finding pixels in two images that correspond to the same point of a scene [6]. More details can be found in [8] and [9]. Our current approach is a combination of the global alignment algorithm and the Bayesian formalism and it is described below.
A. Probabilistic fingerprint matching
The new approach presented here is constructed in two steps. The first step is the phase of supervised learning where the robot inspects several locations, denoted by Loc. From each location loc∈Loc the robot extracts the fingerprint data,
as explained in Section II B and stores it along with the name of the location in a database, denoted by the symbol π. The second step is the phase of application, when we want the robot to localize itself in the environment. To answer the question “Where am I?” the robot will extract the fingerprint
fp of its current surroundings and solve the basic formula of
probabilistic localization
This means that if fingerprints are associated to each location, then the actual location of the robot may be recovered by comparing the fingerprint fp with the database of known locations and choosing the location loc* which has the highest probability. In the following we show how P(loc|fpπ) can be
solved by the Bayesian Programming technique.
Figure 3 illustrates the Bayesian Program used for the fingerprint matching. The features are denoted by: VE the set of vertical edges and CP the set of color patches extracted by the omni-directional camera; Ex the set of line extremities and
B the set of beacons extracted from the data given by the laser
scanner. For the fingerprint of a location, which is encoded as a circular string the notation Fp is used, and for the set of known (learned) locations the notation Loc is employed. Although the fingerprint string Fp, constructed over all the
features (see [11]), adds some redundancy to the system, it introduces at the same time valuable information about the relative order of the features, which will improve the results. We assume that the variables VE, CP, Ex, B and Fp are independent from one another. We consider that the features (VE, CP, Ex, B) are dependent on the location and these dependencies lead to the decomposition described in the Bayesian Program (Figure 3).
From the result of the decomposition formula (see Figure 3) we can distinguish three different kinds of probability distributions.
• Since we have no a priori information about locations, we consider each location to be equally probable and consequently we express the probability of a location given all the prior knowledge as a uniform distribution.
• To determine the probability of one feature f, where
f ∈ {VE, CP, Ex, B}, given the location and all the a
priori knowledge, we suggest to express this probability as the likelihood of the new feature data f with respect to the distribution of the same feature as encountered at the given location during the learning phase. We calculate the distribution as a mixture of Gaussians (MOG) in angle space, optimizing the mixture parameters by making use of the Expectation Maximization (EM) algorithm. More details about these two concepts are described in the next three sub-sections.
• To calculate the probability of the fingerprint sequence given the location and all the prior knowledge, we will use the global alignment algorithm [12] used usually for the alignment of DNA sequences and so let GlobalAlignment(Fp, fploc) be a function yielding the minimal cost of the global alignment algorithm of two fingerprint strings.
Obviously, the three equations from the Parametric Forms will solve the basic question described in the Bayesian Program (see Figure 3).
As stated above, the probability of a feature knowing the location and all the prior knowledge is computed using Mixture of Gaussians and Expectation Maximization (EM) algorithm. These two concepts will be described briefly in the next two sections.
B. Mixture of Gaussians
Mixture of Gaussians (MOG) is a widely used approach when estimating the distribution of data. A MOG in the parameters θ is a probability density function, which results from combining k Gaussian probability density functions in a weighted sum:
where wi is the weight, µi and σi the mean and the standard
deviation of the ith mixture component, which itself is a Gaussian probability density function given by the formula Pertinent Variables
VE : vertical edges CP: color patches Ex : extremities B : beacons
Fp : a fingerprint of a location Loc: set of locations Decomposition ) | ( ) | ( ) | ( ) | ( ) | ( ) | ( ) | ( π π π π π π π Loc Fp P Loc B P Loc Ex P Loc CP P Loc VE P Loc P Fp B Ex CP VE Loc P = Parametric Forms . ) | (Loc Unif P π = B} Ex, CP, {VE, f where , , | | ( ) , ) | ( ∈ ∈ ∀ ∏ ∈ = f loc Loc f i f i f loc f MOG P loc f P π , 1 ) , ( 1 ) | ( + = loc fp Fp nment GlobalAlig loc Fp P π Question ) |
(Loc VECPExBFpCpMOG& FP P
P D
where fploc is the fingerprint of the location loc
Figure 3: The fingerprint matching formalism written in BP
(1) ) | ( max arg * Ploc fpπ loc Loc loc∈ =
∑
= = k i i i MOG x wp x p 1 ) (θ ( ) ( |θ ) } , , { i i i i w µ σ θ = (2)(3)
The normalization factor η turns the Gaussian function in an actual probability distribution function, guaranteeing that the integral over the function evaluates to 1:
1 ) |
( =
∫
p x θiIn angle space, η is the inverse of the integral from -π to π over the un-normalized Gaussian function, resulting into
i i erf πσ σπ η 2 2 2 1 ⎟⎟⎠ ⎞ ⎜⎜⎝ ⎛ =
where erf(x) is the error function
∫
− = x t dt e x erf 0 2 2 ) ( πSince we want also pMOG to be a probability density
function, the weights wi must sum to 1, such that the integral
over the distribution is 1:
The parameters of the complete MOG are then } ... , ... , ... { } ... { 1 n 1 n 1 n 1 n MOG θ θ w w µ µ σ σ θ = =
The MOG is a compromise between the efficient but parametric models on one side, and the flexible but expensive non-parametric methods like histograms or kernel methods on the other side.
C. Expectation Maximization
Finding the optimal parameters θMOG of a Mixture of
Gaussians (MOG) over a set of data points X is not trivial. A widely used approach to solve this problem is the Expectation Maximization (EM) algorithm [3].
This algorithm starts with some initial estimation of the parameters θ, improving them with each iteration. The ‘improvement’ is defined in the sense that the log-likelihood of the data X increases with respect to the new parameters θnew. In the case of mixtures of Gaussians, it is possible to derive the new parameters θ new analytically:
(11) where N is the number of data points: N = |X| and distAS(a, b)
the distance function in angle space. It takes two angles a, b and returns the shortest way to go from a to b. The sign of the distance is positive if going clockwise, and negative if going counter clockwise. The iteration is typically terminated when the increase of the log-likelihood falls below some threshold value ε.
D. An example
Let us illustrate the P(f=VE│loc π) with an example. We start with a set of 13 occurrences of vertical edges and we calculate the MOG for it. We then generate a second set, this time with 18 occurrences, and evaluate the probability
P(f=VE│loc π) for both data sets with the same MOG
parameters (see Figure 4 and Figure 5). As expected, the resulting value is for the first data set significantly higher than
for the second, since the parameters of the MOG were chosen to maximize the first set.
Figure5: Evaluation of P(f=VE│loc π) for the some other data set, resulting in a smaller value above, since the MOG is not optimal for this data.
Note how flexible this method is with respect to the number of features per set: A MOG can be generated from a set of any number of features, and it can be evaluated later for samples of arbitrary length.
V. EXPERIMENTAL RESULTS
We first tested this approach in simulation on a variety of synthetic office environments, where it is easier to run extensive experiments. We then confirmed these results by running experiments in our real office environment with a robot. ⎟⎟⎠ ⎞ ⎜⎜⎝ ⎛− − = = 2 2 2 ) ( exp ) , , ( ) | ( i i i i i x x N x p σ µ η σ µ θ
∑
wi =1∫
pMOG(x|θ)=1Figure 4: Evaluation of P(f=VE│loc π) for the original data set
(4) (5) (6) (7) (8) (9) (10)
∑
= = N i i new k p k x N w 1 ) , | ( 1 θ∑
∑
= = + = N i i i N i i old k AS old k new k x k p x k p x dist 1 1 ) , | ( ) , | ( ) , ( θ θ µ µ µ∑
∑
= = + = N i i i old k N i i AS old k new k x k p x dist x k p 1 2 1 ) , | ( ) , ( ) , | ( θ µ θ σ σ 601A. Simulation Experiments
For ten synthetic office environments, four observations of a feature f∈{VE, CP, Ex, B} were generated, such as the four generations were similar but not identical. The four observations of a feature in a certain place were disturbed by the addition of a small random distance, with a standard deviation of five degrees. After the generation of the dataset, a MOG of k component was calculated for the combination of the four observations of each place. With these ten MOGs we have classified the 40 observations, by calculating the likelihood of the angular feature according to the MOG. For a given observation, the classification is successful, if the highest value of the MOG corresponds to the correct place.
The simulation results for all the combination of k, with k ∈{3, 4, 5} and N (the number of occurrences of a feature f, in our case f = VE) with N∈{5, 10, 15, 20, 25, 30, 35}, is described in the following table (see Table 1).
TABLEI.The table shows the results of simulation with different parameters for the number of k MOG components and N the number of observations of a
feature.
N = 5 = 10 = 15 = 20 = 25 = 30 = 35
k = 3 55.5% 81.5% 93.0% 93.5% 96.0% 97.5% 99.5%
k = 4 66.5% 93.0% 98.0% 95.0% 98.0% 99.5% 99.0%
k = 5 80.0% 98.5% 98.0% 99.5% 100% 99.5% 100%
For the f∈{CP, Ex, B} the process was similar to the shown one. The simulation results are significant and after the combination of all elements it was noted that:
a. with the increase of the MOG components one sees an improvement of the results
b. with the increase of the number of observations N of a feature one sees an improvement of the results B. Robot Experiments
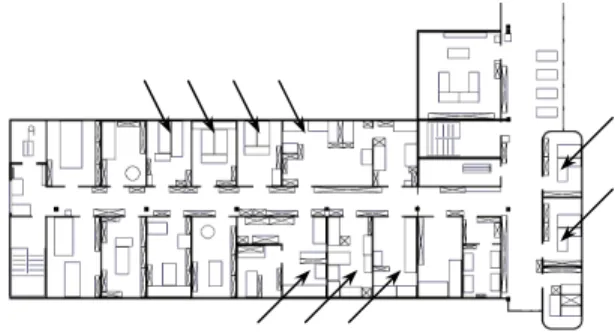
In order to verify the simulation results, we repeated the experiments on a real robot. Thus, the approach has been tested in a 50 x 25 m2 portion of our institute shown in figure 6.
Figure 6: The test environment. The arrows indicate the rooms in which the experimentation has been done. The tenth room is not represented on the image.
For the experiments, Donald Duck (see Fig. 7), a fully autonomous mobile robot, has been used.
Its controller consists of a VME standard backplane with a Motorola PowerPC 604 microprocessor clocked at 300 MHz running XO/2, a hard real-time operating system. Among its peripheral devices, the most important are the wheel encoders, two 180° laser range finders and an omnidirectional camera. The panoramic vision system depicted in figure 8 uses a mirror-camera system to image 360° in azimuth and up to 110° in elevation.
Figure 8: The panoramic vision system. The camera has a 640x480 pixels resolution and an equiangular mirror is used so that each pixel in the image covers the same view angle.
The use of an omnidirectional camera combines the advantages of the SICK laser range finders (e.g. an angle of view of 360°) and the capability of detecting verticals. This will bring considerable information to the system.
The test setup was the following: The robot extracted the four features in ten offices ten times. Eight times it was placed on a circle of 40 cm to 70 cm of radius, yielding the training data, and two times inside the same circle, yielding the test data. The mean number of feature occurrences in each measurement is summarized in the following table:
TABLEII.The table shows the mean number of occurrences of instances of the same feature type during the measurements.
During all measurements, the orientation of the robot was approximately the same. This simplification could be omitted by letting the robot estimate his orientation by considering all rotations of the fingerprint string.
In order to complete the training, for each location and each feature type the mixture of Gaussian and the resulting fingerprint string, considering all the features, were calculated.
mean occurrences
vertical edge 5.6
extremity 5.6
color patch 2.7
beacon 3.9 Figure 7: The fully autonomous robot Donald Duck. The panoramic vision system has been mounted right above the wheels. So, for a given position, the fingerprint extraction does not depend on the robot’s orientation.
In the application phase, the classification of the 20 test samples was used to answer the following questions:
1. How does the fingerprint string matching using global alignment compare to the former matching using the minimum energy algorithm?
2. What is the significance of each feature type using the MOG approach?
3. How does the combination of several feature types improve the MOG approach?
4. What is the overall classification capability of the system using both string matching and MOG approach combined in a Bayesian program?
The results are summarized in the following tables: TABLE III. Classification using string matching only, comparing global alignment and
minimum energy algorithms.
In Table III, one can see the improvement from using global alignment instead of the minimum energy algorithm. Since the number of occurrences of the beacon and the color patch feature was too small to give significant results, they were omitted for the MOG calculations. Nevertheless they were used for the fingerprint strings. kMOG signifies the number of mixture
components used for the mixture (Table IV).
TABLE IV. Results using single features only (vertical edge, extremity), the combination of these features, and finally classification using all the features
and the fingerprint string matching.
The success of a room classification is defined as the detection of the highest probability. The results have given a percentage of successful matches of 82.4% (see Table IV). However, false-classified rooms delivering high probability (second or third highest probability), which are typical results in the experiments, entail important information, which can be used in combination with a localization approach such as a Partial Observable Markov Decision Process (POMDP) [5, 17].
VI. CONCLUSION AND FUTURE WORK
This paper presents a method for topological localization by using the Bayesian Programming methodology with the fingerprint concept. This kind of representation permits a very compact and computationally efficient representation of the environment for mobile robot navigation. Using different features from multiple sensors allows the improvement of the distinctiveness of the fingerprints as it has been proven in section V. Even if the correct room does not always have the
highest probability, this information can be still used for localization e.g. by employing a localization approach like a POMDP. Future works will concentrate on the introduction of an average fingerprint for each node, on an automatic generation of nodes by using a distance between the
fingerprints and on the introduction of this concept in a multi-resolution Simultaneous Localization and Mapping (SLAM).
ACKNOWLEDGMENTS
The authors would like to thank to the BIBA IST-2001-32115 EU project, which is funding this research.
REFERENCES
[1] Arras, K.O. and Siegwart, R, Feature Extraction and Scene Interpretation for Map-Based Navigation and Map Building, In Proceedings of the Symposium on Intelligent Systems and Advanced Manufacturing, Pittsburgh, USA, October 13-17,1997.
[2] Bessière, P., et al., Survey: Probabilistic Methodology and Techniques for Artefact Conception and Development, Technical Report INRIA, RR-4730, European IST BIBA project, 2003.
[3] Bilmes, J. A., A Gentle Tutorial of the EM Algorithm and its Application to Parameter Estimation for Gaussian Mixture and Hidden Markov Models, ICSI-TR-97-021, 1997
[4] Bellot, D., R. Siegwart, P. Bessière, A. Tapus, C. Coué and J. Diard (2003), Bayesian Reasoning for Real World Robotics: Basics, Scaling and Example, Dagstuhl Proceedings on Embodied AI, LNCS (Lecture Note in Computer Science), Springer.
[5] Cassandra, A. R., L. P. Kaelbling, et al. (1996). Acting under Uncertainty: Discrete Bayesian Models for Mobile-Robot Navigation.
IEEE International Conference on Robotics and Automation, Osaka,
Japan.
[6] Kanade, T., Ohta, Y., Stereo by Intra- and Inter-Scanline Search Using Dynamic Programming, IEEE Transactions on pattern analysis and
machine intelligence, Vol PALMZ No 3, March 1985
[7] Kuipers, B. J. and Y. T. Byun (1987). A qualitative approach to robot exploration and map-learning. Workshop on Spatial Reasoning and
Multi-Sensor Fusion, Los Altos, CA, USA, Morgan Kaufmann.
[8] Lamon, P., I. Nourbakhsh, B. Jensen and R. Siegwart (2001). Deriving and Matching Image Fingerprint Sequences for Mobile Robot Localization. IEEE International Conference on Robotics and
Automation, Seoul, Korea.
[9] Lamon, P., Tapus A., Glauser E., Tomatis N., Siegwart R. (2003), Environmental Modeling with Fingerprint Sequences for Topological Global Localization, In Proceedings of the IEEE International Conference on Intelligent Robot and Systems, Las Vegas, USA, October 27-30.
[10] Lebeltel, O., P. Bessière, J. Diard and E. Mazer (2003), Bayesian Robot Programming, In Autonomous Robots (accepted for publication). [11] Martinelli, A., Tapus, A., Siegwart, R. (2003), Multi-resolution SLAM for
Real World Navigation, In Proceedings of the 11th International Symposium of Robotics Research (ISRR03), Siena, Italy, October 19-22. [12] Needleman, S. and Wunsch, C. (1970), A general method applicable to the search for similarities in the amino acid sequence of two proteins, J. Molecular Biology, 48:443-453.
[13] Nourbakhsh, I. (1998). Dervish: An Office-Navigating Robot. Artificial Intelligence and Mobile Robots. D. Kortenkamp, R. P. Bonasso and R. Murphy, The AAAI Press/ The MIT Press: 73-90.
[14] Nourbakhsh, I., J. Bodenage, et al. (1999). An Affective Mobile Robot Educator with a Full-Time Job. Artificial Intelligence 114(1-2): 95-124. [15] Thrun, S., Finding Landmarks for Mobile Robot Navigation, IEEE
International Conf. on Robotics and Automation, May 1998.
[16] Thrun, S., Bennewitz, M., Burgard, W., Cremers, A.B., Dellaert, F., Fox, D., Hahnel, D., Rosenberg, C., Roy, N., Schulte, J., Schulz, D., MINERVA: a second-generation museum tour-guide robot, IEEE
International Conf. on Robotics and Automation (Cat. No.99CH36288C)
1999.
[17] Tomatis, N., I. Nourbakhsh, and R. Siegwart (2003). Hybrid simultaneous localization and map building: a natural integration of topological and metric. Robotics and Autonomous Systems, 44:3-14. [18] Ulrich, I. and I. Nourbakhsh (2000). Appearance-Based Place
Recognition for Topological Localization. IEEE International
Conference on Robotics and Automation, San Francisco, CA.
right classifications mean rank
minimum energy 62.4% 1.87
global alignment 87.1% 1.21
kMOG = 3 kMOG = 4 kMOG = 5
vertical edge 42.1% 2.58 47.1% 2.47 55.6% 1.82
extremity 55.6% 1.65 51.1% 1.71 47.1% 1.71
ve & ex 58.8% 2.00 66.7% 1.82 66.7% 1.67 ve, ex & fps 61.1% 1.78 70.6% 1.58 82.4% 1.23