Publisher’s version / Version de l'éditeur:
Vous avez des questions? Nous pouvons vous aider. Pour communiquer directement avec un auteur, consultez la première page de la revue dans laquelle son article a été publié afin de trouver ses coordonnées. Si vous n’arrivez Questions? Contact the NRC Publications Archive team at
[email protected]. If you wish to email the authors directly, please see the first page of the publication for their contact information.
https://publications-cnrc.canada.ca/fra/droits
L’accès à ce site Web et l’utilisation de son contenu sont assujettis aux conditions présentées dans le site LISEZ CES CONDITIONS ATTENTIVEMENT AVANT D’UTILISER CE SITE WEB.
Combustion Institute Canadian Section, 2007 Spring Technical Meeting [Proceedings], 2007
READ THESE TERMS AND CONDITIONS CAREFULLY BEFORE USING THIS WEBSITE. https://nrc-publications.canada.ca/eng/copyright
NRC Publications Archive Record / Notice des Archives des publications du CNRC :
https://nrc-publications.canada.ca/eng/view/object/?id=fe3b8f20-073f-452f-96e4-45edace1979e https://publications-cnrc.canada.ca/fra/voir/objet/?id=fe3b8f20-073f-452f-96e4-45edace1979e
Archives des publications du CNRC
This publication could be one of several versions: author’s original, accepted manuscript or the publisher’s version. / La version de cette publication peut être l’une des suivantes : la version prépublication de l’auteur, la version acceptée du manuscrit ou la version de l’éditeur.
Access and use of this website and the material on it are subject to the Terms and Conditions set forth at
Sensitivity limits in plume transmissivity measurements using sky scattered solar radiation
SENSITIVITY LIMITS IN PLUME TRANSMISSIVITY MEASUREMENTS
USING SKY SCATTERED SOLAR RADIATION
C. Yang1, K.A. Thomson2, and M.R. Johnson1,* 1
Mechanical & Aerospace Engineering, Carleton University
2
Combustion Group, Institute for Chemical Process & Environmental Tech., NRC
Introduction
In many industrial combustion processes including gas flaring, biomass combustion, and coal-fired boiler operation, plumes of soot and particulate matter (PM) may be emitted into the
atmosphere. Although exposure to fine particulate matter (i.e. PM2.5 or particulate matter less
than 2.5 microns in size), has been linked to serious health problem such as lung cancer and cardiovascular disease [1, 2], accurately measuring soot / PM emissions in open plumes is a significant challenge for which no broadly accepted quantitative standards exist. This paper is part of an ongoing investigation of a sky-scattered solar radiation based optical diagnostic for plume transmissivity measurement. The work presented here is the key component of a project focused on developing an optical method to quantify soot (PM) emission rates from flares with known sensitivity and uncertainty.
A two-dimensional line-of-sight attenuation technique was applied to measure plume transmiss-ivity for several sample plumes, which were generated by thermophoretically depositing flame generated soot onto microscope slides. The test samples had optical transmissivities ranging, from 0.4 to 0.983. Three light sources were considered in these experiments: collimated light, diffuse light, and sky-scattered solar radiation. Two approaches to calculating optical attenuation data were investigated and compared: a 3-image analysis routine that has been successfully used in the lab, or a single-image routine that would be applicable to diffuse sky radiation as the light source in a field setting. The results presented are focused on three main issues: 1) quantifying the uncertainty introduced by using the single-image analysis routine for different plume sizes; 2) estimating a minimum detectable limit in terms of soot emission rate when using sky radiation as the light source; and 3) estimating the potential impact of beam steering due to temperature related refractive index gradients on measurements in actual industrial plumes.
Methodology
The mass emission rate of soot from plumes is functionally related to plume transmissivity as specified in Eq. (1) [3]. soot soot sa , ln( ( ))d 6 ( ) (1 ) u m y E m λ λ λ y ρ λ τ π ρ − = +
∫
& (1)where m&soot is mass emission rate of soot; u is plume velocity, ρsoot is soot density and taken to
be 1.8-1.9 g/ml as used by Flower and Bowman [4]; λ is wavelength of the transmissivity
measurement and equals 577 nm in the experiment; is a wavelength dependent refractive
index function for soot and equals 0.258 as used by Snelling [5];
λ ) (m E sa,λ ρ is the wavelength
dependent ratio of scatter to absorption for the light traveling along a chord through the plume and varies from 0.2-0.4 for overfire soot from a variety of fuels in turbulent diffusion flames as
determined by Koylu and Faeth [6]; and τλis plume transmissivity measured normal to the plume propagation direction.
Fig.1 Schematic optical layout for 2D transmission measurement with sky radiation (see ref. 7 for collimated & diffuse light set up)
Plume transmissivity was measured using the 2-Dimensional line-of-sight attenuation (2D-LOSA) optical diagnostic technique [5]. The experimental setup and two analysis methods (3-image and 1-image) have been previously described in detail [7] and are only briefly reviewed here. In the original implementation of 2D LOSA, 3 images (background, dark, and transmission) are captured to measure the transmissivity of the plume in the lab. The background image records the intensity of the light source in the absence of the attenuating medium; the dark image records the intensity with no attenuating medium and the light source blocked; and the transmission image records the intensity of light from the source after it passes through the attenuating medium. The measured
light intensity without the attenuating source (i.e. Io) is equal to background – dark and the
measured light intensity with the attenuating source (i.e. I) is equal to transmission - dark. The
ratio of I / Io is equal to the soot transmissivity, IJ. However in the field application of 2D LOSA,
to measure plume transmissivity using sky radiation as the light source, it is impossible to isolate the background from the attenuating medium and impossible to measure the dark image. While spurious light entering the lens and reaching the detector can be assumed minimal, the images still include a bias due to fixed and dark current counts on the CCD. These are quantified once by recording an image with the lens covered. Thereafter, a fixed bias corrected transmission image alone is used to generate an interpolated background for the plume transmissivity calculation, referred to as a 1-image method.
N P I M X Y Z SKY SCATTERED RADIATION
I: Camera lens 105mm FL M: CCD camera with 577nm filter N: Flat mirror P: Sample plume Sky light N P I M X Y Z X Y Z SKY SCATTERED RADIATION
I: Camera lens 105mm FL M: CCD camera with 577nm filter N: Flat mirror
P: Sample plume
Sky light
To generate the interpolated background, a section of an image is removed where a plume is present, then the intensity data on either side of the plume image location is used to interpolate a synthetic background in the region of the plume. Interpolation is performed using a Loess algorithm, which relies on a locally weighted least square method to fit a quadratic profile to the measured intensity data. The span argument of the Loess function controls the range of the neighboring data points used in the calculation for a given data point. The span is specified as the fraction of the total number of data points in the data set. A larger span increases the smoothness but decreases the resolution of the smoothed data set, while a small span decreases the smoothness but increases the resolution of the smoothed data set. The optimal span value depends on the data set, and is found through experimentation.
Plume size
The reliability of generating the interpolation background from a single plume image has been proven for different light sources [7]. However, the size of the plume relative to the background bordering it must be considered. The plume size is defined here to be the plume width relative to the image width.
To test the background interpolation bias for different plume sizes, 30 background images were collected (i.e. images where no attenuating medium is present) with sky-scattered solar radiation.
For each image, 10 different plume widths were evaluated from 1% to 90% of the image width. For each plume size, 13 different values of span were tested from 0.1 to 0.9. The background
interpolation bias, in terms of 2 0,fit 0
2
(1/ ) w ln( / )d
w
w I I
−
∫
x , for the optimal span value for each plumewidth is summarized in Fig. 2. Data points are calculated means of the 30 individual measurements with error bars indicating student-t confidence intervals. Compared to the measured background, the background interpolation algorithm introduces uncertainty of less than
5.27× if the plume width is less than 60% when using the sky-scattered radiation as the light
source (see Fig.2a).
4
10−
0 20 40 60 80 100
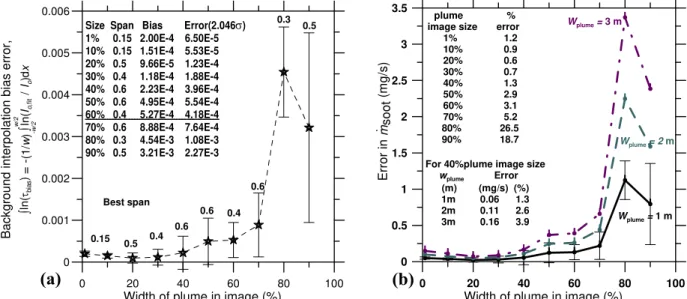
Width of plume in image (%) 0 0.001 0.002 0.003 0.004 0.005 0.006 Ba ckg ro und in te rp o lat ion bias e rr o r, ∫ ln (τbi as ) = -(1 /w ) ∫ ln (Io,f it / Io )d x w/ 2 -w /2 0.15 0.5 0.4 0.6 0.6 0.4 0.6 0.3 0.5 Best span
Size Span Bias Error(2.046σ)
1% 0.15 2.00E-4 6.50E-5 10% 0.15 1.51E-4 5.53E-5 20% 0.5 9.66E-5 1.23E-4 30% 0.4 1.18E-4 1.88E-4 40% 0.6 2.23E-4 3.96E-4 50% 0.6 4.95E-4 5.54E-4 60% 0.4 5.27E-4 4.18E-4 70% 0.6 8.88E-4 7.64E-4 80% 0.3 4.54E-3 1.08E-3 90% 0.5 3.21E-3 2.27E-3 0 20 40 60 80 1
Width of plume in image (%)
00 0 0.5 1 1.5 2 2.5 3 3.5 Error in ⋅ msoo t (m g /s) Wplume = 1 m Wplume = 2 m Wplume = 3 m
For 40%plume image size wplume Error (m) (mg/s) (%) 1m 0.06 1.3 2m 0.11 2.6 3m 0.16 3.9 plume % image size error
1% 1.2 10% 0.9 20% 0.6 30% 0.7 40% 1.3 50% 2.9 60% 3.1 70% 5.2 80% 26.5 90% 18.7 (a) (b)
Figure 2 a) Background interpolation bias for different plume sizes at best span. b) Associated error in due to background interpolation for an assumed plume velocity of 5 km/h
soot
m& The associated uncertainty of soot emission rate contributed by the background interpolation bias is shown in Fig. 2b for a plume velocity of 5 km/h. With a 40% plume size, the error of soot emission rate caused by background interpolation is less than 4% for a plume diameter less than 3 m compared to the estimated soot emission rate of 4.24 mg/s from a solution gas flare [3].
Minimum detectable limit
After considering the plume size, we now turn our attention to test the minimum detectable limit in the transmissivity measurement. To do so, we need a stable soot source. Since the burner used previously [7,10] can not generate a steady plume of soot over long time-periods, a sample plume is simulated for this purpose. A sample plume is made by passing a piece of microscope slide through a plume generated by the previous burner. Due to a temperature gradient between the plume and the glass, small particles of soot migrate from the plume and cumulate on the slide (thermophoretic sampling). By adjusting the flow rate of burner and the exposure time, eight
sample plumes were made with the transmissivity,τλ, ranging from 0.4 to 0.983.
To test the detectable limit of the transmissivity measurement, experimental data was gathered for three light sources: collimated light, diffuse light, and sky-scattered solar radiation. For each light source, 30 plume attenuating images for each sample plume were gathered. Two reference images (background and dark) for collimated and diffuse were collected. Three data sets were
evaluated and compared by using the 3-image and 1-image methods. For the 1-image method, the background intensity is generated from the intensity data to the left and to the right of the plume in transmission image using the Loess fit function.
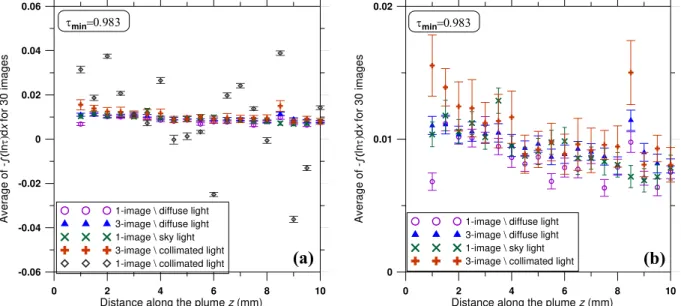
Fig. 3 shows comparison plots of -∫ln(τλ)dx values for the sample plume with the highest
transmissivity (τλ = 0.983) for the 1-image and 3-image methods as a function of distance above
an arbitrary point of the plume. Data points are shown in Fig.3a for the calculated mean of the 30 individual measurements with error bars indicating the 95% confidence interval. For both diffuse light and sky-scattered light sources, the agreement between the 1-image and 3-image methodologies appears well within experimental uncertainty. There is notable additional scatter in the data for the 1-image method with collimated light. Fig.3b zooms in and highlights the differences in the data of Fig.3a without the 1-image collimated data set. From this figure we can see that the sky light measurements agree well with the 3-image diffuse light measurements and are also close to the 3-image collimated results. These data suggest that the 1-image method with sky radiation as source light is a promising method for plume transmissivity measurements in the field setting.
0 2 4 6 8
Distance along the plume z (mm)
10 -0.06 -0.04 -0.02 0 0.02 0.04 0.06 Av era ge o f -ln τ) d x for 30 i m ag e s
1-image \ diffuse light 3-image \ diffuse light 1-image \ sky light 3-image \ collimated light 1-image \ collimated light
τmin=0.983
0 Distance along the plume z (mm)2 4 6 8
10 0 0.01 0.02 Av era ge o f -ln τ) d x fo r 30 ima ges
1-image \ diffuse light 3-image \ diffuse light 1-image \ sky light 3-image \ collimated light
τmin=0.983
(a) (b)
Figure 3 a) Comparison of 1-image and 3-image LOSA techniques for ∫ln (τ) with 3 light sources. b) Zoomed-in plot without 1-image, collimated light data
To quantify the difference between the 1-image method with sky light and the 1- and 3-image methods with diffuse light, we further evaluated the averages of 30 individual measurements of each of the 8 sample plumes at multiple heights along the plume, using each light source. Fig. 4 shows the % uncertainty in the measurements (where the 3-image, diffuse light technique has been taken as a standard). As expected, the uncertainty increases sharply as the transmissivity of the samples approaches unity. The results suggest that with the current set-up, comparative uncertainties of less than 40% are achievable for plume transmissivities of less than 0.983. Improvements to this upper limit on transmissivity might be possible with an improvement to the synthetic plumes. For example, reflections from the microscope slides (which are purely an artifact of our synthetic sample) could be a source of noise in the results. Anti-reflective coated slides should be considered for future tests.
Assuming the 40% uncertainty is acceptable in the absence of a competing quantitative standard, the ultimate, theoretical minimum detectable limit using this sky-scattered radiation, line-of-sight optical attenuation approach has been estimated. Figure 5 shows the minimum detectable mass flow rate of soot per metre of plume width using the 1-image method with sky radiation and assuming a transmissivity limit of 0.983. Soot emission rates corresponding to the region above the dashed line are deemed detectable. The detectable limits increase with increasing of plume velocity. At a plume velocity of 5 km/hr for 1 m wide plume, the theoretical minimum mass flow rate of soot that can be detected is 1.9 mg/s.
0.86 0.88 0.9 0.92 0.94 0.96 0.98 1
Test plume minimum transmissivity, τmin
-70 -50 -30 -10 10 30 50 70 % U n certaint y in ∫ln τ re lative to 3-Imag e metho d w ith di ffu se l igh t sou
rce Data for Samples of 30 ImagesDiffuse lamp source,
1-image analysis method Sky-scattered light 1-image analysis method
5 10 15 2 Plume velocity, U [km/h 0 r] 0 2 4 6 8 • msoot / w pl ume [mg /( s*m )] Experimentally Based Theoretical Field Sensitivity Limit τmin = 0.983 Undetectable Detectable
Figure 4 Measured uncertainties in
∫
lnτ for test plumes Figure 5 Detectable limits with sky-scattered light Beam steeringGradients in temperature and mixture composition in a plume can cause gradients in the index of refraction across the plume. Such refractive index gradients deflect the beam as it passes through the plume and have the potential to introduce a further uncertainty into the measurement. In the absence of detailed data on the composition of combustion products, the plume is assumed to be dry air. By doing this we underrate the refractive index of the plume. However, a previous study of beam steering in a flame showed that the major cause of beam steering is due to the
temperature gradient and is proportional to dT/T2 [5]. Therefore, beam steering reaches its
highest value when temperature is low and temperature gradient is high.
To quantify the beam steering uncertainty in plume transmissivity measurements, a MathCAD computer model developed by the NRC combustion group is used [8]. The model requires an input temperature field. Poudenx [9] measured and established mean temperature maps for 149 cross-sections of plumes of diffusion flames within a controlled wind tunnel. The study showed that in low crosswind conditions, the plume peak temperature is on the order of 357°C and plumes appear kidney shaped. At higher crosswinds the plume cross-sections were circular. As a first analysis, a 1 m diameter plume is simulated as having a Gaussian axi-symmetric
temperature distribution with centerline temperature of 357oC dropping to an ambient
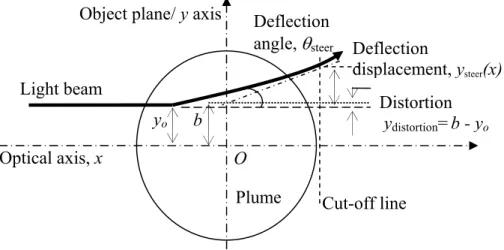
Optical axis, x b Distortion ydistortion=b - yo Deflection angle, θsteer
Object plane/ y axis
Light beam Plume Deflection displacement, ysteer(x) O Cut-off line yo
Figure 6 Schematic of beam steering through a circular plume
The beam steering phenomena is shown schematically in Fig. 6. A light beam starts at an offset
position of yo entering the plume. The beam is bent away from the optical axis as it passes
through the plume [8] with a final deflection angle, θsteer, as it leaves the plume. The difference
between the true beam path through the plume and the unsteered beam path (i.e. yo) is defined as
the deflection displacement, ysteer(x) and is important since it defines an uncertainty of the
measured path through the plume. Because of beam steering, there will also be a distortion in the image of the beam on the detector. This distortion can be quantified by projecting the final trajectory of the beam after it leaves the plume, back to the object plane at the centre of the
plume. The intersection location is denoted b and the difference between yo and b is the
distortion that would be observed in the plume image (once multiplied by the magnification of
the imaging optics). The distortion relative to the object is denoted ydistortion.
-1000 -800 -600 -400 -200 0 200 400 600
Positon along optical axis, x [mm]
0 0.04 0.08 0.12 0.16 D e fl e c ti on di sp la ce m e n t, ysteer [ m m ] y offsety o= 0.0 mm yo= 50 mm yo= 100 mm yo= 150 mm yo= 230 mm yo= 400 mm yo= 500 mm yo= 600 mm 0 200 400 600 800 1000
y offset of source beam, yo [mm]
-6 -4 -2 0 2 4 6 Im a ge d isto rt ion [ n m] (a) (b)
Figure 7 a) Beam steering ysteer(x) simulation, 1°m diameter plume, Gaussian temperature profile. b)
Corresponding image distortion
The simulation was applied to a region from -0.9 to 0.9 m in the x-direction for yo values ranging
0.5 m is chosen as the cut off limit in the figure since we are not interested in the uncertainty of
the measurement beam path (i.e. ysteer) beyond the plume. The light beams start steering
noticeably at -0.3 m within the plume. The maximum deflection displacement occurs for yo =
0.23 m and in this case ysteer(0.5m) is less than 0.16 mm and maximum deflection angle (θsteer) is
less than 0.3 mrad. The beam distortion (in nm) in the image is estimated and shown in Fig. 7b.
With increasing yo, beams are distorted towards the optical axis. After passing a certain value of
yo which depends on the temperature profile within the plume, the beams start being distorted
away from the optical axis. When yo moves outside of the plume, the beam distortion becomes
zero as the temperature gradient tends to zero. For the assumed conditions, the calculated maximum distortion of 5.258 nm and is clearly negligible.
Conclusion
The analysis on experimental results suggests that sky-scattered solar radiation can be effectively ht source for plume transmissivity measurement. The background interpolation
The authors thank Environment Canada (Project Manager Michael Layer) and the Canadian eum Producers (CAPP) for their financial support. The assistance of Reg
[1] Pope, C.A. ,III, et al. Journal of the American Medical Association, 287: 1123-1141 (2002) Dockery, D W., Muller, J.E., and Mittleman, M.A., Circulation, 103: 2810-2815 (2001)
Snelling, D.R., Combustion used as a lig
algorithm in the single-image routine with sky-scattered radiation as a light source contributes less than 4% uncertainty to mass flow rate of soot under normal plume conditions if plume size is less than 40% relative to the image width. With the current set-up, the maximum detectable plume transmissivity using sky scattered radiation is 0.983 for an accepted uncertainty of less than 40% (compared with measurements using an accepted 3-image, lab-based approach). For an assumed plume velocity of 5 km/hr and plume width of 1 m, the minimum mass flow rate of soot that can be detected is 1.9 mg/s. Results of beam steering simulations show that beam steering is not a significant concern. Uncertainty in the measured beam path and image distortion are both small relative to the size of the plume for an assumed 1 m diameter circular plume with Gaussian temperature profile peaking at 357°C. Future work will include improvements to the synthetic plume samples to avoid imaging artifacts (i.e. surface reflections) which would not be present in field plume measurements.
Acknowledgments
Association of Petrol
Smith and Bob Sawchuk in preparing the experiments is gratefully acknowledged.
References
[2] Peters, A.,
[3] Johnson, M.R. and Thomson K.A., Final report to Environment Canada, Mar. 2005. [4] Flower, W.L. & Bowman, C.T., Proc. Combust. Inst., 21:1115-1124 (1986).
8 (1999). [5] Snelling, D. R, Thomson, K. A., Smallwood, G. J., Gulder, O. L., Applied Optics, v3
[6] Koylu U.O., Faeth, G.M. Transactions of the ASME, 116: 152-159 (1994).
[7] Yang, C, Thomson, K. A., Johnson, M.R., CI/CS, Spring Technical Meeting (2005) [8] Thomson, K.A. Ph. D thesis (2004)
[9] Poudenx, P, M.A.Sc thesis (2000)
man, E.J., Fraser, R. A., Smallwood, G. J. and [10] Thomson, K. A., Gulder, O. L, Weck