Analytics for Improved Cancer Screening and
Treatment
by
John Silberholz
B.S. Mathematics and B.S. Computer Science, University of Maryland
(2010)
Submitted to the Sloan School of Management
in partial fulfillment of the requirements for the degree of
Doctor of Philosophy in Operations Research
at the
MASSACHUSETTS INSTITUTE OF TECHNOLOGY
September 2015
c
○ Massachusetts Institute of Technology 2015. All rights reserved.
Author . . . .
Sloan School of Management
August 10, 2015
Certified by . . . .
Dimitris Bertsimas
Boeing Leaders for Global Operations Professor
Co-Director, Operations Research Center
Thesis Supervisor
Accepted by . . . .
Patrick Jaillet
Dugald C. Jackson Professor
Department of Electrical Engineering and Computer Science
Co-Director, Operations Research Center
Analytics for Improved Cancer Screening and Treatment
by
John Silberholz
Submitted to the Sloan School of Management on August 10, 2015, in partial fulfillment of the
requirements for the degree of
Doctor of Philosophy in Operations Research
Abstract
Cancer is a leading cause of death both in the United States and worldwide. In this thesis we use machine learning and optimization to identify effective treatments for advanced cancers and to identify effective screening strategies for detecting early-stage disease.
In Part I, we propose a methodology for designing combination drug therapies for advanced cancer, evaluating our approach using advanced gastric cancer. First, we build a database of 414 clinical trials testing chemotherapy regimens for this cancer, extracting information about patient demographics, study characteristics, chemother-apy regimens tested, and outcomes. We use this database to build statistical models to predict trial efficacy and toxicity outcomes. We propose models that use machine learning and optimization to suggest regimens to be tested in Phase II and III clinical trials, evaluating our suggestions with both simulated outcomes and the outcomes of clinical trials testing similar regimens.
In Part II, we evaluate how well the methodology from Part I generalizes to advanced breast cancer. We build a database of 1,490 clinical trials testing drug therapies for breast cancer, train statistical models to predict trial efficacy and toxicity outcomes, and suggest combination drug therapies to be tested in Phase II and III studies. In this work we model differences in drug effects based on the receptor status of patients in a clinical trial, and we evaluate whether combining clinical trial databases of different cancers can improve clinical trial toxicity predictions.
In Part III, we propose a methodology for decision making when multiple mathe-matical models have been proposed for a phenomenon of interest, using our approach to identify effective population screening strategies for prostate cancer. We implement three published mathematical models of prostate cancer screening strategy outcomes, using optimization to identify strategies that all models find to be effective.
Thesis Supervisor: Dimitris Bertsimas
Title: Boeing Leaders for Global Operations Professor Co-Director, Operations Research Center
Acknowledgments
I would first like to gratefully acknowledge my advisor Dimitris Bertsimas for his role in the work presented in this dissertation and also for helping me mature as a researcher during my time at MIT. By adding me to his team studying the synthesis of clinical trial outcomes during the first month of my PhD, Dimitris introduced me to the research questions addressed in the first two chapters of my thesis and more broadly to the area of healthcare analytics, the focus of my entire dissertation. Dimitris’s unrelenting focus on research questions with real-world impact has helped cement in my mind the sorts of problems I should pursue as a researcher, something that will benefit me throughout my research career.
I would also like to acknowledge the guidance of Vivek Farias and Retsef Levi. By serving on both my general exam committee and my thesis committee, Vivek and Retsef provided thoughtful feedback about my research that had a significant impact on the material present in this dissertation.
I would like to acknowledge my collaborators on the work described in this thesis. It was a pleasure working with Stephen Relyea and Allison O’Hair on the study of gastric cancer clinical trials, which was awarded the 2013 Pierskalla Award from the INFORMS Health Applications Society. The study of breast cancer clinical trials would not have been possible without assistance in the literature review and data ex-traction from Allison O’Hair and from a number of undergraduate research assistants from both MIT and Wellesley — Emily Chen, Michael Chen, Shahrin Islam, Siva Nagarajan, David Sukhin, Pei Tao, Roza Trilesskaya, Victoria Wang, Mimi Williams, and Joanna Yeh. Finally, it has been a pleasure to collaborate with Brown Professor Tom Trikalinos on the prostate cancer screening work, and I would also like to thank MIT librarian Courtney Crummett for her assistance in the literature review for that thesis chapter.
Throughout my PhD I have enjoyed spending time with and learning from fellow ORC students. In particular I wanted to thank Nataly Youssef and Swati Gupta for the great times as my friends and study buddies; Iain Dunning and Swati Gupta
for an enjoyable and productive research collaboration on the MQLib project; and Allison O’Hair, Iain Dunning, Angie King, Velibor Mišić, and Nataly Youssef for a successful collaboration in developing the Analytics Edge MOOC.
Lastly, I wanted to thank my family for their support. My parents have always encouraged my interest in math and programming and my father introduced me to operations research in high school by connecting me with Bruce Golden, his advisor for his master’s degree. Thanks also to my in-laws for their kind words and support while I worked through my PhD. Finally, many thanks to my wife Sarah for all she has done to help me through the PhD, from serving as a sounding board for research ideas to providing feedback on manuscripts to celebrating successes to providing support through difficulties.
Contents
1 Introduction 19
1.1 Models to Design Drug Regimens for Advanced Cancer . . . 20
1.2 Optimizing Screening Strategies Using Multiple Mathematical Models 22 2 Designing Chemotherapy Regimens for Advanced Gastric Cancer 25 2.1 Introduction . . . 25
2.2 Clinical Trial Database . . . 31
2.2.1 Manual Data Collection . . . 33
2.2.2 An Overall Toxicity Score . . . 34
2.3 Statistical Models Predicting Clinical Trial Outcomes . . . 37
2.3.1 Data and Variables . . . 38
2.3.2 Statistical Models . . . 39
2.3.3 Statistical Model Results . . . 41
2.3.4 Identifying Unpromising Clinical Trials Before They Are Run 45 2.4 Design of Chemotherapy Regimens . . . 48
2.4.1 Phase II Regimen Optimization Model . . . 48
2.4.2 Phase III Regimen Selection Model . . . 52
2.4.3 Evaluation Techniques . . . 54
2.4.4 Optimization Results . . . 58
2.5 Discussion and Future Work . . . 62
3 Designing Drug Therapies for Advanced Breast Cancer 65 3.1 Introduction . . . 65
3.2 Breast Cancer Clinical Trial Database . . . 68
3.2.1 Manual Data Collection . . . 69
3.3 Statistical Models for Breast Cancer Outcomes . . . 73
3.3.1 Results . . . 75
3.3.2 Identifying Unpromising Trials . . . 77
3.4 Combined Databases for Toxicity Prediction . . . 79
3.4.1 Statistical Model Results . . . 81
3.5 Design of Chemotherapy Regimens . . . 82
3.6 Discussion . . . 88
4 Identifying Effective Screening Strategies for Prostate Cancer 91 4.1 Introduction . . . 91 4.2 Methods . . . 94 4.2.1 Model Parameters . . . 95 4.2.2 Quality of Life . . . 95 4.2.3 Screening Strategies . . . 96 4.3 Results . . . 97 4.3.1 Sensitivity Analysis . . . 100 4.4 Discussion . . . 102
A Data Preprocessing for Gastric Cancer Database 105 A.1 Performance Status . . . 105
A.2 Grade 4 Blood Toxicities . . . 106
A.3 Proportion of Patients with a DLT . . . 107
B Coefficients of Models Predicting Gastric Cancer Outcomes 111 C Pseudocode of Evaluation Techniques for Proposed Regimens 115 D Data Preprocessing for Breast Cancer Database 119 D.1 Imputation of Demographic Data . . . 119
E Drugs Appearing in Breast Cancer Clinical Trial Database 125
F Literature Review Details 129
G Ranges Used in Sensitivity Analysis 131
List of Figures
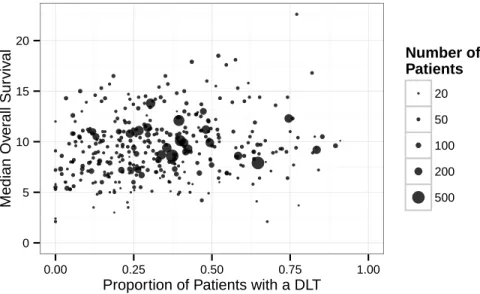
2-1 The results of the 372 clinical trial arms in our database with non-missing median OS and DLT proportion. The size of a point is pro-portional to the number of patients in that clinical trial arm. . . 37 2-2 Sequential out-of-sample prediction accuracy of survival models
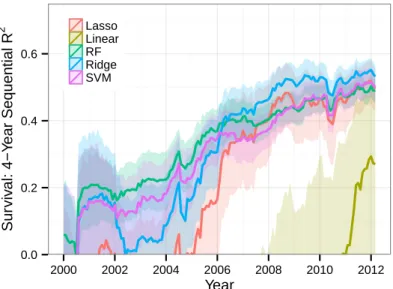
calcu-lated over 4-year sliding windows ending in the date shown, reported as the coefficient of determination (𝑅2). . . 42 2-3 Four-year sliding-window sequential out-of-sample classification
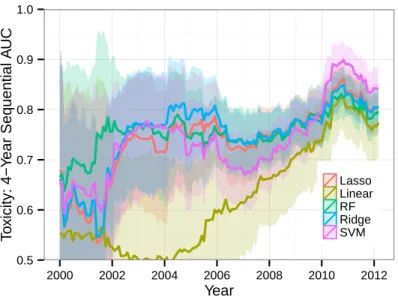
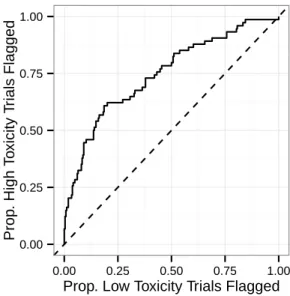
accu-racy of toxicity models, reported as the area under the curve (AUC) for predicting whether a trial will have high toxicity (DLT proportion > 0.5). 44 2-4 Performance of the ridge regression model for toxicity at flagging
high-toxicity trials among the 397 trials arms in the testing set. . . 46 2-5 Performance of the ridge regression model for median OS at flagging
trials that do not achieve top-quartile efficacy among the 397 trials arms in the testing set. . . 47 2-6 Median OS and DLT proportion for chemotherapy regimens that could
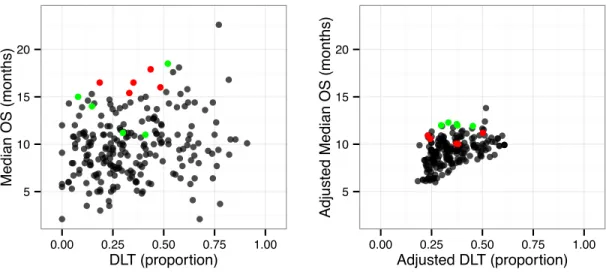
potentially be selected for a Phase III trial experimental arm by our models. The left figure plots outcomes of the Phase II study that tested each regimen, and the right figure plots predicted outcomes for the regimen in a typical Phase III clinical trial patient population. The red points show the top five trials according to the data reported in the Phase II trials, and the green points show the top five trials according to the prediction models. . . 54
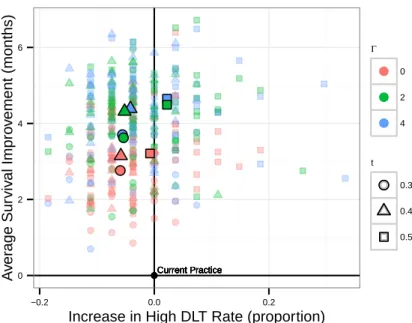
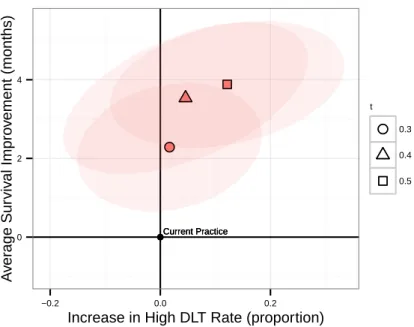
2-7 Comparison between Phase III experimental arm suggestions (n=27) from our models and from current practice according to the simulation metric. Each point represents a simulation of our approach and high-lighted points are averages across simulations. Points to the left of the y-axis improved over current practice in the proportion of trials with unacceptably high toxicity, and points above the x-axis improved over current practice in average median OS. . . 58 2-8 Comparison between Phase III experimental arm suggestions (𝑛 = 27)
from our models and from current practice according to the matching metric. . . 61 3-1 The results of the 887 clinical trial arms in our database with
non-missing median OS and DLT proportion. The size of a point is pro-portional to the number of patients in that clinical trial arm. . . 72 3-2 The number of times each drug was used in a breast cancer clinical
trial arm and in a gastric cancer clinical trial arm. . . 72 3-3 Four-year sliding-window 𝑅2value of the statistical models’ predictions
of median OS. . . 75 3-4 Four-year sliding-window AUC of the statistical models’ predictions of
the proportion of patients experiencing a DLT, labeling trials as having unacceptably high toxicity if more than 50% of patients experience a DLT. . . 76 3-5 Performance of the statistical model for toxicity at flagging high-toxicity
arms among the 1,678 arms in the testing set. . . 78 3-6 Performance of the statistical model for efficacy at flagging trial arms
that fail to reach the top quartile of efficacy among the 1,678 arms in the testing set. . . 78 3-7 Receiver operating characteristic curve for out-of-sample toxicity
pre-dictions of the 331 gastric cancer clinical trial arms published since 1998 with extractable toxicity data. . . 80
3-8 Receiver operating characteristic curve for out-of-sample toxicity pre-dictions of the 883 breast cancer clinical trial arms published since 1998 with extractable toxicity data. . . 81 3-9 Receiver operating characteristic curve for out-of-sample toxicity
pre-dictions of the 35 gastric cancer clinical trial arms and 22 breast cancer clinical trial arms published since 1998 for which a drug in the study had been tested in no more than two prior clinical trial arms for that cancer and had been tested in the other cancer. . . 82 3-10 Comparison between Phase III experimental arm suggestions (𝑛 = 193)
from our models and from current practice according to the simulation metric. . . 86 3-11 Comparison between Phase III experimental arm suggestions (𝑛 = 193)
from our models and from current practice according to the matching metric. . . 88 4-1 Average and most pessimistic assessments of identified and
expert-generated screening strategies. . . 98 4-2 The 64 screening strategies on the efficient frontier trading off average
and most pessimistic QALE assessment, with the strategy optimizing the pessimistic assessment highlighted in red. . . 99 4-3 Average and most pessimistic assessments of identified and
expert-generated screening strategies, using the most pessimistic QALE decre-ments from [88]. . . 100 4-4 The 112 screening strategies on the efficient frontier trading off average
and most pessimistic QALE assessment, using the most pessimistic QALE decrements from [88]. The strategy optimizing the pessimistic assessment is highlighted in red. . . 101
C-1 Pseudocode of the simulation metric procedure. . . 116 C-2 Pseudocode of the matching metric procedure. . . 117
List of Tables
2.1 A summary of the models developed and evaluated in this chapter. . 28 2.2 Definitions of some common chemotherapy clinical trial terms. . . 31 2.3 Patient demographic, study characteristic, and outcome variables
ex-tracted from gastric cancer clinical trials. These variables, together with the drug variables, were inputted into a database. . . 35 2.4 Root mean square prediction error (RMSE) and 𝑅2 for the
cross-validation set (“X-Val”), for out-of-sample predictions (“OOS”), and for bootstrapped out-of-sample predictions (“Bootstrap”) for survival pre-dictions in the most recent 4-year window of data (March 2008–March 2012), which includes 132 out-of-sample predictions. . . 43 2.5 AUC for the cross-validation set (“X-Val”), for out-of-sample
predic-tions (“OOS”), and for bootstrapped out-of-sample predicpredic-tions (“Boot-strap”) for toxicity predictions in the most recent 4-year window of data (March 2008–March 2012), which includes 119 out-of-sample pre-dictions. Of these, 24 (20.1%) actually had high toxicity. . . 44 2.6 Comparison between Phase III experimental arm suggestions (n=27)
from our models and from current practice according to the simula-tion metric, reporting for each optimizasimula-tion model with parameters Γ and 𝑡 the change in average median OS and proportion of trials with unacceptably high DLT compared to current practice. . . 59
2.7 Comparison between Phase III experimental arm suggestions (𝑛 = 27) from our models and from current practice according to the matching metric, reporting for each optimization model with parameter 𝑡 the proportion of model suggestions that match all drugs and all drug classes of the matched future trial as well as the average change in median OS and proportion of trials with an unacceptably high DLT rate compared to current practice. . . 60
3.1 Average value, range, and reporting rate of patient demographic, study characteristic, and outcome variables extracted from breast cancer clin-ical trials. . . 71 3.2 Comparison between Phase III experimental arm suggestions (n=193)
from our models and from current practice according to the simula-tion metric, reporting for each optimizasimula-tion model with parameters Γ and 𝑡 the change in average median OS and proportion of trials with unacceptably high DLT compared to current practice. . . 87 3.3 Comparison between Phase III experimental arm suggestions (𝑛 = 193)
from our models and from current practice according to the matching metric, reporting for each optimization model with parameter 𝑡 the pro-portion of model suggestions that match all drugs and all drug classes of the matched future trial, as well as the average change in median OS and proportion of trials with unacceptably high DLT compared to current practice. . . 87
A.1 Correlation of estimates of total Grade 3/4 toxicity to the true value. 109
B.1 Coefficients of drug dosage variables in the ridge regression models predicting efficacy and toxicity outcomes. . . 113 B.2 Coefficients of the non-drug variables in the ridge regression models
E.1 All drugs tested in at least one clinical trial arm in the breast cancer clinical trial database. . . 128
Chapter 1
Introduction
Cancer is a leading cause of death worldwide, causing 8.2 million deaths worldwide in 2012, and 14.1 million new cases of cancer were diagnosed that year [165]. This leads to a large global economic burden: The total cost in the first year after diagnosis of all new cancer cases in 2010 was an estimated $290 billion, and that number will increase to an estimated $458 billion for new cancer cases diagnosed in 2030 [30].
Given the enormous global health impact and cost of cancer, it is unsurprising that screening and treatment for cancer have received significant attention in opera-tions research (OR) and related communities. OR researchers have studied optimal population cancer screening strategies for decades, modeling strategies for a wide variety of cancers including breast cancer [19, 20, 81, 107, 123, 144, 154], cervical cancer [120, 125], and colorectal cancer [47, 85, 117]. Research into cancer treatment has considered many angles, including decision making in pharmaceutical research and development [73, 145, 160], clinical trial design [7, 27, 28], radiation therapy planning [32, 42, 146, 158, 159], optimizing chemotherapy dosing schedules [5], se-quential decision making in cancer treatment [105, 151], and individualized mortality prediction [116, 149, 180].
This dissertation breaks new ground by applying OR techniques to cancer screen-ing and treatment in two new ways. First, we develop a framework for learnscreen-ing from large databases of clinical trials that test drug therapies for cancer, providing pa-tients and oncologists with information about the therapies that have been tested to
date, developing statistical models that could be used by clinical trial planners to prioritize which therapies are tested in new trials, and using optimization to design novel combination drug regimens. Additionally, we develop an approach for iden-tifying population screening strategies for cancer that perform well when evaluated by mathematical models of screening effectiveness that have structural differences; this robustness to model structure could improve decision makers’ confidence in the quality of the identified strategies.
1.1
Models to Design Drug Regimens for Advanced
Cancer
Advanced cancer occurs when the disease has spread within a patient’s body; for most forms of cancer, patients’ long-term prognosis is poor when they reach this disease stage and treatment focuses on extending life and improving quality of life. Combi-nation drug therapy, in which patients are treated with multiple drugs, is a popular treatment option for advanced cancers, as evidence from randomized controlled trials suggests that these therapies extend patient survival compared to single-agent drug therapies [40, 56, 67, 172]. Given the large number of drugs available to treat each advanced cancer and the many dosing schedules that could be used for each drug, there is an enormous number of feasible combination drug regimens for each advanced cancer.
Oncology researchers use clinical trials to evaluate the effectiveness of new thera-pies — a Phase I study evaluates the safety of a proposed therapy, a Phase II study further evaluates safety and also evaluates efficacy, and a Phase III clinical trial performs a large, randomized comparison of a therapy against a standard regimen. Clinical trials are expensive, costing on average more than $10 million for Phase II studies and $20 million for Phase III trials [153]; these costs are typically incurred either by a pharmaceutical company or the government.
com-bination drug therapies that could be tested, researchers use a number of techniques to identify promising drug regimens. Clinical trials often cite in vitro or animal ex-perimentation as motivations for testing a new drug regimen, and other tools such as molecular simulation [45] and virtual clinical trials [108] are also available to help de-sign new regimens. Researchers further rely on previously published randomized con-trolled trials in a systematic way through meta-analyses, which test a hypothesis by combining the results of all published randomized trials that evaluate that hypothesis. While meta-analyses can provide broad guidance in clinical trial design, for instance showing that combination chemotherapy regimens for advanced gastric cancer yield longer survival than single-agent regimens [172] or that anthracycline-containing com-bination chemotherapy regimens for advanced breast cancer yield longer survival than non-anthracycline-containing combination chemotherapy regimens [67], they cannot be used to predict the efficacy of a specific untested drug regimen and do not incor-porate evidence from any non-randomized clinical studies. Researchers also rely on evidence from the literature collected in a non-systematic way, often referencing a successful Phase II study as motivation for testing a particular regimen.
In this dissertation, we present a framework for constructing and learning from large databases of clinical trials that test combination drug therapies. Like meta-analysis, our approach relies on previously published clinical trials in a systematic way. Unlike meta-analysis, our approach incorporates information from non-randomized studies, can be used to predict efficacy and toxicity outcomes for proposed therapies, and can be used to design totally new combination drug regimens. The framework includes the following steps:
∙ Clinical trial database: We first perform a literature review to identify all Phase II and III clinical trials that test drug regimens for the cancer of interest, extracting information about the patients in the study, the study itself, the drugs being tested, and efficacy and toxicity outcomes of interest. This database could be used by cancer patients and their doctors to observe the outcomes of the full set of drug therapies that have been tested to date for a particular cancer.
∙ Statistical models for efficacy and toxicity outcomes: We train statistical models using the results of previously published clinical trials and use these models to predict survival and toxicity outcomes of new clinical trials, evaluating regimens whose drugs have individually been tested before, but potentially in different combinations or dosages. These models could be used by clinical trial planners to prioritize a portfolio of proposed clinical trials, focusing on the ones most likely to exhibit high efficacy and acceptable toxicity.
∙ Optimization models to design new combination drug therapies: We propose and evaluate tools for suggesting novel drug therapies to be tested in Phase II studies and for selecting previously tested regimens to be further eval-uated in Phase III clinical trials. Our methodology balances the dual objectives of exploring novel drug therapies and testing treatments predicted to be highly effective, and it could be used by clinical trial planners to identify promising therapies for testing.
In Chapter 2, we present this framework in detail, demonstrating that it is feasible by building a clinical trial database, statistical models, and optimization models for advanced gastric cancer drug therapies. In Chapter 3, we test the degree to which the framework generalizes to advanced breast cancer, again performing all three steps of the framework for that disease. We further investigate whether data from multiple cancers can be combined to improve the quality of toxicity predictions.
1.2
Optimizing Screening Strategies Using Multiple
Mathematical Models
Early detection of cancer via screening has the potential to improve long-term progno-sis, and the U.S. Preventative Services Task Force (USPSTF) recommends population screening for breast cancer [169], cervical cancer [128], and colorectal cancer [168], additionally encouraging screening in high-risk populations for lung cancer [130].
Many population screening strategies are possible for a given cancer, which vary based on the age to start and stop screening, the interval between consecutive screen-ing tests, and the age-specific modality or intensity of screenscreen-ing. Given the infeasi-bility of comparing a large number of strategies with a randomized controlled trial (RCT) coupled with the large enrollment and long follow-up needed for a screening RCT, mathematical modeling is a popular tool for evaluating competing screening strategies. Many models of cancer screening and treatment have been published in the OR and medical literatures.
There is considerable uncertainty in mathematical models for cancer screening regarding the natural history of cancer in the human body, the ability of screening tests to detect cancer, and the impact of subsequent treatment of screen-detected cancers. Uncertainty about parameters in mathematical models, such as the age-specific cancer incidence rate or the rate at which untreated cancer advances in stage, has received considerable attention in the modeling literature. Sensitivity analysis and probabilistic sensitivity analysis [59] can be used to determine the uncertainty in model outcomes based on parameter uncertainty, while methodologies such as stochastic optimization [29], robust optimization [24], and robust control [184] can be used to make decisions that perform well across a range of possible parameter values. In this dissertation, we instead focus on the structural uncertainty of models, which captures uncertainty due to the simplifications and assumptions made as part of the modeling process [31]. Examples of structural uncertainty include the prob-ability distribution selected to model the dwelling time before a cancer advances in stage or whether a stage-shift or cure model is used to capture screening ben-efit [174]. Traditionally, structural uncertainty is quantified using a comparative modeling approach, in which multiple models with different structures are used to evaluate proposed health interventions. If models with different structures yield the same or similar conclusions about the effectiveness of a health intervention, this could increase the confidence of a decision maker in the accuracy of those conclusions. Com-parative modeling approaches have been used to identify effective screening strategies for many cancers including colorectal cancer [178], breast cancer [124], and lung
can-cer [53]. The results of the models in a comparative modeling study can be combined through model averaging, in which the average or weighted average of model out-comes is used to assess a health intervention [31], though in practice results are often presented separately for each model, with differences discussed in the text of the study [53, 124, 178].
In this dissertation, we present a framework for identifying health interventions that perform well across all models in a comparative modeling study, using mathe-matical optimization to identify effective interventions from a large set of competing strategies. We extend previous work by considering not only the average of models’ assessments of strategies but also the most pessimistic assessment, giving decision makers tunable control over the degree of conservatism to take when identifying ef-fective interventions.
In Chapter 4, we present this framework in detail and use it to identify prostate cancer screening strategies that perform well across three structurally different mod-els of screening for that disease. We show that strategies found to be effective by one mathematical model in a comparative modeling setting may not be found effective by all models, highlighting the importance of considering all models when evaluating screening strategies. We further show that our approach can mitigate some weak-nesses of unweighted model averaging, which can favor overly aggressive screening strategies. Finally, we discuss how our framework could be applied in a broad array of comparative modeling settings, including evaluating strategies to screen for other cancers, to screen for other diseases, to prevent infectious diseases, and to control chronic diseases.
Chapter 2
Designing Chemotherapy Regimens
for Advanced Gastric Cancer
2.1
Introduction
Cancer is a leading cause of death worldwide, accounting for 8.2 million deaths in 2012. This number is projected to increase, with an estimated 13.1 million deaths in 2030 [177]. The prognosis for many solid-tumor cancers is grim unless they are caught at an early stage, when the tumor is contained and can still be surgically removed. At the time of diagnosis, the tumor is often sufficiently advanced that it has metastasized to other organs and can no longer be surgically removed, leaving drug therapy or best supportive care as the best treatment options.
A key goal of oncology research for advanced cancer is to identify novel chemother-apy regimens that yield better clinical outcomes than currently available treat-ments [139, 148]. Phase II clinical trials are used to evaluate the efficacy of novel regimens, with a focus on exploring treatments that have never been previously tested for a disease — in this chapter we found that 89.4% of Phase II trials for advanced gastric cancer test a new chemotherapy regimen. While some trials evaluate a new drug for a particular cancer, the majority (84.6% for gastric cancer) instead test novel combinations of existing drugs in different dosages and schedules; in this chapter we focus primarily on this type of chemotherapy regimen. The most effective regimens
identified in Phase II trials are then evaluated in Phase III studies, which are large randomized controlled trials comparing one or more experimental regimens against a control group treated with the best available standard chemotherapy regimen [70]. Treatments that perform well against standard treatments in Phase III trials may then be considered new standard regimens for advanced cancer; identifying such reg-imens and thereby improving the set of treatments available to patients is a key goal of oncology research for advanced cancer [139, 148].
Finding novel, effective chemotherapy treatments for advanced cancer is challeng-ing in part because the most effective chemotherapy regimens often contain more than one drug. Meta-analyses for a number of cancers have demonstrated efficacy gains of combination chemotherapy regimens over single-agent treatments [56, 172], and in this chapter we found that 80% of all chemotherapy clinical trials for advanced gastric cancer have tested multi-drug treatments. As a result of the large number of different chemotherapy drugs, there are a huge number of potential drug combinations that could be investigated in a new Phase II trial, especially when considering different dosages and dosing schedules for each drug. However, testing any chemotherapy reg-imen in a clinical trial is expensive, costing on average more than $10 million for Phase II studies and $20 million for Phase III trials [153]; these costs are often in-curred either by pharmaceutical companies or by the government. Furthermore, even after a Phase II study has been run testing a new regimen, it can be difficult to determine whether this regimen is a good candidate for testing in a larger Phase III study because Phase II trials often enroll patient populations that are not represen-tative of typical advanced cancer patients [70]. For these reasons, it is a challenge for researchers to identify effective new combination chemotherapy regimens.
Our aspiration in this chapter is to propose an approach that could serve as a method for selecting the chemotherapy regimens to be tested in Phase II and III clinical trials. Because Phase III clinical trials are used to test the most promising chemotherapy regimens to date and can directly affect standard clinical practice, our central objective in this chapter is to design tools that can improve the quality of the chemotherapy regimens tested in Phase III trials compared to current practice. The
key contributions of the chapter are:
Clinical Trial Database We developed a database containing information about the patient demographics, study characteristics, chemotherapy regimens tested, and outcomes of all Phase II and III clinical trials for advanced gastric cancer from papers published in the period 1979–2012 (Section 2.2). Surprisingly, and to the best of our knowledge, such a database did not exist prior to this study. Statistical Models Predicting Clinical Trial Outcomes We train statistical models using the results of previous randomized and non-randomized clinical trials (Section 2.3). We use these models to predict survival and toxicity out-comes of new clinical trials evaluating regimens whose drugs have individually been tested before, but potentially in different combinations or dosages. To our knowledge, no previous papers have employed statistical models for the predic-tion of clinical trial outcomes of arbitrary drug combinapredic-tions and performed an out-of-sample evaluation of the predictions.
Design of Chemotherapy Regimens We propose and evaluate tools for suggest-ing novel chemotherapy regimens to be tested in Phase II studies and for select-ing previously tested regimens to be further evaluated in Phase III clinical trials (Section 2.4). Our methodology balances the dual objectives of exploring novel chemotherapy regimens and testing treatments predicted to be highly effective. To our knowledge, this is the first use of statistical models and optimization to design novel chemotherapy regimens based on the results of previous clinical trials.
We summarize the models developed and evaluated in this chapter in Table 2.1. In Section 2.4.4 we approximate the quality of our suggested chemotherapy regimens using both simulated clinical trial outcomes and the true outcomes of similar clinical trials in our database. In Section 2.5, we discuss the next step in evaluating our models: using clinical trials to evaluate the quality of the chemotherapy regimens we suggest.
Model Approach Evaluation Techniques Prediction of clinical
trial efficacy and toxicity outcomes
Statistical models trained on a large database of previous clinical trials (Section 2.3.2)
Sequential out-of-sample 𝑅2, root mean square error, and area under the curve
(Section 2.3.3), as well as evaluation of whether models could aid planners in avoiding unpromising trials (Section 2.3.4) Design of novel chemotherapy regimens for evaluation in Phase II studies
Integer optimization using our statistical models to select novel chemotherapy regimens with high predicted efficacy and acceptable predicted toxicity (Section 2.4.1)
The simulation and matching metrics, which use both simulation and the outcomes of true clinical trials to compare our suggested chemotherapy regimens against those selected in current clinical practice (Section 2.4.4)
Selection of previously tested chemotherapy regimens for further evaluation in Phase III clinical trials
Using our statistical models to identify previously tested regimens with high predicted efficacy and acceptable predicted toxicity (Section 2.4.2)
Table 2.1: A summary of the models developed and evaluated in this chapter.
The approach we propose in this chapter is related to both patient-level clinical prediction rules and meta-regressions, though it differs in several important ways. Medical practitioners and researchers in the fields of data mining and machine learn-ing have a rich history of predictlearn-ing clinical outcomes. For instance, techniques for prediction of patient survival range from simple approaches like logistic regression to more sophisticated ones such as artificial neural networks and decision trees [137]. Most commonly, these prediction models are trained on individual patient records and used to predict the clinical outcome of an unseen patient, often yielding impressive out-of-sample predictions [37, 57, 95, 101, 116]. Areas of particular promise involve incorporating biomarker and genetic information into individualized chemotherapy outcome predictions [63, 141]. Individualized predictions represent a useful tool to pa-tients choosing between multiple treatment options [171, 182, 183], and when trained on clinical trial outcomes for a particular treatment can be used to identify promising
patient populations to test that treatment on [181] or to identify if that treatment is promising for a Phase III clinical trial [54]. However, such models do not enable predictions of outcomes for patients treated with previously unseen chemotherapy regimens, limiting their usefulness in designing novel chemotherapy regimens.
The technique of meta-regression involves building models using the effect size of randomized trials as the dependent variable and using independent variables such as patient demographics and information about the chemotherapy regimen in a particu-lar trial. These models are used to complement meta-analyses, explaining statistical heterogeneity between the effect sizes computed from randomized clinical trials [162]. Though in structure meta-regressions are similar to the prediction models we build, representing trial outcomes as a function of trial properties, they are used to ex-plain differences between existing randomized trials, and study authors generally do not evaluate the out-of-sample predictiveness of the models. Like meta-analyses, meta-regressions are performed on a small subset of the clinical trials for a given disease, often containing just a few drug combinations. Even when a wide range of drug combinations are considered, meta-regressions typically do not contain enough drug-related variables to be useful in proposing new trials. For instance, [94] uses only three variables to describe the drug combination in the clinical trial; new combination chemotherapy trials could not be proposed using the results of this meta-regression. Finally, meta-analyses and meta-regressions are typically performed on a subset of published randomized controlled studies, while our approach uses data from both randomized and non-randomized studies.
Because approaches such as patient-level clinical prediction rules, meta-analysis, and meta-regression cannot be readily used to design new chemotherapy regimens to be tested in clinical trials, other methods, collectively termed preclinical models, are instead used in the treatment design process. Following commonly accepted principles for designing combination chemotherapy regimens [140], researchers seek to combine drugs that are effective as single agents and that show synergistic behavior when combined; drugs that cause the same toxic effects and that have the same patterns of resistance are not combined in suggested regimens. Molecular simulation is a
well developed methodology for identifying synergism in drug combinations [45], and virtual clinical trials, which rely on pharmacodynamic and pharmacokinetic models to analyze different drug combinations, can also be used to suggest new treatments [108]. Animal studies and in vitro experimentation can be used to further evaluate novel chemotherapy regimens; results of these preclinical studies are often cited as motivations for Phase II studies of combination chemotherapy regimens [43, 100, 115]. A key limitation of current preclinical models is that most do not incorporate treatment outcomes from actual patients, while the new models we propose in this chapter leverage patient outcomes reported in previous clinical trials.
We believe the data-driven approaches we propose in this chapter would com-plement existing preclinical models. For instance, an in vitro experiment could be performed to evaluate the anti-tumor activity of a combination chemotherapy regi-men suggested by our model from Section 2.4.1. Such experiregi-mentation could be used to evaluate and refine chemotherapy regimens suggested by our models, which would be especially important when our model suggests a regimen that combines drugs that have never been tested together in a prior clinical trial. Because our models cannot accurately predict outcomes of clinical trials testing new drugs, existing preclinical models would need to be used to design therapies incorporating these new drugs. On the other hand, our statistical models could be used to predict the efficacy and tox-icity of chemotherapy regimens designed using other preclinical models, identifying the most and least promising suggested regimens.
In this chapter, we evaluate our proposed approach on gastric cancer. Not only is this cancer important — gastric cancer is the third leading cause of cancer death in the world [165] — but there is no single chemotherapy regimen widely considered to be the standard or best treatment for this cancer [135, 172, 176], and researchers frequently perform clinical trials testing new chemotherapy regimens for this cancer. We believe, however, that our approach has potential to help in selecting regimens to test in trials for many other diseases; we discuss the application of the approach to advanced breast cancer in Chapter 3 and additional potential applications in Section 2.5.
Term Definition
Arm A group or subgroup of patients in a trial that receives a specific treatment.
Controlled trial A type of trial in which an experimental treatment is compared to a standard treatment.
Cycle The length of time between repeats of a dosing schedule in a chemotherapy treatment.
Exclusion criteria The factors that make a person ineligible from participating in a clinical trial.
Inclusion criteria The factors that allow a person to participate in a clinical trial.
Phase I Study A clinical study focused on identifying safe dosages for an experimental treatment.
Phase I/II Study A study that combines a Phase I and Phase II investigation.
Phase II Study A clinical study that explores the efficacy and toxicity of an experimental treatment.
Phase III Trial A randomized controlled trial that compares an experimental treatment with an established therapy. Randomized trial A type of trial in which patients are randomly assigned
to one of several arms.
Sequential treatment A treatment regimen in which patients transition from one treatment to another after a pre-specified number of treatment cycles.
Table 2.2: Definitions of some common chemotherapy clinical trial terms.
2.2
Clinical Trial Database
In this section, we describe the inclusion/exclusion rules we used and the data we collected to build our database. Definitions of some of the common clinical trial terms we use are given in Table 2.2.
In this study, we seek to include a wide range of clinical trials, subject to the following inclusion criteria: (1) Phase I/II, Phase II or Phase III clinical trials for ad-vanced or metastatic gastric cancer,1 (2) trials published no later than March 2012,
the study cutoff date, (3) trials published in the English language. Notably, these 1Clinical trials for gastric cancer often contain patients with cancer of the gastroesophageal
junction or the esophagus due to the similarities between these three types of cancer. We include studies as long as all patients have one of these three forms of cancer.
criteria include non-randomized clinical trials, unlike meta-analyses, which only in-clude randomized studies. While including non-randomized trials provides us with a significantly larger set of clinical trial outcomes and the ability to generate predictions for a broader range of chemotherapy drug combinations, this comes at the price of needing to control for differences in demographics and other factors between different clinical trials.
Exclusion criteria were: (1) trials testing sequential treatments, (2) trials that in-volve the application of radiotherapy,2 (3) trials that apply chemotherapy for earlier
stages of cancer, when the disease can still be cured, and (4) trials to treat gastroin-testinal stromal tumors, a related form of cancer.
To locate candidate papers for our database, we performed searches on PubMed, the Cochrane Central Register of Controlled Trials, and the Cochrane Database of Systematic Reviews. In the Cochrane systems, we searched for either MeSH term “Stomach Neoplasms” or MeSH term “Esophageal Neoplasms” with the qualifier “Drug Therapy.” In PubMed, we searched for a combination of the following keywords in the title: “gastr*” or “stomach”; “advanced” or “metastatic”; and “phase” or “randomized trial” or “randomised trial”. A single individual reviewed these search results, and these searches yielded 350 clinical trials that met the inclusion criteria for this study. After this search through medical databases, we further expanded our set of papers by searching through the references of papers that met our inclusion criteria. This reference search yielded 64 additional papers that met the inclusion criteria for this study. In total, our literature review yielded 414 clinical trials testing 495 treatment arms that we deemed appropriate for our approach. Since there are often multiple papers published regarding the same clinical trial, we verified that each clinical trial included was unique.
2Radiotherapy is not recommended for metastatic gastric cancer patients [135], and through
PubMed and Cochrane searches for stomach neoplasms and radiotherapy, we only found three clinical trials using radiotherapy for metastatic gastric cancer.
2.2.1
Manual Data Collection
A single individual manually extracted data from clinical trial papers and entered extracted data values into a database. Values not reported in the clinical trial report were marked as such in the database. We extracted clinical trial outcome measures of interest that capture the efficacy and toxicity of each treatment. Several measures of treatment efficacy (e.g. tumor response rate, median time until tumor progression, median survival time) are commonly reported in clinical trials. A review of the primary objectives of the Phase III trials in our database indicated that for the majority of these trials (60%), the primary objective was to demonstrate improvement in the median overall survival (OS) — the length of time from enrollment in the study until death — of patients in the treatment group. As a result, this is the metric we have chosen as our measure of efficacy.3 To capture the toxic effects of treatment,
we also extracted the fraction of patients experiencing any toxicity at Grade 3 or 4, designating severe, life-threatening, or disabling toxicities [133].
For each drug in a given trial’s chemotherapy treatment, the drug name, dosage level for each application, number of applications per cycle, and cycle length were collected. We also extracted many covariates that have been previously investigated for their effects on response rate or overall survival in prior chemotherapy clinical trials for advanced gastric cancer. To limit the number of missing values in our database, we limited ourselves to variables that are widely reported in clinical trials. These variables are summarized in Table 2.3.
We chose not to collect many less commonly reported covariates that have also been investigated for their effects on response and survival in other studies, including cancer extent, histology, a patient’s history of prior adjuvant therapy and surgery, and further details of patients’ initial conditions, such as their baseline bilirubin levels or body surface areas [11, 21, 103, 111]. However, the variables we do collect enable us 3The full survival distribution of all patients, which enables the computation of metrics such
as 6-month and 1-year survival rates, was available for only 348/495 (70.3%) of treatment arms. Meanwhile, the median OS was available for 463/495 (93.5%) of treatment arms. Given the broader reporting of median OS coupled with the established use of median OS as a primary endpoint in Phase III trials, we have chosen this metric as our central efficacy measure.
to control for potential sources of endogeneity, in which patient and physician deci-sion rules in selecting treatments might limit the generalizability of model results. For example, we collect performance status, a factor used by physicians in selecting treat-ments [135]. Although other factors, such as comorbidities and patient preferences for toxicities, are important in treatment decisions for the general population [135], clinical trials uniformly exclude patients with severe comorbidities, and toxicity pref-erences do not affect actual survival or toxicity outcomes. The only other treatment decision we do not account for in our models is that patients with HER2-positive cancers should be treated with the drug trastuzumab [135], while this treatment is ineffective in other patients. We address this issue by excluding trastuzumab from the combination chemotherapy regimen suggestions we make in Section 2.4.
In Table 2.3, we record the patient demographics we collected as well as trial outcomes. We note that the set of toxicities reported varies across trials, and that the database contains a total of 9,592 toxicity entries, averaging 19.4 reported toxicities per trial arm.
2.2.2
An Overall Toxicity Score
As described in Section 2.2.1, we extracted the proportion of patients in a trial who experience each individual toxicity at Grade 3 or 4. In this section, we present a methodology for combining these individual toxicity proportions into a clinically relevant score that captures the overall toxicity of a treatment. The motivation for an overall toxicity score is that there are 370 different possible averse events from cancer treatments [133]. Instead of building a model for each of these toxicities, some of which are significantly more severe than others, we use an overall toxicity score.
To gain insight into the rules that clinical decision makers apply in deciding whether a treatment has an acceptable level of toxicity, we refer to guidelines es-tablished in Phase I clinical trials. The primary goal of these early studies is to assess drugs for safety and tolerability on small populations and to determine an acceptable dosage level to use in later trials [74]. These trials enroll patients at increasing dosage levels until the toxicity becomes unacceptable. The “Patients and Methods” sections
Variable Avg. Value Range % Rep. Fraction male 0.72 0.29 – 1.00 97.8 Fraction of patients with prior
palliative chemotherapy
0.14 0.00 – 1.00 98.2 Median age (years) 59.60 46 – 80 99.0 Mean performance status1 0.88 0.11 – 3.00 84.2
Fraction of patients with primary tumor in the stomach
0.89 0.00 – 1.00 94.9
P
atien
t
Demographics
Fraction of patients with primary tumor in the gastroesophageal junction
0.08 0.00 – 1.00 94.3
Fraction of study authors from each country (11 different variables for countries in at least 10 trial arms)2
Country Dependent
0.00 – 1.00 95.8
Fraction of study authors from an Asian country2 0.42 0.00 – 1.00 95.8 Number of patients 53.9 11 – 521 100.0 Study Characteristics Publication year 2003 1979 – 2012 100.0 Median overall survival (months) 9.2 1.8 – 22.6 93.5 Incidence of every Grade 3/4 or
Grade 4 toxicity
Toxicity Dependent3
Outcomes
1 The mean Eastern Cooperative Oncology Group (ECOG) performance status of patients in a
clinical trial, on a scale from 0 (fully active) to 5 (dead). See Appendix A.1 for details.
2The studies that did not report this variable instead reported affiliated institutions without linking
authors to institutions. The proportion of authors from an Asian country serves as a proxy to identify study populations with patients of Asian descent, who are known to have different treatment outcomes than other populations.
3 See Appendix A.2 for details on data preprocessing for blood toxicities.
Table 2.3: Patient demographic, study characteristic, and outcome variables extracted from gastric cancer clinical trials. These variables, together with the drug variables, were inputted into a database.
of Phase I trials specify a set of so-called dose-limiting toxicities (DLTs). If a patient experiences any one of the toxicities in this set at the specified grade, he or she is said to have experienced a DLT. When the proportion of patients with a DLT exceeds a
pre-determined threshold, the toxicity is considered “too high,” and a lower dose is indicated for future trials. From these Phase I trials, we can learn the toxicities and grades that clinical trial designers consider the most clinically relevant and design a composite toxicity score to represent the fraction of patients with at least one DLT during treatment.
Based on a review of the 20 clinical trials meeting our inclusion criteria that also presented a Phase I study (so-called combined Phase I/II trials), we identified the following set of DLTs to include in the calculation of our composite toxicity score:
∙ Any Grade 3 or Grade 4 non-blood toxicity, excluding alopecia, nau-sea, and vomiting. 18 of 20 trials stated that all Grade 3/4 non-blood toxicities are DLTs, except some specified toxicities. Alopecia was excluded in all 18 trials and nausea/vomiting were excluded in 12 (67%). The next most frequently excluded toxicity was anorexia, which was excluded in 5 trials (28%).
∙ Any Grade 4 blood toxicity. Of the 20 trials reviewed, 17 (85%) defined Grade 4 neutropenia as a DLT, 16 (80%) defined Grade 4 thrombocytopenia as a DLT, 7 (35%) defined Grade 4 leukopenia as a DLT, and 4 (20%) defined Grade 4 anemia as a DLT. Only one trial defined Grade 3 blood toxicities as DLTs, so we chose to exclude this level of blood toxicity from our definition of DLT.
The threshold for the proportion of patients with a DLT that constitutes an unaccept-able level of toxicity ranges from 33% to 67% over the set of Phase I trials considered, indicating the degree of variability among decision makers regarding where the thresh-old should be set for deciding when a trial is “too toxic.” In this chapter we use the median value of 0.5 to identify trials with an unacceptably high proportion of pa-tients experiencing a DLT. Details on the computation of the proportion of papa-tients experiencing a DLT are presented in Appendix A.3. The 372 clinical trial arms in the dataset with non-missing median OS and DLT proportion are plotted in Figure 2-1. This figure shows that a typical clinical trial in our database has a median OS
be-0 5 10 15 20 0.00 0.25 0.50 0.75 1.00
Proportion of Patients with a DLT
Median Ov er all Sur viv al Number of Patients 20 50 100 200 500
Figure 2-1: The results of the 372 clinical trial arms in our database with non-missing median OS and DLT proportion. The size of a point is proportional to the number of patients in that clinical trial arm.
tween 5 months and 15 months, and a proportion of patients with a DLT between 0 and 0.75.
2.3
Statistical Models Predicting Clinical Trial
Out-comes
This section describes the development and testing of statistical models that predict the outcomes of clinical trials. These models are capable of taking a proposed clin-ical trial involving chemotherapy drugs that have been seen previously in different combinations and generating predictions of patient outcomes. In contrast with meta-analysis and meta-regression, whose primary aim is the synthesis of existing trials, our objective is accurate prediction on unseen future trials (out-of-sample prediction).
2.3.1
Data and Variables
We used the data we extracted from published clinical trials described in Table 2.3 together with data about the drug therapy tested in each trial arm to develop the sta-tistical models. This data can be classified into four categories: patient demographics, study characteristics, chemotherapy treatment, and trial outcomes.
One challenge of developing statistical models using data from different clinical trials comes from the patient demographic data. The patient populations can vary sig-nificantly from one trial to the next. For instance, some clinical trials enroll healthier patients than others, making it difficult to determine whether differences in outcomes across trials are actually due to different treatments or only differences in the pa-tients. To account for this, we include as independent variables in our model all of the patient demographic and study characteristic variables listed in Table 2.3. The reporting frequencies for each of these variables is given in Table 2.3, and missing values are replaced by their variable means or estimates described in Appendix A.1 before model building. In total, we included 20 patient demographic and study char-acteristic variables in our models.4
For each treatment protocol we also define a set of variables to capture the chemotherapy drugs used and their dosage schedules. There exists considerable vari-ation in dosage schedules across chemotherapy trials. For instance, consider two different trials that both use the common drug 5-fluorouracil5: in the first, it is
ad-ministered at 3, 000 𝑚𝑔/𝑚2 once a week, and in the second, at 200 𝑚𝑔/𝑚2 once a day. To allow for the possibility that these different schedules might lead to different sur-vival and toxicity outcomes, we define variables that describe not only whether or not the drug is used (a binary variable), but we also define variables for both the instan-taneous and average dosages for each drug in a given treatment. The instaninstan-taneous 4Variables include the fraction of patients who are male, the fraction of patients with prior
palliative chemotherapy, the median patient age, the mean ECOG performance status of patients, the fraction of patients with a primary tumor in the stomach, the fraction of patients with a primary tumor in the gastroesophageal junction, the fraction of study authors from each country (11 total variables), the fraction of study authors from an Asian country, the number of patients in the study, and the study’s publication year.
dose is defined as the dose of drug 𝑑 administered each day 𝑑 is given to patients, and the average dose of a drug 𝑑 is defined as the average dose of 𝑑 delivered each week. We do not encode information about loading dosages, which are only given during the first cycle of a chemotherapy regimen, and we use the average instantaneous dosage if a drug is given at different dosages on different days during a cycle. In total, we included 72 drugs in our models, which are listed in Appendix B. As a result, we included 216 drug-related independent variables in our models.
Lastly, for every clinical trial arm we define outcome variables to be the median overall survival and the combined toxicity score defined in Section 2.2.2. Trial arms without an outcome variable (and for which we cannot replace the value by estimates described in Appendices A.2 and A.3) are removed prior to building or testing the corresponding models.
2.3.2
Statistical Models
We implement and test several statistical learning techniques to develop models that predict clinical trial outcomes. Information extracted from results of previously pub-lished clinical trials serve as the training database from which the model parameters are learned. Then, given a vector of inputs corresponding to patient characteristics and chemotherapy treatment variables for a newly proposed trial, the models produce predictions of the outcomes for the new trial.
The first class of models we consider are regularized linear regression models. If we let x represent a mean-centered, unit-variance vector of inputs for a proposed trial (i.e. patient, study, and treatment variables) and 𝑦 represent a particular outcome measure we would like to predict (median OS or DLT proportion), then this class of models assumes a relationship of the form 𝑦 = 𝛽′x + 𝛽0 + 𝜖, for some unknown
vector of coefficients 𝛽, intercept 𝛽0, and error term 𝜖. We assume that the noise
terms 𝜖𝑖 are independent with variance of the form 𝑉 (𝜖𝑖) = 𝜎2𝑛−1𝑖 , where 𝜎 is an
unknown constant and 𝑛𝑖 is the number of patients in trial arm 𝑖. We adjust for
this expected heteroskedasticity by assigning weight 𝑤𝑖 = 𝑛𝑖/¯𝑛 to each trial arm 𝑖
arm. It is well known that in settings with a relatively small ratio of data samples to predictor variables, regularized models help to reduce the variability in the model parameters. We obtain estimates of the regression coefficients ^𝛽 and ˆ𝛽0by minimizing
the following objective:
min ^ 𝛽, ^𝛽0 𝑁 ∑︁ 𝑖=1 𝑤𝑖( ^𝛽 ′ x𝑖+ ˆ𝛽0− 𝑦𝑖)2+ 𝜆‖ ^𝛽‖𝑝𝑝, (2.1)
where 𝑁 is the number of observations in the training set and 𝜆 is a regularization pa-rameter that limits the complexity of the model and prevents overfitting to the train-ing data, thereby improvtrain-ing prediction accuracy on future unseen trials. We choose the value of 𝜆 from among a set of 50 candidates through 10-fold cross-validation on the training set.6
The choice of norm 𝑝 leads to two different algorithms. Setting 𝑝 = 2 yields the more traditional ridge regression algorithm [90], popular historically for its computa-tional simplicity. More recently, the choice of 𝑝 = 1, known as the lasso, has gained popularity due to its tendency to induce sparsity in the solution [164]. We present results for both variants below, as well as results for unregularized linear regression models.
The use of regularized linear models provides significant advantages over more sophisticated models in terms of simplicity, ease of interpretation, and resistance to overfitting. Nevertheless, there is a risk that they will miss significant nonlinear effects and interactions in the data. Therefore, we also implement and test two additional techniques which are better suited to handle nonlinear relationships: random forests (RF) and support vector machines (SVM). For random forests [34], we use the nominal values recommended by [86] for the number of trees to grow (500) and minimum node size (5). The number of variable candidates to sample at each split is chosen through 10-fold cross-validation on the training set.7 For SVM, following the approach of [93],
6Candidate values of 𝜆 are exponentially spaced between 𝜆
𝑚𝑎𝑥/104 and 𝜆𝑚𝑎𝑥. We take 𝜆𝑚𝑎𝑥 to
be the smallest value for which all fitted coefficients ^𝛽 are (numerically) zero.
7Candidate values are chosen from among exponentially spaced values
([1.5−4 𝑣3], [1.5−3 𝑣3], . . . , [1.52 𝑣3]), where 𝑣 is the total number of input variables and [·] denotes rounding to the nearest integer.
we adopt the radial basis function kernel and select the regularization parameter 𝐶 and kernel parameter 𝛾 through 10-fold cross validation on the training set.8
All models were built and evaluated with the statistical language R ver-sion 3.0.1 [143] using packages glmnet [69], randomForest [119], and e1071 [127].
2.3.3
Statistical Model Results
Following the methodology of Section 2.2, we collected and extracted data from a set of 414 published journal articles from 1979–2012 describing the treatment methods and patient outcomes for a total of 495 treatment arms of gastric cancer clinical trials. To compare our statistical models and evaluate their ability to predict well on unseen trials, we implement a sequential testing methodology. We begin by sorting all of the clinical trials in order of their publication date. We then only use the data from prior published trials to predict the patient outcomes for each clinical trial arm. Note that we never use data from another arm of the same clinical trial to predict any clinical trial arm. This chronological approach to testing evaluates our model’s capability to do exactly what will be required of it in practice: predict a future trial outcome using only the data available from the past. Following this procedure, we develop models to predict the median overall survival as well as the overall toxicity score. We begin our sequential testing 20% of the way through the set of 495 total treatment arms, setting aside the first 98 arms to be used solely for model building so that our training set is large enough for the first prediction. Of the remaining 397 arms, we first remove those for which the outcome is not available, leaving 383 arms for survival and 338 for toxicity. We then predict outcomes only for those arms using drugs that have been seen at least once in previous trials (albeit possibly in different combinations and dosages). This provides us with 347 data points to evaluate the survival models and 307 to evaluate the toxicity models.
The survival models are evaluated by calculating the root mean square error (RMSE) between the predicted and actual trial outcomes. They are compared against 8Candidate values are chosen from an exponentially spaced 2-D grid of candidates (𝐶 =
0.0 0.2 0.4 0.6 2000 2002 2004 2006 2008 2010 2012 Year Sur viv al: 4−Y ear Sequential R 2 Lasso Linear RF Ridge SVM
Figure 2-2: Sequential out-of-sample prediction accuracy of survival models calculated over 4-year sliding windows ending in the date shown, reported as the coefficient of determination (𝑅2).
a naive predictor (labeled “Baseline”), which ignores all trial details and reports the average of previously observed outcomes as its prediction. This is a standard base-line method used in evaluating sequential prediction models. Model performance is presented in terms of the coefficient of determination (𝑅2) of our prediction models
relative to this baseline. For each 4-year period of time we compute the RMSE and 𝑅2 of each model. To assess statistical fluctuation of these quantities, for each prediction we additionally train 40 models with bootstrap resampled versions of the training set, and for each 4-year period we report the mean, 2.5% quantile, and 97.5% quan-tile of the RMSE and 𝑅2 obtained when randomly sampling one of the 40 bootstrap model predictions for each of the predictions made during that 4-year period. Fig-ure 2-2 displays the 4-year sliding-window statistical fluctuation of the out-of-sample 𝑅2 value, and Table 2.4 displays the values of the RMSE and 𝑅2 over the most
re-cent 4-year window of sequential testing, both for the cross-validation results and the out-of-sample predictions.
To evaluate the toxicity models, recall from the discussion of Section 2.2.2 that the toxicity of a treatment is considered manageable as long as the proportion of
Root Mean Square Error (RMSE) Coefficient of Determination (𝑅2)
Model X-Val OOS Bootstrap X-Val OOS Bootstrap
Baseline — 3.75 3.76 [3.73,3.78] — 0.00 0.00 [-0.01,0.01] Linear — 2.72 3.16 [2.67,4.58] — 0.48 0.27 [-0.49,0.50] Ridge 2.02 2.50 2.57 [2.47,2.67] 0.49 0.56 0.53 [0.50,0.57] Lasso 2.00 2.44 2.66 [2.50,2.83] 0.50 0.58 0.50 [0.43,0.56] RF 2.05 2.61 2.68 [2.59,2.77] 0.48 0.52 0.49 [0.45,0.53] SVM 2.00 2.60 2.65 [2.54,2.77] 0.50 0.52 0.50 [0.46,0.54]
Table 2.4: Root mean square prediction error (RMSE) and 𝑅2 for the cross-validation
set (“X-Val”), for sample predictions (“OOS”), and for bootstrapped out-of-sample predictions (“Bootstrap”) for survival predictions in the most recent 4-year window of data (March 2008–March 2012), which includes 132 out-of-sample predic-tions.
patients experiencing a dose-limiting toxicity (DLT) is less than a fixed threshold — a typical value used in Phase I studies for this threshold is 0.5. Thus, we evaluate our toxicity models on their ability to distinguish between trials with “high toxicity” (DLT proportion > 0.5) and those with “acceptable toxicity” (DLT proportion ≤ 0.5). The metric we will adopt for this assessment is the area under the receiver-operating-characteristic curve (AUC). The AUC can be naturally interpreted as the probability that our models will correctly distinguish between a randomly chosen unseen trial arm with high toxicity and a randomly chosen unseen trial arm with acceptable toxicity. As was the case for survival, we calculate the AUC for each model over a 4-year sliding window and assess statistical fluctuation using bootstrapping, with the results shown in Figure 2-3 and Table 2.5.
We see in Figures 2-2 and 2-3 that models for survival and toxicity all show a trend of improving prediction quality over time, which indicates our models are becoming more powerful as additional data is added to the training set. The decrease in the AUC of the toxicity model toward the end of the testing period might be attributable to the large number of new drugs tested in gastric cancer in recent years — 8% of trial arms from 2007–2009 evaluated a drug that had been tested in fewer than three previous arms, while 21% of arms from 2010–2012 tested such a drug. We see that ridge regression, lasso, SVM, and RF all attain similar performance when predicting both survival and toxicity, with sequential 𝑅2 of more than 0.5 for recent survival
0.5 0.6 0.7 0.8 0.9 1.0 2000 2002 2004 2006 2008 2010 2012 Year T o xicity: 4−Y ear Sequential A UC Lasso Linear RF Ridge SVM
Figure 2-3: Four-year sliding-window sequential out-of-sample classification accuracy of toxicity models, reported as the area under the curve (AUC) for predicting whether a trial will have high toxicity (DLT proportion > 0.5).
Area Under the Curve (AUC)
Model X-Val OOS Bootstrap
Baseline — 0.43 0.49 [0.36,0.61] Linear — 0.82 0.77 [0.70,0.84] Ridge 0.76 0.83 0.81 [0.77,0.85] Lasso 0.77 0.82 0.81 [0.76,0.85] RF 0.78 0.81 0.80 [0.75,0.84] SVM 0.78 0.87 0.84 [0.80,0.89]
Table 2.5: AUC for the cross-validation set (“X-Val”), for out-of-sample predictions (“OOS”), and for bootstrapped out-of-sample predictions (“Bootstrap”) for toxicity predictions in the most recent 4-year window of data (March 2008–March 2012), which includes 119 out-of-sample predictions. Of these, 24 (20.1%) actually had high toxicity.