HAL Id: hal-02927145
https://hal.archives-ouvertes.fr/hal-02927145
Submitted on 1 Sep 2020
HAL is a multi-disciplinary open access archive for the deposit and dissemination of sci-entific research documents, whether they are pub-lished or not. The documents may come from teaching and research institutions in France or abroad, or from public or private research centers.
L’archive ouverte pluridisciplinaire HAL, est destinée au dépôt et à la diffusion de documents scientifiques de niveau recherche, publiés ou non, émanant des établissements d’enseignement et de recherche français ou étrangers, des laboratoires publics ou privés.
Hygromechanical properties of grenadilla wood
(Dalbergia melanoxylon)
Ahmad Alkadri, Delphine Jullien, Olivier Arnould, Eric Rosenkrantz, Patrick
Langbour, Louise Hovasse, Joseph Gril
To cite this version:
Ahmad Alkadri, Delphine Jullien, Olivier Arnould, Eric Rosenkrantz, Patrick Langbour, et al.. Hy-gromechanical properties of grenadilla wood (Dalbergia melanoxylon). Wood Science and Technology, Springer Verlag, 2020, �10.1007/s00226-020-01215-z�. �hal-02927145�
L Longitudinal direction R Radial direction T Tangential direction c Diffusing concentration
Hygromechanical properties of grenadilla wood (Dalbergia
melanoxylon)
Ahmad Alkadri1,2 · Delphine Jullien2· Olivier Arnould2· Eric Rosenkrantz3·
Patrick Langbour4· Louise Hovasse1· Joseph Gril5
Abstract
Grenadilla wood (Dalbergia melanoxylon Guill. & Perr.) is a hardwood species found in Tanzania, Mozambique, and other countries in the tropical part of Africa, especially in the Eastern-Central region. Thanks to its high density and good hygro-scopic stability, it is used in the making of various musical instruments and fine fur-niture. Due to the scarcity of published data on this wood species, more studies on its properties are needed to improve its processing and use, and even to search for sus-tainable alternative materials as its trade is increasingly limited by new regulations. This work is focused on the hygromechanical properties, which hold an important role in the applications of this wood: diffusion coefficients and adsorption–desorp-tion curve (both measured atT =20◦C), swelling–shrinkage coefficients and full orthotropic elastic constants using an ultrasonic method. Results show that grenadilla wood possesses small water diffusion coefficients (from1.54±0.49×10⁻⁷cm2∕sin T direction to4.58±0.84×10⁻⁷cm2∕sin L direction), which is probably related to its high density (1250.0±26.2kg∕m2); unique equilibrium moisture content (sorp-tion) curve with a lower fiber saturation point (0.173±0.003); smaller swelling– shrinkage coefficients (0.20±0.03and0.32±0.05in T and R directions, respec-tively); and elastic constants lower in the longitudinal direction (15.56±1.79GPa) and higher in the transverse ones (5.10±0.46GPa and4.05±0.35GPa inRandT directions, respectively) than what could be expected with a standard model based on the density only. Several explanations were described here, from the effects of a high extractive content to the possibility of a high microfibril and/or fiber angle. List of symbols
ci Initial diffusing concentration cf Final diffusing concentration
Mt Total change of moisture content at a given time t Mf Total final change of moisture content
[C] Stiffness matrix
Cij Component of stiffness matrix [S] Compliance matrix, where [C] = [S]−1
DL A code designating a diffusion sample for L direction DR A code designating a diffusion sample for R direction DT A code designating a diffusion sample for T direction D Coefficient of diffusion, written here as cm2∕s
[D] Matrix of diffusion coefficients, which consists of D for diffusion in L, R and T
D0 Constant diffusion coefficient D
Dlin Coefficient of diffusion whose values vary linearly with W De Coefficient of diffusion whose values vary exponentially with W EMC Equilibrium moisture content (without unit)
𝛾 Swelling–shrinkage coefficient (without unit)
𝛾R, 𝛾T Swelling–shrinkage coefficient for R and T directions, respectively 𝛤V Volume swelling coefficient
S A code designating a sample as a swelling–shrinkage sample 𝛼, 𝜙 Intrinsic thermodynamic full-cycle curve parameters (unitless) A, 𝛽, K Empirical partial-cycle curve parameters (unitless)
V Volume ( m3)
V Wave propagation velocity (m/s)
V𝜃 Wave propagation velocity measured at angle 𝜃 (m/s) W Water/moisture content of wood (unitless)
Ws Fiber saturation point of wood (unitless)
Wt Moisture content of wood sample at time t, Eq. 12 Wi Initial moisture content (unitless), Eqs. 3, 4 and 12 Wf Final moisture content (unitless), Eqs. 3, 4 and 12
𝜁x Hydric capacity of the isothermal envelope for adsorption or desorption, Eq. 7
h Relative humidity or RH (unitless)
hi Initial relative humidity (unitless), referred to Eqs. 3–4 hf Final relative humidity (unitless), referred to Eqs. 3–4 m Mass in g
p, b Empirical constants to be estimated (no unit), referred to in Eq. 15
𝜇 Mean values
𝛿 Standard deviation values
k Empirical constant to be estimated (no unit) from Eq. 16
l Thickness of the sample (mm). 𝜌 Density of the wood ( kg/m3) T Temperature ( ◦C)
h Relative humidity (unitless)
Y Dimension of the sample in particular direction (can be in R, L or T), in mm.
Yi Initial dimension of the sample in particular direction, in mm, measured at Wi
Yf Initial dimension of the sample in particular direction, in mm, measured at Wf
𝜖 Mechanical or hygroscopic strain of wood
𝜉 The weighed parameter for partial-cycle curve, referred to Eqs. 3–6 𝜉a The weighed parameter for partial-cycle curve during adsorption ( hf >hi) 𝜉d The weighed parameter for partial-cycle curve during desorption ( hf <hi) sse Sum of squared error
Introduction
Grenadilla (Dalbergia melanoxylon) is a tree species from the Leguminosae (Fabaceae) family (Détienne 1990; Gérard et al. 2017). It grows in the tropical, savanna part of Africa, and can be found most in Eastern-Central African countries such as Tanzania and Mozambique (Détienne 1990; Malimbwi et al. 2000; Ball
2004; Gérard et al. 2017). The tree can reach a height of 7–10 m, and the leaves are broad with compound form (Chave et al. 2009; Parr et al. 2014).
Grenadilla heartwood, in contrast to its sapwood, is deeply dark in color, which explains its other name: African blackwood. With an air-dry density of its heart-wood ranging between 1100 and 1400 kg/m3 , it is one of the woods with the highest density among all commercial timbers in the world (Zadro 1975; Gérard et al. 2017; Sproßmann et al. 2017; Liu et al. 2020). Additionally, it possesses a high extractive content, up to 16 to 25% (Jankowska et al. 2016; Gérard et al. 2017; Yin et al. 2018), many of them from the category of neoflavanoids (Donnelly et al. 1975). These extractives possibly contribute to its high hygroscopic stability—which, however, remains to be proved through meticulous testing—and natural durability against tim-ber-decaying organisms (Hillis 1971; Van Heerden et al. 1980; Rowell and Banks
1985; Gérard et al. 2017). As a consequence, it is used for a lot of applications. Grenadilla wood is often used for the making of musical instruments such as oboe and clarinet which demands a high-dimensional stability and low roughness during the machining process and the usage (Zadro 1975). Another example on its use in the domain of the musical instrument is in the making of guitar necks, specifi-cally its fret or top part (Sproßmann et al. 2017). Other uses include the making of luxury furniture, ranging from tables and sofas to cabinets (Lancaster and Espinoza
2012; Ogawa 2018) or artworks such as marqueteries. Actually, it was because of this last application that, for years, rising demands of Dalbergia melanoxylon have been coming especially from China (Wenbin and Xiufang 2013). Such demands are so high that it has put pressure on the grenadilla stock in the nature and in the market (IUCN 1998; Lancaster and Espinoza 2012; Ogawa 2018).
In 2017, CITES added grenadilla wood, together with all other wood spe-cies from the Dalbergia genus, to its appendix of endangered spespe-cies (Snel et al.
of this wood, insufficiently compensated by plantation efforts: Grenadilla is a slow-growing tree species, with time needed to reach mature size ranging from 50–80 to 70–100 years (Malimbwi et al. 2000; Ball 2004). This has led to a decrease in sup-ply, while demand is increasing. Simply raising the timber price would not solve that problem because of the lack of data and regulations, plus inefficient enforcements by laws leading to much illegal trade (Innes 2010; Treanor 2015; Randriamamonjy et al. 2016; Remy 2017).
Today, thanks to the efforts of many stakeholders, grenadilla wood, alongside its Dalbergia cousins, is getting the attention it deserves. Laws and tools are being pre-pared to better regulate the trade flow of these timber species (Hassold et al. 2016; Lowe et al. 2016; Siriwat and Nijman 2018; Ugochukwu et al. 2018). Although recent development has exempted musical instrument making from the Dalbergia trade restriction, the still increasing interest in grenadilla also highlights, perhaps unintendedly, the gaps in the literature regarding the species, especially on its pre-cise stock in nature and its material properties. Current efforts are focused on its conservation in nature, thereby closing the gap of knowledge on the stock data. However, material property data remain insufficient. Such knowledge is particularly needed in the context of decreasing availability and stable or increasing demand, where a wiser use of the material is essential. In addition, there is the possibility of a search for substitute material, wood or synthetic, for its many applications.
Related to the needs for products in long-term use, hygromechanical behavior is a key property. As a hygroscopic material, wood exchanges water with its environment to reach an equilibrium state, following a function of surrounding relative humid-ity (h) and temperature (T) (Hailwood and Horrobin 1946) which results in equilib-rium moisture content (EMC) and hygroelastic expansion (swelling or shrinkage). The time-dependent mechanical response of wood is affected by these changes and known as hygromechanical behavior. Although many studies have been conducted on the hygromechanical properties of wood from tropical regions, particularly those of Africa—such as African whitewood, frake and grenadilla’s twin wood species in appearance, ebony (Jannot et al. 2006; Fernández et al. 2014; Simo-Tagne et al.
2016a, 2019)—few have determined such properties for grenadilla.
Thus, the objective of this paper is to present the data for the basic properties of grenadilla wood, particularly regarding sorption, diffusion, anisotropic expan-sion and elasticity. The study of time-dependent behavior and hygromechanical cou-plings will be left for further investigations.
Materials and methods
Sampling plan
Sampling for hygroscopic characterization
A major part of this study consists of experimental characterizations of diffu-sion, adsorption and desorption properties of grenadilla. Taking into account the
orthotropical properties of wood, a sampling plan adapted from another study (Olek and Weres 2007) was prepared as follows:
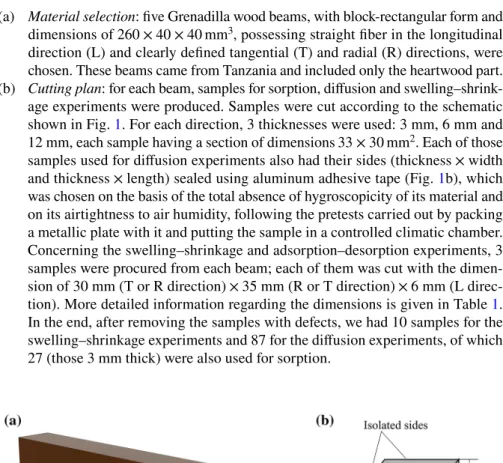
(a) Material selection: five Grenadilla wood beams, with block-rectangular form and dimensions of 260 × 40 × 40 mm3 , possessing straight fiber in the longitudinal direction (L) and clearly defined tangential (T) and radial (R) directions, were chosen. These beams came from Tanzania and included only the heartwood part. (b) Cutting plan: for each beam, samples for sorption, diffusion and swelling–shrink-age experiments were produced. Samples were cut according to the schematic shown in Fig. 1. For each direction, 3 thicknesses were used: 3 mm, 6 mm and 12 mm, each sample having a section of dimensions 33 × 30 mm2 . Each of those samples used for diffusion experiments also had their sides (thickness × width and thickness × length) sealed using aluminum adhesive tape (Fig. 1b), which was chosen on the basis of the total absence of hygroscopicity of its material and on its airtightness to air humidity, following the pretests carried out by packing a metallic plate with it and putting the sample in a controlled climatic chamber. Concerning the swelling–shrinkage and adsorption–desorption experiments, 3 samples were procured from each beam; each of them was cut with the dimen-sion of 30 mm (T or R direction) × 35 mm (R or T direction) × 6 mm (L direc-tion). More detailed information regarding the dimensions is given in Table 1. In the end, after removing the samples with defects, we had 10 samples for the swelling–shrinkage experiments and 87 for the diffusion experiments, of which 27 (those 3 mm thick) were also used for sorption.
Fig. 1 Sampling plan schematic for hygroscopic characterizations: a cutting plan from the rectangular-block beam toward small samples, b diffusion/sorption samples, with l = 3 , 6 or 12 mm and c swelling– shrinkage samples
Sampling for mechanical characterization
The mechanical characterization in this study was carried out using a nondestructive method based on the measurement of ultrasound wave propagation speed. Taking into account the orthotropical properties of wood, an adapted sampling plan similar to those used in other past studies (Bucur 2006; Gonçalves et al. 2014) was prepared as follows:
(a) Material selection: five grenadilla wood specimens, one per beam, were cut into cuboid shape, with the size of 20 × 20 × 20 mm3 (L, R and T direction) (Fig. 2a). Only specimens with good fiber orientation and consisting solely of heartwood were chosen.
(b) Cutting plan: the specimens were cut using CNC (computer numerical control) machine into a polyhedron (Fig. 2b). The 5 resulting samples were then used for the mechanical characterization.
Hygroscopic characterization
Adsorption–desorption: EMC experiments
Several models have been used successfully to fit sorption isotherms of the gravimetric response of wood to steps of constant relative humidity at a given temperature, such as the HH model (Hailwood and Horrobin 1946) or the Guggenheim, Anderson and de Boer (GAB) equation (Maroulis et al. 1988), including tropical species (Simo-Tagne et al. 2016a, 2019). Here, the sorption model developed by Merakeb et al. (2009) was adopted because of its thermodynamic basis, its limited number of parameters and its applicability to describe total and partial desorption and adsorption curves. In that
Table 1 Sampling code, dimensions and orientations
All values are in mm
Sample type Code
Thick-ness (direc-tion)
Width
(direc-tion) Length (direction)
Diffusion/sorption DT 3 (T) 30 (R or L) 33 (L or R) Diffusion DT 6 (T) 30 (R or L) 33 (L or R) Diffusion DT 12 (T) 30 (R or L) 33 (L or R) Diffusion/sorption DR 3 (R) 30 (L or T) 33 (T or L) Diffusion DR 6 (R) 30 (L or T) 33 (T or L) Diffusion DR 12 (R) 30 (L or T) 33 (T or L) Diffusion/sorption DL 3 (L) 30 (R or T) 33 (T or R) Diffusion DL 6 (L) 30 (R or T) 33 (T or R) Diffusion DL 12 (L) 30 (R or T) 33 (T or R) Swelling–shrinkage S1 6 (L) 30 (T) 33 (R) Swelling–shrinkage S2 6 (L) 30 (R) 33 (T)
model, the empirical approach of Pederson (1990) was used to describe partial iso-therms, giving the moisture content (MC) at the equilibrium state for successive steps of h and T (Pederson 1990; Rode and Clorius 2004; Carmeliet et al. 2005; Varnier et al. 2020).
For a full-cycle sorption, the formulation of this model can be written as (Merakeb et al. 2009):
where W(h, T) refers to the MC as a function of the relative humidity (h) and tem-perature (T), while Ws(T) refers to the fiber saturation point of wood as a function of
T; 𝛼 and 𝜙 are thermodynamic parameters determined for both adsorption ( 𝛼a and
𝜙a ) and desorption ( 𝛼d and 𝜙d).
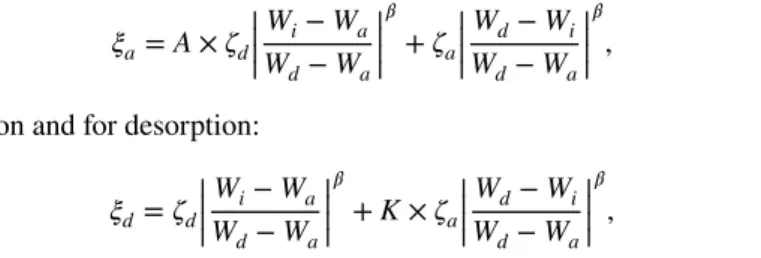
For the partial-cycle curve, an empirical weighing formulation is used (Varnier et al. 2020). The equations can be written as:
for adsorption and
for desorption. Wi refers to W at initial hi , while Wf refers to W at final hf . The
weighed parameter ( 𝜉 ) is described by (Pederson 1990; Kulasinski 2015; Varnier et al. 2020): (1) ln ( W Ws ) = 𝜙 × ln(h) × exp(𝛼h), (2) W(h, T) = Ws(T) × exp[𝜙× ln(h) × exp(𝛼h)], (3) Wf = Wi+ 𝜉a× (hf− hi), (4) Wf = Wi+ 𝜉d× (hf− hi),
Fig. 2 Sampling plan schematic for mechanical characterizations: a original cuboid sample and b poly-hedron sample cut from the cuboid sample
for adsorption and for desorption:
where Wa and Wd refer to the W values on adsorption and desorption curve
(Eqs. 1–2) with h = hi referred in both Eqs. 3 and 4. Finally, 𝜁x is described as (Rode
and Clorius 2004; Carmeliet et al. 2005):
with 𝛼 = 𝛼a and 𝜙 = 𝜙a for 𝜁x= 𝜁a or 𝛼 = 𝛼d and 𝜙 = 𝜙d for 𝜁x= 𝜁d.
The sorption samples were distributed with 14 in group “cycle A” and 13 in group “cycle B.” All samples were put in a climate chamber, type Memmert HPP 110, at T = 20◦C (ISO standards and mean temperature for the use of this wood in northern countries) and several humidity conditions (consecutively, as detailed in Table 2) with the equilibrium mass (m in gram) of each sample measured at each step. The reason for having two cycles (A and B) instead of only one is that, as we can see in Table 2, cycle A has a smaller isotherm cycle than B. This was useful during the estimation of the isotherm model parameters using curve-fitting method: Instead of only having one partial cycle (from the dry state to close to the saturated one), we have a second smaller partial cycle that allows to identify parameters for limited hygrometric variations in the hygroscopic domain. Thus, the estimation of the isotherm model parameters would be more robust and applicable to any case. The curve-fitting calculations were conducted using MATLAB with Curve Fitting Toolbox® (Mathworks 2018a).
To ensure that the final mass is as close as possible to that of the equilibrium level, we proceed to the next step only when the masses of the samples do not change more (5) 𝜉a= A × 𝜁d|||| Wi− Wa Wd− Wa || || 𝛽 + 𝜁a|||| Wd− Wi Wd− Wa || || 𝛽 , (6) 𝜉d= 𝜁d|||| Wi− Wa Wd− Wa || || 𝛽 + K × 𝜁a|||| Wd− Wi Wd− Wa || || 𝛽 , (7) 𝜁x= 𝜕Wx 𝜕h = Ws ( 𝛼𝜙exp(𝛼h) ln (h) +𝜙exp(𝛼h) h ) exp(𝜙 exp(𝛼h) ln (h)),
Table 2 Humidity steps of EMC
experiments at T = 20◦C where
h is the relative humidity of the climate chamber (fractional)
Steps no. Cycle A Cycle B
h Note h Note
1 0.85 First stabilization 0.65 First stabilization
2 0.65 Desorption 0.85 Adsorption 3 0.45 Desorption 0.65 Desorption 4 0.25 Desorption 0.45 Desorption 5 0.00 Drying 0.25 Desorption 6 0.25 Adsorption 0.45 Adsorption 7 0.45 Adsorption 0.65 Adsorption 8 0.65 Adsorption 0.00 Drying 9 0.00 Drying – –
than 0.001 g (variation ≈0.03% of the sample’s initial mass, smaller than the 0.1% per day usually required in the standards) between measurements, which were, on aver-age, conducted once a day. The stabilization time for one step was around 2 to 3 days, as will be shown in the Results section. The measurements were taken using a Mettler Toledo ME204 scale, with a displayed precision of 0.0001 g.
The final step is drying the samples completely using vacuum-drying method, deployed together with P2O5 for absorbing the evaporating moisture at T = 60◦C , so that the moisture content for each h level can be derived. Drying at a reduced tempera-ture is necessary to prevent the extractives from leaking out of the sample.
Diffusion experiments
The diffusion experiments were performed with several h steps inside a climate-con-trolled chamber, just like the adsorption–desorption experiments. The relative humidity conditions are detailed in Table 3.
The mass of each sample, including the aluminum adhesive tape, was measured periodically (on average, once every three hours for the first day of stabilization at a new level of h, followed by twice a day afterward). Every time all of the samples reached their equilibrium state, which means their mass changes fall within the value of only ±0.001 g between measurements (similar to the method for equilibrium moisture content, “Adsorption–desorption: EMC experiments” section), we moved to the next step to do the diffusion processes again with the mass measurements conducted peri-odically until the samples reached their equilibrium state. This continued until the 4th step, after which the whole samples were collected and dried completely so that their moisture content (W) can be calculated. Note that it is assumed that the mass of the aluminum adhesive tape does not change with the relative humidity, as it was shown during the pretest carried out by packing a metallic plate with it.
By assuming zero free water inside the wood samples (as is the case for W < Ws ),
the concentration of moving bound water during the diffusion process can be written as:
where c is the diffusing concentration of moisture, t the diffusion time and D the coefficient of diffusion (Crank 1979). In the case of wood, as an orthotropic material, (8) 𝜕c
𝜕t = ∇ ⋅ (D∇c),
Table 3 Steps of diffusion experiments where h is the relative humidity of the climate chamber (fractional)
Steps no. Step type T(◦C) h
1 First stabilization 20 0.30
2 Adsorption 20 0.50
3 Adsorption 20 0.70
4 Adsorption 20 0.90
5 Complete drying in vacuum
dryer +P2O
5
D can be expressed as a tensor of three diffusion coefficients ( DL , DR and DT for dif-fusion in L, R and T direction, respectively) and its matrix written as follows (Eitel-berger and Hofstetter 2010) in the main direction of orthotropy:
To determine these diffusion coefficients, we adapted the experimental method con-ducted in previous studies (Olek and Weres 2007). As detailed in “Sampling plan” section, before diffusion, samples with three different thicknesses and sealed sides were prepared (Fig. 1a, Table 1) so that only unidimensional diffusion can occur on the desired direction.
Next, we solved the diffusion equation itself by two methods: analytical and numerical.
Analytical method For the analytical method, by assuming a constant coefficient of diffusion D0 , the analytical solution can be written as (Crank 1979):
where ci and cf refer to the initial and final diffusing concentration, while X refers
to the half-thickness of the sample, x refers to the coordinate in thickness from the middle of the sample of a point inside the sample and c(x, t) refers to the concentra-tion at point x at time t.
Derived from the above solution, the ratio between the total change of moisture content at a given time t ( Mt ) and the total final change in moisture ( Mf ) can be
writ-ten as (Crank 1979):
Experimentally, this ratio of Mt∕Mf can be measured as (Siau 1984):
where Wt refers to W measured at time t, while Wi and Wf are initial and final W,
respectively. As the sum is infinite in Eq. 11, it is usual to compute an approximate value for a finite number of n. Thus, Siau (1984) simplified this equation as follows:
for tD∕X2 >0.2 , where only the first exponential term ( n = 0 ) is necessary, and (9) [D] = ⎡ ⎢ ⎢ ⎣ DL 0 0 0 DR 0 0 0 DT ⎤ ⎥ ⎥ ⎦ . (10) c(x, t) − ci cf − ci = 1 −4 𝜋 ∞ ∑ n=0 exp(−D0(2n + 1) 2𝜋2t 4X2 ) cos( (2n + 1)𝜋x 2X ), (11) Mt Mf = 1 − ∞ ∑ n=0 8 (2n + 1)2𝜋2exp(− D0(2n + 1)2𝜋2t 4X2 ). (12) Mt Mf = Wt− Wi Wf − Wi , (13) Mt Mf = 1.0 − 0.811 exp(−2.47 tD X2),
for tD∕X2<0.2 . This last equation is an adjustment by a square root function of Eq. 11 for n varying from 0 to several tens. Together, Eqs. 13 and 14 were combined here for estimating the coefficient of diffusion in its constant form ( D0).
Numerical method For the numerical method, the diffusion equation (Eq. 8) was solved using finite element method (FEM) using MATLAB Partial Differential Equa-tion Toolbox® (Mathworks 2018b). In this method, two kinds of approach were used: The first is by assuming that the coefficient of diffusion is a linear function of W, while the second is by assuming that it varies exponentially with W (Olek and Weres
2007). These approaches can be expressed as follows:
where p, b and k are empirical constants whose values have to be estimated and D0 is the value obtained through Eqs. 13 and 14 (analytical model).
Fitting the models to the experimental results The coefficient of diffusion was esti-mated using optimization method by fitting the analytical and numerical curves to the experimental, measured, data using least-squares method in MATLAB Curve Fitting Toolbox® (Mathworks 2018a), similar to what was used for estimating the sorption isotherm parameters. To evaluate the quality of the fitting, a goodness-of-fit param-eter sse or sum of squares due to error was used. This statistical paramparam-eter measures the sum of deviation of the values generated by the fitted model to the data.
Swelling–shrinkage measurements
The measurements of swelling–shrinkage, or the hygroelastic expansion caused by the changes in W, were taken using the adsorption–desorption samples with the same experimental steps as the EMC experiments (Table 2). The relationships between the dimensional variations and W can be written as:
where Wf and Wi are the W at hf and hi , respectively (referred to in Eqs. 3 and 4),
𝛾 refers to the swelling–shrinkage coefficient (to be measured) and 𝜖 refers to the longitudinal strain caused by changes in W, calculated by the following equation in a given main direction:
where Yf and Yi refer to the final and initial dimensions measured during the final
stable condition ( W = Wf ) and the initial condition ( W = Wi ), respectively.
(14) Mt Mf = 1.13 √ tD X2, (15) Dlin= p ⋅ W + b, (16) De= D0⋅ exp(k ⋅ W), (17) 𝜖= 𝛾 ×(Wf− Wi ) , (18) 𝜖=(Yf− Yi ) ∕Yi,
Each swelling–shrinkage coefficient was determined through fitting the experimen-tally measured strain (Eq. 18) to the mathematical model (Eq. 17). Due to the limited amount of material available, the sample size in the L direction is too small to measure the strain in that direction, and so, we were not able to measure 𝛾L . Finally, to better compare the present results to past studies, the DIN 52184 standard was used to calcu-late the rate of volume swelling as the total of swelling rate in the radial, tangential and longitudinal directions, written as:
where
in which 𝛤x(W) is the swelling rate in a given direction ( x = T , R or L) during a
par-ticular level of moisture content (W), YW is the wood dimension in a certain direction
on a particular W level of moisture content, while Y0 is the dimension of wood in the said direction under complete anhydrous condition. In this way, this makes 𝛤 to be equal to 𝜖 if Yf is equal to YW and Yi to Y0 . As we were not able to measure 𝛤L , and as 𝛤L ≪ 𝛤R or 𝛤T , 𝛤v≈ 𝛤R+ 𝛤T.
Mechanical properties
The mechanical characterizations were conducted using ultrasound method. Par-ticularly, the properties here were those of the stiffness matrix [C] . By determin-ing [C] , we could then determine the compliance matrix [S] = [C]−1 . We did this by linking the phase velocity of the ultrasound wave to the stiffness parameters. The solutions of these equations were used to develop the ultrasonic method for determining the elastic constants of anisotropic materials (Bucur and Archer
1984; François et al. 1998; Gonçalves et al. 2014; Bachtiar et al. 2017).
Bachtiar et al. (2017) used different cubic samples with different orientations and did an in-depth analysis of the associated equations between the wave veloc-ity and the elastic parameters Cii . For the present study, the method developed by
Gonçalves et al. (2014) was adapted, which uses polyhedron samples (Fig. 2b), because of its practicality and capability to measure all the elastic parameters using only one sample.
Experimental protocol
Determining the density The density of the five samples used for the ultrasonic measurements was obtained by using gravimetric methods ( 𝜌 = m∕V ). The mass (m) of the sample was measured using a Mettler Toledo ME204 scale, which was also used for the EMC and diffusion experiments (“Adsorption–desorption: EMC experi-ments” and “Diffusion experiments”). The volume ( V ) was measured using Mitutoyo digital caliper with a displayed precision of 0.01 mm when the specimens were in (19) 𝛤v≈ 𝛤R+ 𝛤T+ 𝛤L,
(20) 𝛤x(W) =(Yw− Y0)∕Y0,
their cuboid form (Fig. 2) with 2 measurements for each direction. The mass and vol-ume of the samples were determined at h = 0.45 and T = 20◦C , as for all ultrasonic measurements.
Ultrasonic measurements The tools used in the ultrasonic measurements consist of an ultrasonic generator Sofranel PR5072, oscilloscope Tektronik TDS3032 with N acquisitions of 10,000 points with f = 500 MHz at 9 bits, and Sonaxis longitudinal (CMP 123) and transverse (CMP 124) probes with active diameter of 15 mm and central frequency of 500 kHz.
The measurements were taken in transmission. First, a reference echo was recorded by placing both probes in contact. Then, the experimental echo was recorded by placing both probes on the surfaces of the specimens facing each other, so that the echo passes through the sample from one probe and is captured by the other.
The transmitting probe was excited with a wave train (tone burst) of 5 cycles at 500 kHz and amplitude 10 Vpp (maximum voltage of the generator). The choice of these parameters has been made through previous tests and literature review. To ensure a good transmission through wood specimens, the frequency was chosen lower than those usually used for such testing to reduce damping. However, below 500 kHz, most ultrasonic probes have small frequency bandwidth. Therefore, dura-tion of echoes is too large, they overlap and precise measurement of the speed of sound is not possible. The bandwidth of the burst was narrow enough to obtain an almost monochromatic transmitted signal. Under these conditions, the group veloc-ity differed very little from the phase velocveloc-ity (Brillouin 2013; Orfanidis 2016). The time of flight was then deducted by calculating, using MATLAB’s Signal Processing Toolbox (Mathworks 2018c), the maximum of the envelope of the inter-correlation between the reference echo and the ones that passed through the sample.
In addition, the wavelength was small enough to measure the velocities of a semi-infinite medium (Tu et al. 1955; Ashman et al. 1984), which made it possible to determine the stiffness matrix according to the propagation direction and polariza-tion of the wave. The acoustic coupling was achieved using honey. It is a coupling medium that has been shown to be effective for shear waves and has been widely used in previous studies using ultrasound testing on materials (Kohlhauser et al.
2009; Camara et al. 2010; Cegla et al. 2011). In addition, it is very easy to remove with a minimum of water and penetrates very little into samples, so it does not induce significant variation in mass or moisture.
Determining the stiffness matrix components
The diagonal components of the [C] matrix ( Cii , where i = 1, 2, 3, … 6 ) were
deter-mined using the measurement of three longitudinal and three shear wave velocities propagating along the principal axes (L, R and T) and the density of the sample (Table 4).
Afterward, using the phase velocities measured at an angle 𝜃 from the main axis ( V𝜃 ) and the corresponding stiffness components, and by considering that the matrix
[C] is a symmetrical one, the remaining three components ( C12 , C13 and C23 ) were calculated using the methods described by Bachtiar et al. (2017). Note that the com-putation of the elastic constants was performed for each sample using its own data before averaging.
Results
Wood density
Firstly, it was found that the density of this wood, measured at T = 20◦C and h= 0.45 , is equal to 1250.0 ± 26.2 kg/m3 . This value is comparable to other stud-ies, which were in the range of 1100 to 1400 kg/m3 (Zadro 1975; Gérard et al. 2017; Sproßmann et al. 2017; Liu et al. 2020). Such value confirms grenadilla’s position as a commercial wood with one of the highest densities in the market.
Adsorption–desorption (EMC) curves
The mean ( 𝜇 ) and standard deviation ( 𝛿 ) values of the sorption parameters, identi-fied by fitting the curves of the models (Eqs. 1–7) on the experimental data from the samples of cycles A and B simultaneously, were successfully estimated (Table 5). The experimental data and the sorption model were also plotted together on the adsorption–desorption graph (Fig. 3). Note that only one set of parameters (Table 5) for all cycles was used.
Several points could be noted. Firstly, during the experiments, before the first sta-bilization of cycle A and cycle B samples (Table 2), all the specimens have been kept at room condition ( T ≈ 20◦ C and h ≈ 0.45 ). Therefore, it came as no surprise to us when we saw that all samples, during their first stabilization, experienced adsorption (not shown here). This is a small detail, but it should be noted for any experiments aiming to determine the adsorption–desorption parameters of wood. Moreover, Fig. 3 shows that the starting point of cycle A is outside the complete cycle. It is assumed that this is due to the fact that the equilibrium was not reached
Table 4 Determining the diagonal components of the stiffness tensor ( Cii)
Component Wave type Direction of propagation Direction of polarization Formula
C11 Longitudinal L (1) – 𝜌VLL2 C22 Longitudinal R (2) – 𝜌V2 RR C33 Longitudinal T (3) – 𝜌V2 TT C44 Shear R (2) or T (3) T (3) or R (2) 𝜌VRT or 𝜌V2 2 TR C55 Shear L (1) or T (3) T (3) or L (1) 𝜌VLT or 𝜌V2 2 TL C66 Shear L (1) or R (2) R (2) or L (1) 𝜌VLR or 𝜌V2 2 RL
for the first step of this cycle, when we have moved on to the next step. This start-ing point was thus considered as non-reliable and not taken into account durstart-ing the curve-fitting.
Next, we saw that the identified model, calculated using the mean values of the sorption parameters (Table 5), produces partial-cycle curves that fit quite well to the experimental data. Furthermore, the full-cycle model, here visualized in Fig. 3 using discontinuous black line, also contains all the experimental data and partial model. This shows that the obtained parameters here are well adapted for grenadilla wood.
However, several cautions should be known. Firstly, it should be noted here that the parameters were estimated at a temperature of 20◦C . Other temperatures could produce different material properties, especially for the fiber saturation point ( Ws ),
which has been known to vary with the temperature T (Berry and Roderick 2005; Zelinka et al. 2016; Varnier et al. 2020). Still regarding the fiber saturation point obtained here ( Ws= 0.173(3) , Table 5), it was estimated through the curve-fitting
instead of an experimental method, such as those conducted by Simpson (2001), because we do not possess grenadilla wood specimen in its green or freshly cut condition. The efforts to return wood to its green state by soaking it in the water until its moisture content reaches more than 0.30—where W = 0.30 is the mean fiber saturation point for many wood species (Glass and Zelinka 2010; Berry and Roderick 2005; Simpson 2001)—failed because, during the soaking process, part of the extractives of these samples came out and solubilized in water, thus making its
Table 5 Identified material parameters (unitless) of the sorption model (Eqs. 1–7)
Parameters Ws 𝜙a 𝜙d 𝛼a 𝛼d A 𝛽 K
𝜇 0.173 1.226 0.517 0.620 0.657 0.158 0.265 0.024
𝛿 ±0.003 ±0.109 ±0.018 ±0.196 ±0.268 ±0.135 ±0.087 ±0.041
Fig. 3 Experimental data and curves of the full and partial cycles of the identified adsorption–desorption model: arrows going up indicate adsorption, while arrows going down indicate desorption
final native “green” state highly questionable. Thus, future efforts in determining the “true” Ws of grenadilla, by drying samples from their green state and determining
the moisture content when they start to shrink, should be made by firstly obtaining wood samples in its green state.
Nevertheless, the value of Ws found here is comparable to those found by Gérard
et al. (2017) (0.25) and Liu et al. (2020) (0.11). In regard to the low value of Ws that
was found for grenadilla wood, one of the factors that could play an important role here is the presence of extractives. Past studies have shown that the extractives could significantly affect the hygroscopic properties of wood, particularly in preventing the bonding of water molecules with the wood cell walls (Choong 1969; Chen and Choong 1994; Nzokou and Kamdem 2004). Another, less important, factor could be the cellulose crystallinity. As described by Fernández et al. (2014), who conducted a study comparing the sorption and thermodynamic properties of obeche and limba wood—two species from Africa—a higher crystallinity index could lead to a lower proportion of amorphous part in cellulose, which implies less bonds with water mol-ecules, thus leading to a lower fiber saturation point. To the authors’ best knowledge, the crystallinity index of grenadilla has not been measured so far. Thus, this param-eter, as well as the extractive content (mainly) and their effects on sorption and the fiber saturation point, could be important to study in the future.
Diffusion coefficients
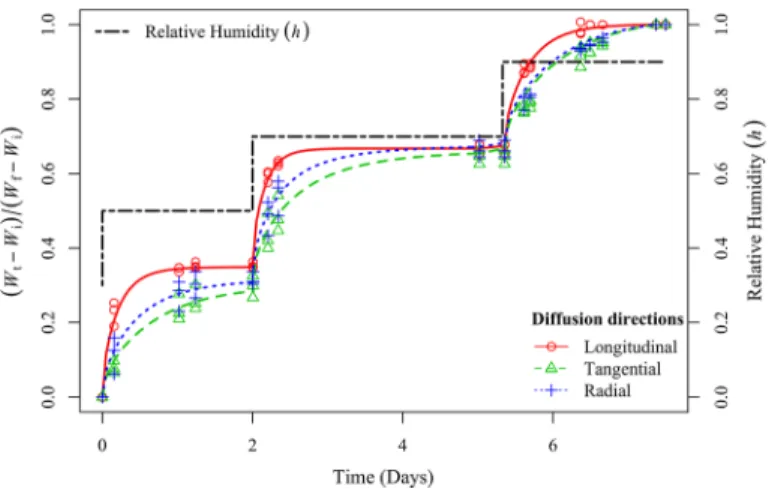
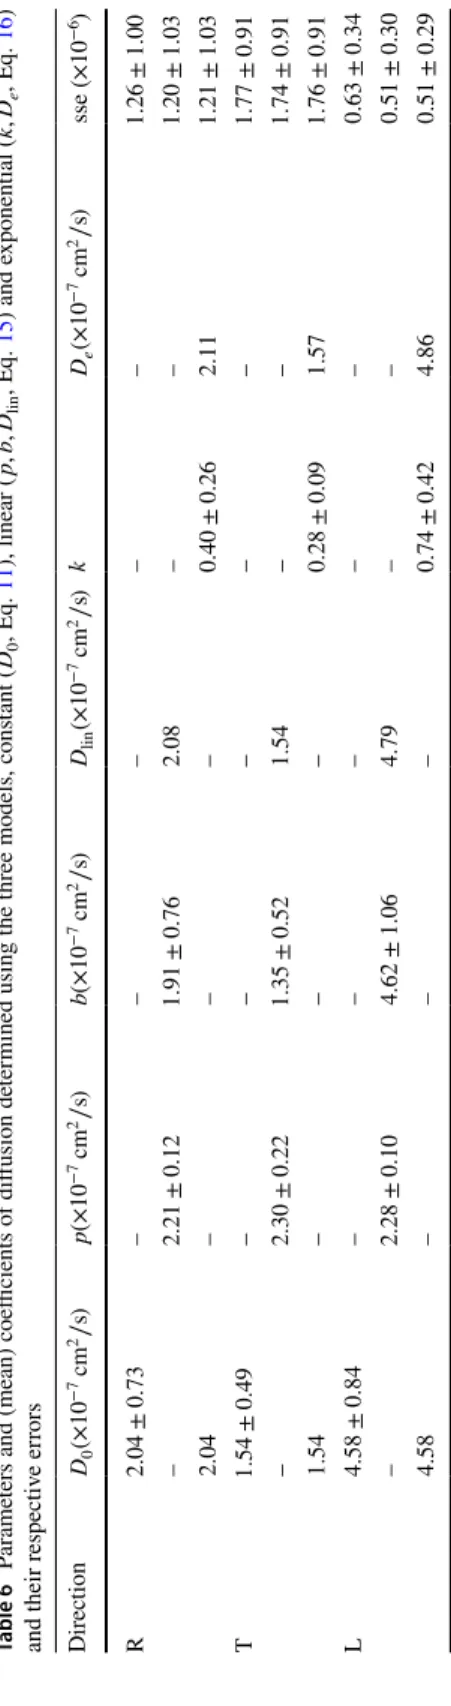
The diffusion coefficient was determined for the three directions L, R and T using both the analytical (constant coefficient) and numerical solutions (non-constant coefficient), together with the local relative errors for all methods. The results are given in Table 6, where the values for D are given in cm2∕s . The difference between the diffusion in L, R and T directions is visible in Fig. 4: L diffusion is the fastest one, while R is slightly quicker than T, although not very significantly, particularly at high-humidity condition.
Among the three approaches used to estimate the diffusion coefficients, the linear model given by Eq. 15 produced the smallest error values sse for all three directions although the difference between the sse values for each model in each direction is not significant. It should be noted that this phenomenon could be marked as nor-mal because the variation of the non-constant diffusion coefficient with the moisture contents itself is small, only 10–20% maximum for W varying from 0 to 0.15.
Moreover, among the three directions, the sse values for the diffusion in L direc-tion were the lowest. This indicates that the results of our curve-fitting model is bet-ter for DL than for DR or DT . Moreover, if the present coefficient of variation (CV) of the coefficients of diffusion was calculated as the ratio between their standard deviation 𝛿 and the mean value 𝜇 (thus CV = 𝜇∕𝛿 , data from Table 6), we can see that the CV of D0L (18.34%) is lower than those of D0R (35.78%) and D0T (31.82%).
This could be due to the fact that, as shown in Fig. 4, samples in the R and T direc-tions, contrary to the L direction, have not exactly reached the equilibrium before the change to the next step in relative humidity, and therefore, diffusion is almost always in an unstable or transient state, and moisture content inside the sample is
not completely homogeneous. This is not a problem with the numerical approach, where the adjustment was made for each curve in its entirety with all the h steps. In this case, the diffusion profile along the thickness of the sample is calculated and then integrated to obtain the variation in mass of the sample, so that it can take into account a non-homogeneous initial state when the relative humidity condition changes. However, it is true that this poses a problem for the analytical approach (for constant diffusion coefficient) because Eqs. 13 and 14 assume a homogeneous initial state of the sample. Nevertheless, computation of the moisture content profile at the end of a h step shows that this deviation from homogeneity seems negligible com-pared to the measurement variability. Another possible explanation for the better adjustment in the L direction is that the anatomical variation along the L direction is lower than those in the R and T directions, who are subjected more to irregularity caused by the varying cell distribution and density during cambial growth (Tateishi et al. 2008; Nugroho et al. 2012; Tanabe et al. 2018).
The relationship between wood density and diffusion coefficient can be discussed as well. Past studies have shown the link between these two parameters. In particu-lar, Siau (1984) has formulated the relationships in terms of not only density but also porosity and cell distribution. Compared to the coefficients of diffusion of other wood species found in other studies (Table 7), and by reporting them in a graph (Fig. 5), several important points could be noted.
Firstly, the relationships between the wood density and coefficient of diffusion could be clearly seen with a simple power function. We saw that, aside from the fit-ted line for DL , the other coefficients of diffusion seem to correspond well with their model. Not only that, the coefficients of diffusion for the tangential direction also fit to the modelized DT curve calculated by Siau (1984). Moreover, the values of D0 for grenadilla (constant value, Eq. 11) match quite well to these fitted lines, except for DL which seems to be significantly lower than both the fitted lines calculated from the data of other studies and the model of Siau (1984).
Fig. 4 Experimental data (points) compared to the analytical model (lines) for a constant diffusion coef-ficient for samples with a thickness of l = 3 mm
This shows the possibility of other factors in play for the diffusion in L direction, such as the presence of extractives, which has been known to be very abundant in Dalbergia wood, with a strong presence in lumens (Donnelly et al. 1975; Gérard et al. 2017; Yin et al. 2018), and their role in moisture transfer in wood has been shown, mostly because of their water solubility properties (Choong 1969; Chen and Choong 1994). Furthermore, it has been found that extractives lower the dynamic sorption process and hygroscopicity of wood (Yang et al. 2018).
Swelling–shrinkage
The strain evolution was correlated with the moisture content variation, and the swelling–shrinkage coefficients were thus determined (Fig. 6). Swelling–shrinkage coefficients equal to 0.32 ± 0.05 in T direction ( 𝛾T ) and 0.20 ± 0.03 in R direction ( 𝛾R ) were obtained. In L direction, unfortunately, the dimensional changes were too small to be accurately measured. Efforts in future studies should be directed toward determining a feasible method to measure it with a limited amount of wood.
To compare the present results to a previous study, which also implemented the calculation method in accordance with the DIN 52184 standard (Eqs. 19 and 20), we have calculated the volumetric swelling coefficient 𝛤V from an oven-dry initial
condition toward h = 0.85 . We took the adsorption–desorption parameters obtained (Table 5) and calculated the final moisture content ( Wf ) value as 0.122. Thus,
obtain-ing 𝛤R(W = 0.122) = 0.024 and 𝛤T(W = 0.122) = 0.038 , we found 𝛤V = 0.062 for
this condition. This value is still within the range of the 𝛤V found by the previous
study, which is 5.17 ± 1.44% (Sproßmann et al. 2017). Moreover, Liu et al. (2020) have measured the swelling rate in the R and T directions (Eq. 20) following the ISO 13061-15 and ISO 13061-16 standards and they obtained 𝛤R= 0.028 , 𝛤T = 0.032 and 𝛤V = 0.064 , for a density of 1360(100) kg/m3 , very close to the values obtained
Fig. 5 Relationships between the diffusion coefficient and wood density; data taken from published studies and the aver-age values of the grenadilla wood from the present study
Table
6
P
ar
ame
ters and (mean) coefficients of diffusion de
ter mined using t he t hr ee models, cons tant ( D0 , Eq. 11 ), linear ( p ,b ,D lin , Eq. 15 ) and e xponential ( k ,D e , Eq. 16 ) and t heir r espectiv e er rors Dir ection D0 (× 1 0 − 7cm 2∕ s) p (× 1 0 − 7cm 2∕ s) b (× 1 0 − 7cm 2∕ s) Dlin (× 1 0 − 7cm 2∕ s) k De (× 1 0 − 7cm 2∕ s) sse ( × 1 0 − 6) R 2 .0 4 ± 0 .7 3 – – – – – 1 .26 ± 1 .0 0 – 2 .2 1 ± 0 .1 2 1 .9 1 ± 0 .76 2.08 – – 1 .20 ± 1 .0 3 2.04 – – – 0 .4 0 ± 0 .26 2.11 1 .21 ± 1 .0 3 T 1 .5 4 ± 0 .4 9 – – – – – 1 .77 ± 0 .9 1 – 2 .3 0 ± 0 .2 2 1 .3 5 ± 0 .52 1.54 – – 1 .74 ± 0 .9 1 1.54 – – – 0 .2 8 ± 0 .09 1.57 1 .76 ± 0 .9 1 L 4 .5 8 ± 0 .8 4 – – – – – 0 .6 3 ± 0 .3 4 – 2 .2 8 ± 0 .1 0 4 .6 2 ± 1 .0 6 4.79 – – 0 .5 1 ± 0 .3 0 4.58 – – – 0 .7 4 ± 0 .42 4.86 0 .5 1 ± 0 .2 9
Table
7
Published diffusion coefficients of v
ar
ious w
ood species and t
heir density used in F
ig. 5 W ood species 𝜌 (k g /cm 3) DL (× 1 0 − 7)( cm 2∕ s) DR (× 1 0 − 7)( cm 2∕ s) DT (× 1 0 − 7)( cm 2∕ s) Sour ce Cor ymbia maculat a 970 6.00 1.00 1.00 Redman e t al. ( 2012 ) Eucal yp tus pilular is 900 23.00 3.00 2.00 Redman e t al. ( 2012 ) Eucal yp tus mar ginat a 820 27.00 3.00 4.00 Redman e t al. ( 2012 ) Eucal yp tus obliq ua 780 103.00 7.00 4.00 Redman e t al. ( 2012 ) Pinus pinas ter 450 1430.00 43.00 29.00 Agoua and P er re ( 2010 ) Picea abies 370 1960.00 16.00 13.00 Agoua and P er re ( 2010 ) Fagus sy lv atica 752 75.00 15.00 3.90 Olek e t al. ( 2005 ) Pinus sy lv es tr is 550 81.10 12.70 11.90 Olek e t al. ( 2005 ) Tect ona g randis 700 400.00 28.00 17.00 Agoua and P er re ( 2010 ) E. cy lindr icum 640 – 7.90 7.90 Simo-Tagne e t al. ( 2016b ) St er culia r hinope tala 840 – 6.20 6.20 Simo-Tagne e t al. ( 2016b ) Tr iploc hit on spp. 380 – 96.30 96.30 Simo-Tagne e t al. ( 2016b ) Ter minalia superba 540 – 47.00 47.00 Simo-Tagne e t al. ( 2016b ) Dalber gia melano xy lon 1 2 5 0 .0 ± 2 6 .2 4 .5 8 ± 0 .84 2 .0 4 ± 0 .7 3 1 .5 4 ± 0 .49 Pr esent s tudy
here. Finally, the total shrinkage in the R and T directions reported in Gérard et al. (2017), 𝛤R(WS) = 0.029 and 𝛤T(Ws) = 0.048 , agree with the present values too as
𝛤R(Ws) = 𝛾RWs= 0.035 and 𝛤T(Ws) = 𝛾TWs= 0.055.
Mechanical properties Stiffness matrix
According to the designation made for the wave propagation directions (L = 1, R = 2, T = 3, 4 = RT, 5 = LT, 6 = LR), theoretically, the expected values of the matrix components are C11>C22>C33 for the longitudinal wave type, C44<C55<C66 for the shear wave type and C12>C13>C23 for the non-diagonal terms. The measured values fulfilled these conditions (Table 8).
For each sample, the compliance matrix [S] was determined by inverting the stiff-ness matrix [C] obtained through velocity measurements, and so, the Young’s and shear moduli of each sample were obtained. Then, the Poisson’s ratios ( vij ) were
determined from the non-diagonal components of the [S] matrix. Note that they are usually defined as the negative ratio of the transverse (passive) strain 𝜖jj divided by
the axial (active) strain 𝜖ii during a tensile test in the axial direction i.
Comparison with past studies
The limited amount of literature studying the whole Young’s and shear moduli of grenadilla wood makes it a challenge for us to compare the present results to past studies, especially for moduli in R and T directions and shear moduli. Nevertheless, a few publications allowed some comparison.
For the Young’s modulus in the L direction ( EL ), first the present results were compared to the values obtained by Guitard and El Amri (1987)’s empirical model for 𝜌 = 1250 kg/m3 (Tables 9 and 10). As we can see, the mean value of E
L is much lower than theirs. Although a critical point should be stated here, which is the fact
Fig. 6 Evolution of strains caused by the changes in moisture content. Points refer to experimental data, bold lines in the middle to model and the thin lines to standard deviation
that Guitard and El Amri (1987) only used four values of data for wood with the density above 900 kg/m3—thus lowering their applicability to our wood—and their empirical model only gives an order of magnitude of the expected values as they only take the density into account and no other factors such as the microfibril angle or the cell wall chemistry. However, other studies based on quasi-static bending of grenadilla wood samples have also found EL higher than ours. Sproßmann et al. (2017), for example, measured EL= 17.4(24) Gpa for a density of 1270(400) kg/m3 . Gérard et al. (2017) found EL values to be 20.25 Gpa for 𝜌 = 1290 kg/m3 , while Chudnoff (1984) obtained 2.98 × 10⁶ Psi ( ≈ 20.55 GPa ) for 𝜌 = 1080 kg/m3 and Liu et al. (2020) 17.9(10) GPa for a density of 1360(100) kg/m3 . Although one study by Obataya and Yamauchi (2012), where they measured the natural frequency in bend-ing and torsion of a beam, has found a value similar to ours ( 15.90 GPa for EL with 𝜌= 1282 kg/m3 , measured at W = 0.062 , h = 0.60 , T = 25◦C ), and even though the values from those other studies are clearly much closer to ours than to those of Gui-tard and El Amri (1987), the fact still remains that our EL values tend to fall on the lower part of their range.
There are several possible explanations for this. The first is that the present wood samples could perhaps possess angled grain despite efforts to choose and use only samples having the appearance of straight grains and orientations. Other than that, it is also possible that the present wood possesses a high microfibril angle (MFA), which has been known to decrease the elastic modulus of wood in the L direction and to increase the elastic moduli in the transverse directions (Cave and Walker
1994; Astley et al. 1998; Hein et al. 2013). Another possibility is that the grenadilla
Table 8 Stiffness matrix components ( Cij ) in GPa with L = 1, R = 2, T = 3, 4 = RT, 5 = LT, 6 = LR
Terms C11 C22 C33 C44 C55 C66 C12 C13 C23
𝜇 21.92 7.51 6.16 1.80 2.65 3.17 5.74 5.57 3.42
±𝛿 ±3.63 ±0.39 ±0.31 ±0.04 ±0.15 ±0.22 ±0.98 ±1.13 ±0.27
Table 9 Young’s ( Ei ) and shear
( Gij ) moduli in GPa, compared
to the empirical model of
Guitard and El Amri (1987)
Moduli EL ER ET GLR GLT GRT 𝜇 15.56 5.10 4.05 3.19 2.62 1.77 ±𝛿 ±1.79 ±0.46 ±0.35 ±0.21 ±0.19 ±0.02 Guitard and El Amri (1987) 28.2 4.23 3.21 2.66 2.21 1.14
Table 10 Poisson’s ratios ( vij ),
compared to the empirical model of Guitard and El Amri
(1987) Ratios vLR vLT vRL vRT vTL vTR 𝜇 0.41 0.51 0.17 0.42 0.16 0.31 ±𝛿 ±0.12 ±0.13 ±0.05 ±0.10 ±0.02 ±0.06 Guitard and El Amri (1987) 0.42 0.44 0.06 0.63 0.05 0.48
could display a biased apparent density. The concept of density in solid material is usually defined as the ratio between the mass and volume of the sample. Thus, through simple gravimetric measurement, the density of grenadilla wood is 𝜌 = 1250.0± 26.2 kg/m3 . However, if we are talking from a mechanical point of view, the only mass that matters is the one coming from the structural part of the wood. In this case, it should be the cell walls. At the same time, grenadilla has been known to possess high level of extractives, which is a non-structural part of the wood but still contribute to its mass (Donnelly et al. 1975; Sjostrom 1993). Yin et al. (2018), specifically, have conducted a thorough study regarding the extractives of grenadilla wood and found that the extractive percentage could reach up to 16.05% from extrac-tions using a mixture of benzene/ethanol alone. This value could be considered high compared to subtropical wood, but in fact quite normal for this tropical wood, which could possess extractive content up to between 20 and 25% (Jankowska et al. 2016), a significant part of which is located in the lumens. This could explain the low value obtained for EL , because there is a possibility that, if we remove all the extractives, the remaining density of the grenadilla (which would consist solely of the mass of the cells) could be significantly lower than 1250 kg/m3 . Finally, there is the possibil-ity of the presence of defects inside the sample, which unfortunately could not be detected before the experiment without using extensive tomography examinations.
For the shear modulus in LR direction ( GLR ), we found the range of our result (Table 9) to be higher than that of a previous study (Sproßmann et al. 2017), but our result for GLT is in agreement with the value obtained by Obataya and Yamauchi (2012) of 2.73 GPa. Moreover, the comparison with the predicted value from Guitard and El Amri (1987), in Table 9, shows that the present values are all higher than those predicted. Even if the effect of MFA on shear moduli is not that well documented in the literature, a past study has shown that a higher MFA could apparently lead to higher shear moduli, especially GTL , GRL and also slightly GRT (Bader et al. 2012). Thus, again, the present results, and those of Obataya and Yamauchi (2012), seem to be in agreement with a higher MFA.
Finally, no data exist on the Poisson’s ratios and we can only compare them with the rough predictions from Guitard and El Amri (1987) as given in Table 10. It seems that the present results are all in the same order of magnitude. Unfor-tunately, as said above, the limitations of the empirical model of Guitard and El Amri (1987) and the low number of past studies regarding this wood species limit our ability to make a direct comparison.
Because of those reasons, we believed that future efforts should be directed toward conducting other mechanical characterizations using different methods, either nondestructive using, for example, well-known tools based on free beam vibrations (Brancheriau and Baillères 2002; Brémaud 2012) or on natural frequen-cies of a cubic sample (Longo et al. 2018) or even classical destructive methods. Further, other factors that affect the mechanical stiffness of wood, such as anatomi-cal features (MFA, rays, etc.) and extractives, must be determined. Thus, future efforts should also be directed toward determining the effects of those other proper-ties on the mechanical characteristics of grenadilla.
Conclusion
The hygromechanical properties of grenadilla, including adsorption–desorption hys-teresis model—with its unique set of parameters for both full and partial cycles— diffusion coefficients at T = 20◦C , swelling–shrinkage coefficients and all the elas-tic moduli, together with all Poisson’s ratios, were determined in this study. It was found that grenadilla possesses moisture diffusion coefficients that fit quite well to the relationship model between wood density and coefficient of diffusion of other wood species obtained by past studies. However, the diffusion rate in the longitu-dinal direction seems to be significantly lower than the extrapolated one based on density, which could be explained by the presence of extractives that dampen the diffusion. Different dependencies of these diffusion coefficients on moisture content were tested, and although the differences were not significant, the best dependence was the linear relationship (where a higher moisture content leads to a higher dif-fusion coefficient). Furthermore, the swelling–shrinkage coefficients obtained also correspond to other published data on the same wood species. Similar results have been obtained with the mechanical properties for the longitudinal modulus, even if the present result is one of the lowest compared to the literature. Since we measure in addition here all the other elastic constants, all moduli suggest that the tendency would be to have a larger microfibril angle in the present case. Future works should then be directed toward four primary points: (a) comparing the obtained ultrasonic measurements with other nondestructive methods, such as free beam vibration or resonant ultrasound spectroscopy, (b) measuring the anatomical (mainly microfibril angle) and chemical (mainly extractive content and cellulose crystallinity) charac-teristics of this wood, (c) studying the effect of these characcharac-teristics, particularly its extractives, on its hygromechanical properties and (d) using the obtained coefficients of diffusion for predicting the moisture transport phenomena in grenadilla during two- or three-dimensional diffusion.
Acknowledgements This research is a result of cooperation between the Laboratoire de Mécanique et Génie Civil (CNRS, Université de Montpellier), ANRT and Henri SELMER Paris under the working scheme of Ph.D. CIFRE, on which the first author was currently working during the time of the writing of this paper. Special acknowledgments are directed toward Michel Millon and Christophe Gallois from Henri SELMER Paris, Gille Camp from LMGC, Stéphane Fourtier from UMR AMAP CIRAD and Dan-iel Guibal from UMR BioWooEB CIRAD for their technical support.
Compliance with ethical standards
Conflict of interest The authors declare that they have no conflict of interest during the course of this study.
References
Agoua E, Perre P (2010) Mass transfer in wood: identification of structural parameters from diffusivity
and permeability measurements. J Porous Med 13(11):1017–1024. https ://doi.org/10.1615/JPorM
Ashman RB, Cowin SC, Van Buskirk WC, Rice JC (1984) A continuous wave technique for the
measurement of the elastic properties of cortical bone. J Biomech 17(5):349–361. https ://doi.
org/10.1016/0021-9290(84)90029 -0
Astley RJ, Stol KA, Harrington JJ (1998) Modelling the elastic properties of softwood. Holz Roh- Werkst
56(1):43–50. https ://doi.org/10.1007/s0010 70050 262
Bachtiar EV, Sanabria SJ, Mittig JP, Niemz P (2017) Moisture-dependent elastic characteristics of walnut and cherry wood by means of mechanical and ultrasonic test incorporating three different
ultra-sound data evaluation techniques. Wood Sci Technol 51(1):47–67. https ://doi.org/10.1007/s0022
6-016-0851-z
Bader TK, Hofstetter K, Eberhardsteiner J, Keunecke D (2012) Microstructure-stiffness
relation-ships of common yew and Norway spruce. Strain 48(4):306–316. https ://doi.org/10.111
1/j.1475-1305.2011.00824 .x
Ball SMJ (2004) Stocks and exploitation of East African blackwood (Dalbergia melanoxylon): a flagship
species for Tanzania’s miombo woodlands? Oryx 38(3):266–272. https ://doi.org/10.1017/S0030
60530 40004 93
Berry SL, Roderick ML (2005) Plant-water relations and the fibre saturation point. New Phytol 168(1):25–37
Brancheriau L, Baillères H (2002) Natural vibration analysis of clear wooden beams: a theoretical review. Wood Sci Technol 36(4):347–365
Brillouin L (2013) Wave propagation and group velocity. Academic Press, Cambridge
Brémaud I (2012) Acoustical properties of wood in string instruments soundboards and tuned idiophones:
biological and cultural diversity. J Acoust Soc Am 131(1):807–818. https ://doi.org/10.1121/1.36512
33
Bucur V (2006) Acoustics of wood. Springer, Berlin
Bucur V, Archer RR (1984) Elastic constants for wood by an ultrasonic method. Wood Sci Technol
18(4):255–265. https ://doi.org/10.1007/BF003 53361
Camara VC, Laux D, Arnould O (2010) Enhanced multiple ultrasonic shear reflection method for the
determination of high frequency viscoelastic properties. Ultrasonics 50(7):710–715. https ://doi.
org/10.1016/j.ultra s.2010.02.007
Carmeliet J, De Wit M, Janssen H (2005) Hysteresis and moisture buffering of wood. In: Symposium of building physics in the nordic countries, Citeseer, pp 55–62
Cave ID, Walker JCF (1994) Stiffness of wood in fast-grown plantation softwoods: the influence of microfibril angle. For Prod J 44(5):43
Cegla FB, Cawley P, Allin J, Davies J (2011) High-temperature ( > 500◦C ) wall thickness monitoring
using dry-coupled ultrasonic waveguide transducers. IEEE Trans Ultrason Ferroelectr Freq Control
58(1):156–167. https ://doi.org/10.1109/TUFFC .2011.1782
Chave J, Coomes D, Jansen S, Lewis SL, Swenson NG, Zanne AE (2009) Towards a worldwide wood
economics spectrum. Ecol Lett 12(4):351–366. https ://doi.org/10.1111/j.1461-0248.2009.01285 .x
Chen Y, Choong ET (1994) Determining the effect of extractives on moisture movement using a “con-tinuous” measuring system. Wood Fiber Sci 26(3):390–396
Choong ET (1969) Effect of extractives on shrinkage and other hygroscopic properties of ten southern pine woods. Wood Fiber Sci 1(2):124–133
Chudnoff M (1984) Tropical timbers of the world. U.S. Department of Agriculture, Forest Service, Washington
Crank J (1979) The mathematics of diffusion, 2nd edn. Oxford Science Publications, Oxford University Press, Oxford (oCLC: 554098354)
Détienne P (1990) Les bois exotiques anciens d’ébénisterie et leur identification (Ancient exotic woods of cabinet-making and their identification). BOIS & FORETS DES TROPIQUES 223:69–76
Donnelly DM, O’Reilly J, Whalley WB (1975) Neoflavanoids of Dalbergia melanoxylon. Phytochemistry 14(10):2287–2290
Eitelberger J, Hofstetter K (2010) Multiscale homogenization of wood transport properties: diffusion
coefficients for steady-state moisture transport. Wood Mater Sci Eng 5(2):97–103. https ://doi.
org/10.1080/17480 272.2010.48965 0
Fernández FG, Esteban LG, de Palacios P, Simón C, García-Iruela A, de la Fuente J (2014) Sorption and thermodynamic properties of Terminalia superba Engl. & Diels and Triplochiton scleroxylon K.
Schum. through the 15, 35 and 50◦ C sorption isotherms. Eur J Wood Prod 72(1):99–106. https ://doi.
François M, Geymonat G, Berthaud Y (1998) Determination of the symmetries of an experimentally determined stiffness tensor: application to acoustic measurements. Int J Solids Struct 35(31):4091–
4106. https ://doi.org/10.1016/S0020 -7683(97)00303 -X
Glass SV, Zelinka SL (2010) Moisture relations and physical properties of wood. Wood handbook: wood as an engineering material: chapter 4 Centennial ed General technical report FPL; GTR-190 Madison, WI: US Dept of Agriculture, Forest Service, Forest Products Laboratory, 2010: p 41-419 190:4–1
Gonçalves R, Trinca AJ, Pellis BP (2014) Elastic constants of wood determined by ultrasound using
three geometries of specimens. Wood Sci Technol 48(2):269–287. https ://doi.org/10.1007/s0022
6-013-0598-8
Guitard D, El Amri F (1987) Modèles prévisionnels de comportement élastique tridimensionnel pour les bois feuillus et les bois résineux (Predictive models of three-dimensional elastic behaviour for
hard-woods and softhard-woods). Ann For Sci 44(3):335–358. https ://doi.org/10.1051/fores t:19870 305
Gérard J, Guibal D, Paradis S, Cerre JC (2017) Tropical Timber Atlas: Technological characteristics and uses. éditions Quæ, Versailles (oCLC: 1022786485)
Hailwood A, Horrobin S (1946) Absorption of water by polymers: analysis in terms of a simple model. T Faraday Soc 42:B084–B092
Hassold S, Ii PPL, Bauert MR, Razafintsalama A, Ramamonjisoa L, Widmer A (2016) DNA barcoding of malagasy rosewoods: towards a molecular identification of CITES-listed Dalbergia species. PLoS
ONE 11(6):e0157881. https ://doi.org/10.1371/journ al.pone.01578 81
Hein PRG, Silva JRM, Brancheriau L (2013) Correlations among microfibril angle, density, modulus of elasticity, modulus of rupture and shrinkage in 6-year-old Eucalyptus urophylla × E. grandis.
Maderas Ciencia y tecnología 15(2):171–182. https ://doi.org/10.4067/S0718 -221X2 01300 50000 14
Hillis WE (1971) Distribution, properties and formation of some wood extractives. Wood Sci Technol
5(4):272–289. https ://doi.org/10.1007/BF003 65060
Innes J (2010) Madagascar rosewood, illegal logging and the tropical timber trade. Madagascar Conserv
Dev. https ://doi.org/10.4314/mcd.v5i1.57335
IUCN (1998) Dalbergia melanoxylon: World Conservation Monitoring Centre: The IUCN Red List of Threatened Species 1998: e.T32504a9710439. Tech. rep., International Union for Conservation of
Nature. https ://doi.org/10.2305/IUCN.UK.1998.RLTS.T3250 4A971 0439.en, type: dataset
Jankowska A, Drożdżek M, Sarnowski P, Horodeński J (2016) Effect of extractives on the equilibrium moisture content and shrinkage of selected tropical wood species. BioResources 12(1):597–607.
https ://doi.org/10.15376 /biore s.12.1.597-607
Jannot Y, Kanmogne A, Talla A, Monkam L (2006) Experimental determination and modelling of water desorption isotherms of tropical woods: afzelia, ebony, iroko, moabi and obeche. Holz Roh Werkst
64(2):121–124. https ://doi.org/10.1007/s0010 7-005-0051-2
Kohlhauser C, Hellmich C, Vitale-Brovarone C, Boccaccini AR, Rota A, Eberhardsteiner J (2009)
Ultra-sonic characterisation of porous biomaterials across different frequencies. Strain 45(1):34–44. https
://doi.org/10.1111/j.1475-1305.2008.00417 .x
Kulasinski K (2015) Physical and mechanical aspects of moisture adsorption in wood biopolymers inves-tigated with atomistic simulations. Ph.D. thesis, ETH Zurich
Lancaster C, Espinoza E (2012) Analysis of select Dalbergia and trade timber using direct analysis in real time and time-of-flight mass spectrometry for CITES enforcement. Rapid Commun Mass Spectrom
26(9):1147–1156. https ://doi.org/10.1002/rcm.6215
Liu M, Peng L, Lyu S, Lyu J (2020) Properties of common tropical hardwoods for fretboard of string instruments. J Wood Sci 66(1):1–11
Longo R, Laux D, Pagano S, Delaunay T, Le Clézio E, Arnould O (2018) Elastic characterization of wood by resonant ultrasound spectroscopy (rus): a comprehensive study. Wood Sci Technol 52:383–
402. https ://doi.org/10.1007/s0022 6-017-0980-z
Lowe AJ, Dormontt EE, Bowie MJ, Degen B, Gardner S, Thomas D, Clarke C, Rimbawanto A, Wieden-hoeft A, Yin Y, Sasaki N (2016) Opportunities for improved transparency in the timber trade
through scientific verification. BioScience 66(11):990–998. https ://doi.org/10.1093/biosc i/biw12 9
Malimbwi RE, Luoga EJ, Hofstad O, Mugasha AG, Valen JS (2000) Prevalence and standing vol-ume of Dalbergia melanoxylon in coastal and inland sites of southern Tanzania. J Trop For Sci 12(2):336–347
Maroulis Z, Tsami E, Marinos-Kouris D, Saravacos G (1988) Application of the GAB model to the mois-ture sorption isotherms for dried fruits. J Food Eng 7(1):63–78