Publisher’s version / Version de l'éditeur:
Vous avez des questions? Nous pouvons vous aider. Pour communiquer directement avec un auteur, consultez la première page de la revue dans laquelle son article a été publié afin de trouver ses coordonnées. Si vous n’arrivez pas à les repérer, communiquez avec nous à PublicationsArchive-ArchivesPublications@nrc-cnrc.gc.ca.
Questions? Contact the NRC Publications Archive team at
PublicationsArchive-ArchivesPublications@nrc-cnrc.gc.ca. If you wish to email the authors directly, please see the first page of the publication for their contact information.
https://publications-cnrc.canada.ca/fra/droits
L’accès à ce site Web et l’utilisation de son contenu sont assujettis aux conditions présentées dans le site LISEZ CES CONDITIONS ATTENTIVEMENT AVANT D’UTILISER CE SITE WEB.
Cold Regions Science and Technology, 9, 1, pp. 17-27, 1984-06
READ THESE TERMS AND CONDITIONS CAREFULLY BEFORE USING THIS WEBSITE. https://nrc-publications.canada.ca/eng/copyright
NRC Publications Archive Record / Notice des Archives des publications du CNRC :
https://nrc-publications.canada.ca/eng/view/object/?id=630d117e-4912-4c49-b8e6-2b9aab8bf95a
https://publications-cnrc.canada.ca/fra/voir/objet/?id=630d117e-4912-4c49-b8e6-2b9aab8bf95a
NRC Publications Archive
Archives des publications du CNRC
This publication could be one of several versions: author’s original, accepted manuscript or the publisher’s version. / La version de cette publication peut être l’une des suivantes : la version prépublication de l’auteur, la version acceptée du manuscrit ou la version de l’éditeur.
For the publisher’s version, please access the DOI link below./ Pour consulter la version de l’éditeur, utilisez le lien DOI ci-dessous.
https://doi.org/10.1016/0165-232X(84)90044-2
Access and use of this website and the material on it are subject to the Terms and Conditions set forth at
An investigation of the failure envelope of
granular/discontinuous-columnar sea ice
cold Regions Science and Technology, 9 (1984) p. 17
-
27DBR Paper No. 121 1
Division of Building Research
t
I
Price $1 .OO OTTAWA NRCC 2 3 3 ~ s
Canads
4 a u h
1/70
 SUM^ L ' e n v e l o p p e t r i d i m e n s i o n n e l l e d e r u p t u r e d e l a g l a c e c o l u m n a i r e d i s c o n t i n u e / g r a n u l a i r e a f a i t l ' o b j e t d ' 6 t u d e s a u moyen d ' e s s a i s d e c o m p r e s s i o n a v e c ' e t r e i n t e l a t ' e r a l e , d a n s un i n t e r v a l l e d e v i t e s s e s d e d 6 f o r m a t i o n n o m i n a l e a l l a n t d e 9 x s-' 2 4 , 4 x s-l. On a m e s u r s 3 l a f o i s l a c h a r g e appliqu'ee e t l V 6 t r e i n t e la t ' e r a l e . k s e s s a i s o n t 6 t L e f f e c t u ' e s s u r d e s L c h a n t i l l o n s d ' e c o u p 5 ~ d a n s un b l o c d e g l a c e s o l i d e p r o v e n a n t d e l a mer d e B e a u f o r t ; c e t t e g l a c e e t a i t d e s t r u c t u r e g r a n u l a i r e e t c o n t e n a i t q u e l q u e s b a n d e s d e g l a c e c o l u m n a i r e d i s c o n t i n u e j u s q u ' l 1 , 2 m d e p r o f o n d e u r . Les r ' e s u l t a t s i n d i q u e n t l a c o n f i g u r a t i o n e t l a d i m e n s i o n g'en'erales d e l ' e n v e l o p p e d e r u p t u r e d e c e t t e g l a c e , e t d S m o n t r e n t qile mSme s i l a c o n f i g u r a t i o n n e dLpend p a s d e l a v i t e s s e d ' a p p l i c a t i o n d e l a c h a r g e , l a d i m e n s i o n augmente e n f o n c t i o n d e c e t t e v i t e s s e d ' a p p l i c a t i o n . On e n d f d u i t u n e e x p r e s s i o n a n a l y t i q u e , q u i d ' e c r i t d e f q o n m a t h b a t i q u e l ' e n v e l o p p e d e r u p t u r e d a n s un e s p a c e t r i d i m e n s i o n n e l . - -
-
- - - 4 - - -I
Cold Regions Science and Technology, 9 (1984) 17 -27
Elsevier Science Publishers B.V., Amsterdam - Printed in The Netherlands
AN INVESTIGATION OF THE FAILURE ENVELOPE OF GRANULARIDISCONTINUOUS- COLUMNAR SEA ICE
G.W. Timco
Hydraulics Laboratory, Division of Mechanical Engineering, National Research Council of Canada, Ottawa, Ontario (Canada)
and R.M.W. Frederking
Geotechnical Section, Division of Building Research, National Research Council of Canada, Ottawa, Ontario (Canada) (Received October 2 4 , 1983; accepted in revised form November 2 9 , 1 9 8 3 )
ABSTRACT
The three-dimensional failure envelope for
granular/discontinuous-columnar sea ice has been investigated over a range of nominal strain rates from 9 X 1 0-6 s-I to 4.4 X s-I by using confined compression tests. Both the applied load and side- confining load were measured. The tests were per- formed on samples cut from a solid block of ice in the Beaufort Sea which structurally was granular with some banding of discontinuous-columnar ice to a depth of 1.2 m. The results indicate the overall shape and size of the failure envelope of this ice, and show that although the shape is independent of loading rate, the size increases with loading rate. An analytical expression is derived which mathe- matically describes the failure envelope in three- dimensional space.
INTRODUCTION
When an ice sheet interacts with a structure, the mechanical properties of the ice play an impor- tant role in defining both the total load and local ice pressures on the structure. In most cases, the stress field in the ice is very complex and the re- sponse of the ice cannot be described uniquely by its uni-axial stress properties. Because of this, in- formation is required on the behaviour of ice under complex stress states. Consider, for example, a small
element of ice in an ice sheet which is being driven against some structure. Because of the interaction, the element of ice will experience a stress and, as such, will try to deform. If the ice element was free from the surrounding ice, the behaviour of the ice could be described by its response to a uni-axial stress field. However, in the ice sheet the ice element is surrounded by an ice matrix which is also trying t o deform in response to the stress. Because of this, the ice element is in a confined state with side loads which are generated internally within the ice and which are superimposed onto the main stress field. In order to try to understand and analyze this situa- tion, it is necessary to know the mechanical behav- iour of ice under these types of confined, bi-axial and tri-axial stress states. This behaviour is usually described in terms of the failure envelope for the material (Paul, 1968). This is a description of the stress levels at which the ice yields for any com- bination of compressive or tensile stress states. The determination of the failure envelope of granular/ discontinuous-columnar sea ice is important since this structure of ice is usually found in the colder upper part of an ice sheet where high stress levels may occur. In this paper, an experimental investiga- tion of the failure envelope for granular/discon- tinuous-columnar sea ice is described, and the results of the tests are used to outline the yield surface in three-dimensional space over a range of
loading rates. Finally, the mathematical formula- tion of plasticity theory is used to describe analytical- ly the failure envelope, and the case of plane-stress in the plane of the ice cover is calculated and com- pared to the corresponding failure envelope for columnar sea ice and both granular and columnar freshwater ice at the same strain rate and tempera- ture.
EXPERIMENTAL
This test series was carried out during a field trip to the Beaufort Sea in early May, 1983. The ice was cut from a large piece of ice 6 m X 6 m X 1.3 m thick which had rafted approximately 100 m from the south-east corner of Tarsiut Island in the Canadian Beaufort Sea. Six 0.5-m-long by 0.3-m-wide by 0.3-m-thick blocks of ice were cut with a chain saw in a pattern of two blocks across by three blocks deep. Each block was identified and put into a plastic bag and cardboard box and flown in a helicopter to Tuktoyaktuk. There, the blocks were cut into 19 cm X 5 cm X 5 cm samples using a band saw. The long surfaces of the samples were made flat and smooth using a power planer. The ice samples were stored in a small refrigerated, cold room where the tests were performed. Due to a malfunction in the refriger- ation system, the temperature of the cold room could not be accurately controlled or held constant. Con- sequently, the test temperature was - 1 3 ' ~ k 2 ' ~ .
A salinity profile of the ice was measured and in- dicated an average value of 4.2
+
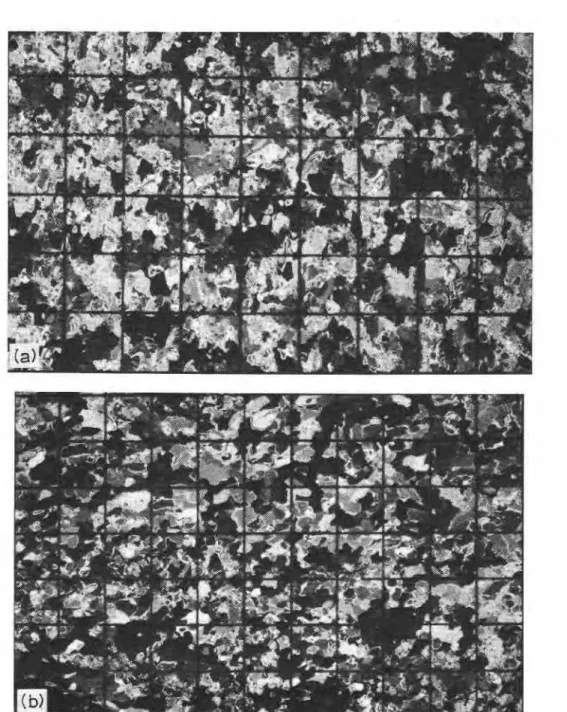
0 . 5 ~ / ~ , independent of depth. This corresponds to an average brine volume of 19°/m. During storage of the samples, there was no indication of any brine drainage from the samples.A series of vertical and horizontal thin sections were made from the ice using the "hot-plate" tech- nique. The structure of the ice was markedly differ- ent from the usually observed structure of upper granular ice changing to columnar ice with depth. Throughout the full 1.2 m thickness of this ice, there was no columnar ice present. The ice was granular with only an occasional thin band of 2-3 cm thickness of discontinuous columnar ice* (Fig. 1). This structure of granular ice throughout such a large ice thickness is quite surprising and the explanation
for it is not known. The orientation of the discon- tinuous-columnar bands as well as the overall shape and size of the large ice block from which it was cut, strongly indicates that the ice block had not been rotated from its growth position in the ice sheet; i.e. it had not turned over on its side. More- over, the ice did not appear to have formed by layering of rafted thinner ice sheets. The ice cover appeared to have been formed by a continual growth of granular ice. Based on the theory of crystal growth from impure melts (see e.g. Tiller et al., 1953) the stable growth phase for sea ice is columnar. The persistence of granular ice suggests that there was either frazil ice constantly being generated in the region where the ice grew, or a disturbance of some sort at the growth interface which caused continual nucleation of new ice crystals. This ice clearly demon- strates the variability in ice structure which can be found in the Beaufort Sea, and emphasizes the need to examine the structure of the ice for any mechani- cal property test.
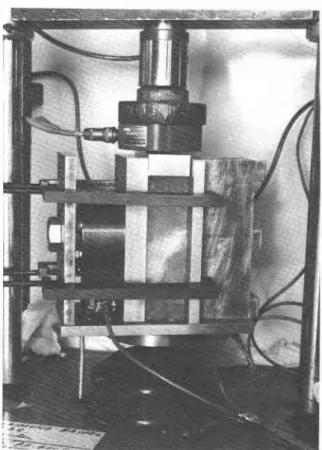
The tests were performed using a 0.06 MN capaci- ty Tri-Test 50 compression tester. For this press, the frame stiffness and loading system stiffness were measured using the approach described by Frederking and Timco (1983a) to be 150 and 8 0 MN m-', respec- tively. In order to create bi-axial stress states, a specially built aluminum sub-press was used (see
Fig. 2). For confinement conditions, the ice piece I
was put between the two confining walls which were firmly retained with an initial pressure of 0.1 MPa using 4 C-clamps. Both the applied load and side- confining load were measured using two different load cells. The output from the load cells were fed into a two channel strip-chart recorder. From the load-time curves, the strengths and stresses were determined as the load divided by the initial cross- sectional area of the sample.
For this ice, which was isotropic in the plane of
the ice cover, but not isotropic perpendicular to it q
because of the bands of discontinuous-columnar ice, five different loading configurations were used.
1
*In granular ice, the shape and size of the individual grains are more-or-less isotropic. For discontinuous columnar ice, the ice consists of numerous short, distinct ice crystals with a length to width ratio of approximately 2-3, and widths generally the same size as the neighbouring granular ice.
Fig. 1. Photograph of thin sections between crossed-polaroids showing (a) vertical and (b) horizontal grain structure at a depth of 75 cm. This granular ice was present through the full 1.2 m depth except for occasional thin bands of discontinuous-columnar ice. The grid is 1 cm on a side.
These are shown schematically in Fig. 3 as: the ice was transverse isotropic, these two are equiv- I
Type A: Both loading and confinement in the d e n t in this case.
plane of the ice cover. This measures the confined Type B: Loading in the plane of the ice cover strength in the x-direction and side-loading in the with confinement in the horizontal plane. This y-direction, or alternatively the strength in the y- measures the confined strength in either the x or y direction and side-loading in the x-direction. Since direction and the side-loading in the z-direction.
RESULTS
Fig. 2. Photograph showing an ice piece sandwiched between the confining plates in the sub-press. Note the two load cells which measure the applied and confining loads.
Type C: Loading in the plane of the ice cover with no confinement. This test measures the uni- axial compressive strength in either the
x
or y direc- tion.Type D: Both loading and confinement parallel to the direction of growth of the ice cover. This measures the confined strength in the z-direction and the side loading in either the
x
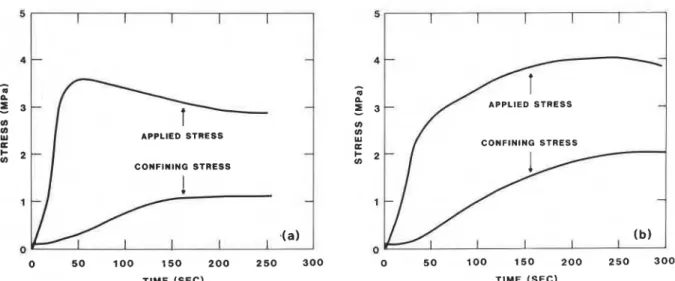
or y direction. Type E: Loading in the direction of growth of the ice with no confinement. This measures the uni-axial compressive strength in the z-direction. The test series was run over a nominal strain-rate range of 9 X s-' to 4.4 X s-', although the majority of tests were run at 2.1 X s-'. In total, 118 ice samples were tested.Typical load-time curves for both the applied and side-loads are shown in Fig. 4. This figure il- lustrates the two different load histories which were observed during the confined tests: Strain-softening (Fig. 4(a)) and strain-hardening (Fig. 4(b)). The majority of tests (92%) exhibited the strain-softening behaviour, and only A-type confinement produced strain hardening. Previous, confined compression tests by the authors (Timco and Frederking, 1983) on isotropic, granular ice and highly anisotropic columnar ice have shown this strain-softening for granular ice. For columnar ice, on the other hand for A-type loading, strain-hardening is observed. The mixed behaviour exhibited by this ice indicates that it was not isotropic and shows that even the thin bands of discontinuous-columnar ice which were present significantly influenced the stress load- ing history of the ice. For the case of strain softening, the side load increased very slowly with increasing applied load such that, at yield, it was always only a small percentage (=lo%) of the applied load. With increasing time after yield, the applied load de- creased but the side load increased. For the samples exhibiting strain-hardening behaviour, the side load increased at a higher rate such that, at yield, it was typically 50% of the applied load. With increasing time after yield, both the applied load and side load decreased. Knowing both loads for any loading con- figuration, it is possible to plot them as yield points in a two-dimensional plane (the third principal stress is zero). These, then, define the outline of the failure surface of the material. Using the reference system of Fig. 3, the points on the failure envelope are shown in Fig. S(a) for the 0,-oy plane (i.e. the plane of the ice cover) and in Fig. S(b) for the ox-oz (or
oy -a,)
plane (i.e. perpendicular to the plane of the ice cover) for a loading rate ofIn
= 2 X s-'.Included on these figures are examples of typical
.
stress-paths as derived from Fig. 4. It is clear fromthese figures that the stress path to yield is relatively close to the principal axis, except in the case of
I
strain-hardening. This is a reflection of the relatively
J
soft sub-press which was used to create the confine-tl
APPLIED STRESS CONFINING STRESS 4-
-
APPLIED S T R E S S-
CONFINING S T R E S S-
TIME (SEC) TIME (SEC)
Fig. 4. Load-time curves showing behaviour for (a) strain-softening and (b) strain-hardening for A-type confinement at in =
2 x 1 0 - ~ S - l .
Fig. 5 . Test results showing points on the failure envelope in the (a) x-y plane and (b) x-z or y-z plane at E', = 2 X s-' and T = -13°C.
6, (MPa)
-5 - 4 - 3 - 2 - 1
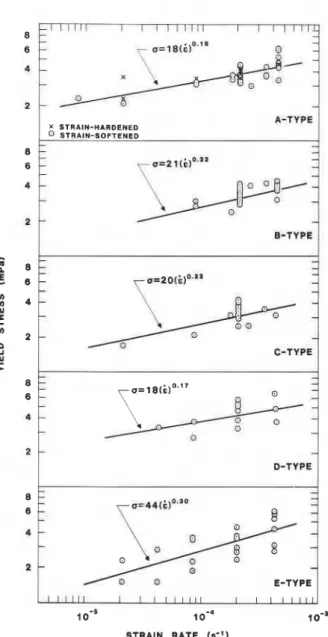
ment in this test series. The two parts of Fig. 5, loading configuration over a range of loading rates. when combined, show the three-dimensional failure The yield stress (i.e. strength) for each loading con- envelope of granular/discontinuous-columnar sea ice figuration is shown as a function of nominal strain in the compression-compression-compression oc- rate in Fig. 6. The results show that for both un- tant at a nominal strain rate of 2 X s-'. confined and confined strengths, the strength in- To look at the strain rate effect on the failure creases with loading rate. The results were fit to a envelope, a number of tests were performed for each power law of the form a = where o is the
- 1 - 1 1 I
I
- - 1 6, or by ( M P a )I
- 5 - 4 - 3 - 2 - 1 \ \ \ 1 \ \ \ \ IMPa) \ \ \ \ \ -4 \ \ '4 S T R E S S PATH FOR ( M P a ) X S T R A I N - H A R D E N E D 0 S T R A I N - S O F T E N E D-
-5 -'6 (a)D-TYPE
1
8
I 1 l I l l 1 1 1 1 1 1 1 1 1 I 1 1 1 1 1 1 1 1 oms 1 0-4 1 0-a
STRAIN RATE ( s - ' 1
Fig. 6. Strength versus nominal strain rate for each of the five
confinement conditions at T = -13°C.
x STRAIN-HARDENED A-TYPE
STRAIN-SOFTENED
-
- -
...
strenght in MPa,
Zn
is the nominal strain rate in s-' and A and rn are empirical coefficients determined c for each set of data. The resulting coefficients A andrn are tabulated in Table 1 and the regression lines for each type of loading configuration are plotted
r
in Fig. 6. On average, there was no distinct difference between the confined (types A, B, D) and unconfined (types C, E) test results. Although it would be expect- ed that the confined strength should be somewhat higher that the unconfined strength (Hill, 1950), the present data does not show this trend. These
TABLE 1
Empirical coefficients for strength-strain rate relationship
o = A (Cn)rn Confinement A m Type
-
A 18 0.18 Type-
B 21 0.22 Type-
C 20 0.22 Type-
D 18 0.17 Type-
E 44 0.30test results indicate that in the range of strain rates investigated, the overall shape of the failure envelope does not change, but its size does such that it in- creases with strain rate with a functional form of the type
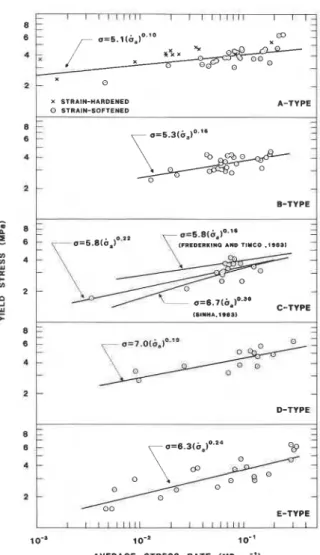
The results were also interpreted in terms of average stress-rate to failure, i.e. stress rate ba = o/tf where o is the yield stress and tf is the time to failure. For each loading configuration the results were fit to a power law of the form o = B where o is the strength in MPa, 6, is the average stress rate in MPa s-l, and B and n are empirical coefficients. These results are tabulated in Table 2 and shown in Fig. 7. Similar to the strain-rate effect, there was no distinct difference between the confined and un- confined strengths. The functional dependence of strength on stress rate is in good agreement with previous test results on unconfined granular sea ice measured with a different compression machine by Frederking and Timco (1983a) and on frazil sea ice by Sinha (1983b) (Fig. 7(c)). A plot of strength versus time to yield showed a general trend of de- creasing time to yield with increasing strength, verifying the satisfactory performance of the present test machine (Sinha, 1983a).
TABLE 2
Empirical coefficients for strength-stress rate relationship
o = ~ ( 6 , ) ~ Confinement B n Type
-
A 5.1 0.10 Type-
B 5.3 0.16 Type-
C 5.8 0.22 Type-
D 7 .O 0.19 Type-
E 6.3 0.2410- lo-* l o - ' AVERAGE STRESS RATE (MPa-S-'1
Fig. 7 . Strength versus average shess rate for each of the five confinement conditions at T = 1 3 O C .
APPLICATION OF RESULTS
The results of these confined compression tests can be used to help evaluate the types of yield func- tions which are most suitable for describing ice strengths and in determining the appropriate values of the yield function coefficients. Ralston and Reinicke (Reinicke and Ralston, 1977; Ralston, 1978, 1980) have discussed the use of confined compression tests for selecting appropriate yield functions from plasticity theory. This theory provides a means of theoretically predicting the ice crushing loads in a dynamic ice-structure interaction. Initially,
this theory was developed to describe the deforma- tion and failure of metal, soils and rocks and has recently been applied to ice problems. For this theoretical analysis, the size and shape of the failure envelope of sea ice must be known. The following discussion follows Ralston (1978), and the reader is referred to it for full details.
In brief, yield functions for elastic-perfectly plastic materials are usually presented in the form
where fluij) is some algebraic combination of stress components o i j For f<O, the stress state is elastic, whereas for f=O, the material is at yield (i.e. in the plastic state). Ralston has shown that an n-type yield function of the following form appears to be par- ticularly useful for describing the plastic behaviour of anisotropic ice in terms of the normal stresses (0) and shear stresses (7)
2 fluij) = a l (ay - 0,)'
+
a2 (o, - ox)2 + a3 (ox - oy)This function can describe materials with different compressive and tensile strengths and predicts a parabolic increase in strength with increasing con- fining pressure. Applying this expression to granular/ discontinuous-columnar sea ice which is isotropic in the horizontal plane, a l = az, a 4 = a5, a 7 = as, a6 = 2 (al
+
2a3) and eqn. (2) becomeswhere a6 = 2(al
+
2a3). The values of the coefficients a], a3, a4, a 7 and a 9 can be determined from the present test results. In order to do this, five equa- tions are required to solve for the five unknown coefficients.From the uni-axial (unconfined) compressive strength in the horizontal plane (i.e. C-type) ox = a,
-
and oy = oz = rxy
-
ryZ = rxZ = 0 and at yield flu) =0. Thus eqn. (3) becomes
I
o, = -3.0 MPa at
Cn
= 2 X 1 0-4 s-'. Mote that the sign convention which is used is that compressiveI
I stresses are negative.
From the uni-axial (unconfined) compressive
strength in the vertical direction (i.e. E-type), ox =
-
-
-
oy
-
rxy - rXz-
ryz = 0 and a, = UE and at yieldflu) = 0. Thus eqn. (3) becomes
Using the regression curve for the E-type test results,
UE = -3.4 MPa at
gn
= 2 X s-'.For the A-type test, the upper and lower faces
-
of the sample are stress free and a, = rxy
-
rx, = 0.Choosing
x
and y as the principal stress directions,rxy = 0 and eqn. (3) becomes
Using the values for the samples which exhibited strain-hardening, this gives the point on the yield
surface in the compression-compression quadrant
in the horizontal plane where the normal to the yield surface is parallel to one of the stress co-or-
dinate axes. Thus, at yield ox = -4.0 MPa and oy =
-2.0 MPa (or alternatively oy = -4.0 MPa and ox =
-2.0 MPa) at , I!, = 2 X s-'.
To generate the fourth and fifth equations, the results from samples which showed strain-softening
for either the A, B, or D-type confinement could
be used. All of these, however, are close to the prin- cipal axis values used to generate the first two equa- tions. Thus, the experimental results from these confinement conditions should be well represented by the results of the C and E-type tests in this analysis. Because the present approach is essentially a curve-fitting through experimental points, it is better to make use of data points which are well separated on the failure envelope in order to get the most reliable description of it. Therefore, to make use of values in quadrants other than com-
I pression-compression, the results of a series of
shear tests will be used to generate the fourth and fifth equations. These tests were performed in con- junction with the present tests on the same ice using a newly-developed shear apparatus. The results for comparable loading rate and temperature average 0.55 MPa independent of loading direction (Freder- king and Timco, 1983b). It should be noted that in contrast to the compression tests which produced
ductile failures of the ice, the shear tests produced brittle failure. Using this result, for shear in the
-
horizontal plane ax = uy = a, = rxz
-
ryZ = 0 andT~~ = 0 and T~~ = 0.55 MPa and eqn. (5) becomes
In a like manner, since the shear strength was
-
independent of loading direction, ox = oy
-
o, =-
rxZ
-
rXy = 0 and ry, = 0.55 MPa giving2
U4Tyz - 1 = O . (8)
Thus, in this case a 4 = 4.
Solving eqns. (4)-(8) using the experimentally
determined strength values of the ice gives a 1 = 1.2
M P ~ - ~ ; a3 = 0.2 M P ~ - ~ ; a 4 = 3.2 M P ~ - ~ ; a7 = 3.9
M P ~ - ' and a 9 = 7.7 M P ~ - ' and the appropriate yield
function can be obtained from eqn. (3).
In applying these results using plasticity theory, a large number of problems can be numerically analyzed. For several problems, the case of plane stress in the plane of the ice sheet is required. Ralston has shown that the yield function for the stress con- dition in the plane of the ice sheet is an elliptical function given by
flu) = a l ( o i
+
0;)+
a3(ox - uy)2+
a 6 r i y+
a7(ox+
oy) - 1 (9)which, for rxy = 0 reduces to
flu) = 1.2(0;
+
a;)+
0.2(ox - uy)2+
3.9(ux+
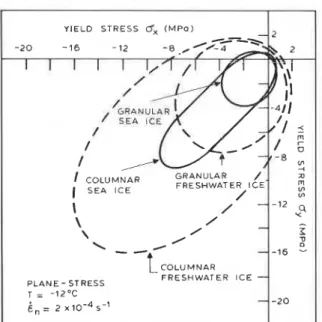
oy)-1(10) from this analysis. This yield function envelope is shown in Fig. 8 . Included in this figure are the corre- sponding plane stress ellipses for columnar sea ice (Timco and Frederking, 1983) and both granular and columnar freshwater ice (Frederking, 1977) at the same strain rate and temperature. Comparing these curves, it is apparent that both the brine in the ice and the structure of the ice have a major influence on the size and shape of the failure envelope of ice. Sea ice in nature usually consists of both granular and columnar ice with a brine volume gradient throughout its thickness. Consequently these must be considered in arriving at a failure envelope which represents the full ice thickness (that is, on a large scale). This can be done by some type of "mixing" of these failure envelopes determined using small
YIELD STRESS 6. ( M P o ) - 2 0 - 1 6 -12 1 1 1 1 I I 1 COLUMNAR ~ ~ ~ ~ ~ ~ ~ E R ( S E A I C E / VI I
,
-
-12 9 \ /-
-
\ / I / 0'-
-
-16 2-
-L
co,uMNna P L A N E - STRESS FRESHWATER I C E-
T = -12°C in= 2 XIO-4s-l-
- 2 0Fig. 8. Yield envelopes for plane-stress conditions in the plane of the ice cover for granular/discontinuous columnar sea ice, columnar sea ice, and granular and columnar fresh- water ice at T = -12OC and i = 2 X lo-' s-'. This figure
shows the pronounced influence of the brine in the ice and the grain structure of the ice on the failure envelope of ice.
scale tests, or by performing large scale confined compression tests in the field. The latter would be quite expensive, but it would give the more reliable result. A knowledge of this large-scale failure envelope is important since it would indicate the maximum stress levels which the ice can sustain, and it could be used in both analytical and physical modelling to increase the reliability of these tech- niques for predicting ice loads on structures.
co2umnar ice where stress levels up to four times the uni-axial compressive strength were generated due to A-type confinement (Timco and Frederking, 1983).
(2) The load-time curves for a mix of granular/ discontinuous-columnar ice show strain-softening in most cases such that the side load due to the con- finement is a relatively small percentage of the applied load. For ice with distinct columnar bands however, strain-hardening may be observed. This results in only slightly higher strength values, but appreciably higher side-load levels.
(3) The functional dependence of the strength versus either the nominal strain rate or average stress rate is not appreciably affected by the con- finement condition, and in both cases follows a power law of the form a = A ( G ~ ) ~ . ~ ~ and a =
~ ( t r , ) ~ . ' ~ .
(4) The three-dimensional shape of the yield sur- face does not change with loading rate over the range of loading rates investigated; its size, however, increases with both increasing strain-rate and stress- rate.
(5) The structure of the ice consisting solely of a 1.2-m-thick sheet of a mix of granular and discon- tinuous-columnar ice with no trace of columnar ice illustrates that such non-conventional ice struc- tures can exist in the dynamic areas of the Beaufort sea.
(6) The results of the tests can be used to evaluate coefficients of an n-type yield function which can be used with plasticity theory to numerically analyze various ice-structure interaction scenarios.
ACKNOWLEDGEMENTS CONCLUSIONS
The results of the present tests indicate the general behaviour and stress levels of granular/discontinuous- columnar sea ice under confined conditions. The test results indicate:
(1) The confinement condition does not appre- ciably increase the stress level at which the ice will fail. This is in contrast to confined conditions of
The authors would like to thank Gulf Canada Resources Inc. for the opportunity to perform these experiments. The logistics, transportation and accom- modation support provided made this test program possible. This paper is a joint contribution of the Divisions of Mechanical Engineering and Building Research, and is published with the approval of the Directors of the Divisions.
'
REFERENCESFrederking, R. (1977), Plane-strain compressive strength of columnar-grained and granular snow-ice, J. Glaciol. 18: (80) 505-516.
Frederking, R. and Timco, G.W. (1983a), Uniaxial com- pressive strength and deformation of Beaufort Sea ice, Proc. 7th Int. Conf. Port and Ocean Eng. under Arctic Condition, Proc. POAC 83, Vol. I, pp. 89-98, Tech Research Centre of Finland, Helsinki, Finland.
Frederking, R. and Timco, G.W. (1983b), Measurement
- of shear strength of granular/discontinuous columnar sea ice, Cold Regions Science and Technology, accepted for publication.
Hill, R. (1950), The Mathematical Theory of Plasticity, Oxford University Press, London.
Paul, B. (1968), Macroscopic criteria for plastic flow and brittle failure. In Fracture: An Advanced Treatise, H. Liebowitz (ed.), Vol. 11, pp. 313-496, Academic Press, New York.
Ralston, T.D. (1978), An analysis of ice sheet indentation. In Proc. IAHR Symp on Ice Problems, Vol I, pp. 15-31, Lulea, Sweden.
Ralston, T.D. (1980), Yield and plastic deformation in ice crushing failure. In Sea Ice Processes and Models, R.S. Pritchard (ed.), pp. 234-245, University of Seattle Press, Seattle, U.S.A.
Reinicke, K.M. and Ralston, T.D. (1977), Plastic limit analysis with an anisotropic, parabolic yield function, Int. J. Rock Mech., Mining Sci. and Geomech. Abstracts 14, pp. 147-154.
Sinha, N.K. (1983a), Field tests 1 of compressive strength of first year sea ice, Ann. Glac. 4: 253-259.
Sinha, N.K. (1983b), Uniaxial compressive strength of first year and multi-year sea ice. In Proc. 6th Can. Hydrotechn. Conf., Vol. I, pp. 501-522, Ottawa, Canada.
Tiller, W.A., Jackson, K.A., Rutter, J.W. and Chalmers, B.
(1953), The distribution of solute atoms during the solidification of metals, Acta. Met. I: 428-437.
Timco, G.W. and Frederking, R. (1983), Confined compres- sive strength of sea ice. In Proc. 7th Int. Conf. Port and Ocean Eng. under Arctic Condition, Proc. POAC 83, Vol. I, pp. 243-253, Technical Research Centre of Finland, Helsinki, Finland.
T h i s p a p e r , w h i l e b e i n g d i s t r i b u t e d i n r e p r i n t form by t h e D i v i s i o n of B u i l d i n g R e s e a r c h , remains t h e c o p y r i g h t of t h e o r i g i n a l p u b l i s h e r . It s h o u l d n o t be reproduced i n whole o r i n p a r t w i t h o u t t h e p e r m i s s i o n of t h e p u b l i s h e r . A l i s t of a l l p u b l i c a t i o n s a v a i l a b l e from t h e D i v i s i o n may be o b t a i n e d by w r i t i n g t o t h e P u b l i c a t i o n s S e c t i o n , D i v i s i o n of B u i l d i n g R e s e a r c h , N a t i o n a l R e s e a r c h C o u n c i l of C a n a d a , O t t a w a , O n t a r i o , K1A 0R6.