RECIRCULATING FLUME EMPLOYING 40 MICRON SILT WITH SPECIAL REFERENCE TO
TURBIDITY CURRENT DEPOSITIONAL STRUCTURES
by
Hugh H. Sprunt, Jr.
Submitted in Partial Fulfillment of the Requirements for the
Degree of Master of Science
at the
Massachusetts Institute of Technology
May 1972
Signature of Author 0 0 .
Department of Earth and Planetary Sciences, May 12, 1972
Certified by . . . .
-- 4'//
/1
'/l .- Thesis SupervisorAccepted by T- 0 . 0 0 0 0
Chairman, Departmental Committee on Graduate Students
RECIRCULATING FLUME EMPLOYING 40 MICRON SILT WITH SPECIAL REFERENCE TO
TURBIDITY CURRENT DEPOSITIONAL STRUCTURES by
Hugh H. Sprunt, Jr.
Submitted in partial fulfillment of the requirements for the degree of Master of Science at the Massachusetts Institute of Technology, May, 1972
ABSTRACT
A series of bed aggradation experiments were carried out in a small flume that recirculated both water and sediment. Of two silt fractions separated from mid-continental loess,
the coarser was found to be more suitable. Dry sediment was fed into the tailbox of the flume at various aggradation rates and flow velocities, and the structures formed are described.
These structures are compared to the structures found in a series of field samples of distal turbidites gathered from the Silurian of northern Maine.
The experiments indicate that the lower the ripple-range velocity, the more distinct the internal structures are. A more rapid aggradation rate at a given velocity produces less distinct structures. In the ripple-range reducing the mean flow velocity increases the spacing of the equilibrium crests. An increase in the aggradation rate also produces an increase in ripple spacing. The height of the ripples does not change
significantly with a change in the mean flow velocity. The influence of aggradation rate on ripple height is unclear; variable results were obtained.
Increasing the aggradation rate increases the size and general dominance of trough structures formed in the ripple-range of velocities. Decreasing the mean flow velocity at a given aggradation rate tends to eliminate the trough structures and favor the formation of planar structures whose linear projections on the flume sidewall are called "basal traces" in this paper.
The Bouma Model is used to interpret the laboratory results and the field samples. Bouma B, 0, and D Intervals were produced in the laboratory. The limited similarity between the laboratory results and the field samples is described.
The turbidity current hypothesis and relevant experi-mental work is described, and the difficulties encountered in the simulation of turbidity currents in the laboratory are commented upon. Recommendations for future work are also included.
Thesis Supervisor: Dr. John B. Southard Title: Assistant Professor of Geology
TABLE OF CONTENTS
Abstract . . . . . . . .1
Table of Contents . . . . . . . . . . . . .iv
List of Tables. . . . . . . . . . . . . . v
List of Figures . . . . . . . . . . . . . v
List of Variables and Constants . . . . . .vi
Equations . . . . . . . . . . . . . . . . .vi
Introduction. . . . ... . . . .1
Description of Experimental Apparatus . . .13
Experimental Procedure. . . . . . . . . . .16
Finer Silt Calibration Runs . . . . . . . .20
Coarser Silt Calibration Runs . . . . . . .24
Run 1 . . . . .27 Run 2 . . . .32 Run 3 . . . . .37 Run 4 . . . .40 Run 5 . . . . .43 Concluding Remarks. . . . . . . . . . . . .48
Appendix I, Documentation Data. . . . . . .57
Appendix II, Sediment Description . . . . .58
Appendix III, Sample Descriptions . . . . .59
Tables and Figures. . . . . . . . . . . . .65
Bibliography. . . . . . .87
Photographs of Experimental Runs. . . . . .94
Photographs of Field Samples. . . . . . . .147
List of' Tables Number 1 .
2.
3.
4. 5.6.
7. 8.9.
10. 11. 12. 13. Title Bed Porosity . . . . . . Finer Silt Calibration Run 1 . . Finer Silt Calibration Run 2 . . Finer Silt Calibration Run 3 . . Dynamic Viscosity Of Water as F(Temp) . . . . .0darser Silt Calibration Run 1. .. Coarser Silt Calibration Run 2. . . . . . . Experimental Run 1. . . . . . . . .Experimental Run 2. . . . . . . . . . 0 . Experimental Run 3. . . . . . Experimental Run 4. . . . . . Experimental Run 5. . . . .
Summary Of Experimental Runs . .
List of Figures
Title Page
Finer Silt Suspended Concentration Versus Time. .67 Finer Silt Concentration Versus Velocity. . . .71
. Dynamic Viscosity Of Water As F(Temp) . . . .72 . Coarser Silt Concentration Versus Time. . . .75
.Coarser Silt Concentration Versus Velocity . . .77
. . Run 1 Velocity Versus Time. . . . . 79 Run 1 Concentration Versus Velocity . . . . .80
. . . Run 5 Velocity Versus Time . . . . . . .85
Page . . . .66 . . . .68 . . . .69 . . . .70 . . . .73 . . . .75 . . . .76 . . . .78 . . . .81 . . . .82 . . . .83 .84 .86 Number 1. . 2. . 3. . 4. .
5. .
6. . 7. . 8.Units Description degrees C inches cc/sec cc/sec cc/sec mm/hr cm gm/cc cjt/sec cm/sec cm/sec cm/sec hr-min-s en cm cm
Temperature of the flow
Manometer Height Differential Flow Rate in Flume
Flow Rate of Dry, Unpacked Sed. Pore Water Flow Rate
Rate of Bed Aggradation Average Flow Depth
Average Concentration, sed. in H20
Average Surface Velocity Average Velocity (two ways)
Reduction Profile, Planned Vel. Reduction Profile, Actual Vel. Time, relative to a given point A Constant = Flume Width = 17.4 cm A Const. = Bed Length = 550 cm
Equations Employed:
Y
= Q/Yw , V derived V = Q/wY ,Y
derivedfrom V = 0.857s
from bed and water surface profiles D = O82QS/wL , 0.82 from packing co-efficient of sediment Q = 0.06 FHi" cu 'ft/sec = 17007&H cc/sec
Symbol
VA Time
In this paper I describe and then discuss the results of a series of experiments in bed aggradation specifically related to an attempt to simulate the bed aggradation
structures common in distal turbidites. A comparison is made between the structures found in some Silurian turbidity deposits from northern Maine and the experimental results. The difficulties involved in simulating a turbidity current in the laboratory are described and sections on the history of field and laboratory investigations are also included. At the end of the paper there are sections on experimental
error, conclusions, and recommendations for future work.
The Turbidity Current Hypothesis
Engineers have long known of density currents flowing along the bottoms of dam reservoirs carrying river sediment for miles; typically they are arrested only by the dam
itself. Oceanographers, especially since World War II, have begun to map cold and warm currents in the ocean, often at depth, that preserve their identities for hundreds of miles. Indeed, one of the most recent objectives, combining the skills of the oceanographer and the civil engineer, has been the analytical and experimental study of saline wedges
associated with tidal bores in river-estuary complexes and the thermal currents in rivers produced by outflow of open-circuit cooling water from commercial nuclear power plants. All of these phenomena, turbidity currents included, may be
termed density currents. The driving force is supplied
by the gravitational field acting upon the mass differential of the flow with respect to the ambient fluid; the distin-guishing characteristic is the cause of the density excess, be it a difference in temperature or salinity or the presence of sediment suspended by the turbulence and change in
gravitational potential of the flow.
The turbidity current is unique due to the potential for inter-particle collision effects and the fact that at some point in its lifespan the turbidity current must deposit the particulate source of its density excess:
the suspended sediment. The bed load may also be considered a part of the current, but recent experimental work (Kuenen, 1970) points to a lack of a traction carpet.
The suspended sediment 'rains out' of the flow as the turbulent energy and the velocity decrease (due to a lessening of the bottom gradient as the current moves down the continental slope, onto the continental rise, and finally out onto the abyssal plain) leaving a geologic record of the hydraulic conditions of the depositing flow. To the extent the relevant sedimentary structures can be linked to the characteristics of the sediment and the flow, one can better understand the dynamics of these large currents which, although acting in a highly discontinuous fashion,
have deposited thousands of feet of sediment at the base of the continental slope.
the professional literature since the 1940's and 1950's with early studies and theorizing by Knapp and Bell (1941), Phleger (1951), Natland and Kuenen (1951), Menard and
Ludwick (1951), and Kuenen (1950, 1952, 1953a, 1953b). The turbidity current hypothesis was developed to explain the presence of continental-derived sediments far out onto the abyssal plains as well as the occurrence at depth of shallow water foraminifera, plant fragments, and other continental shelf debris such as molluscs, halimeda,
echinoid spines, and so forth. In some cases the postulated current is capable of transporting coarse sands and conglom-erates a good distance (Natland and Kuenen, 1951). The
existence of submarine leveed channels at the base of the continental slope was not known to be a consequence of turbidity current action in 1951, but no one could think of a better explanation (Menard and Ludwick, 1951; Gorsline and Emery, 1959).
There is a long history in the literature of detailed descriptions of deposits felt to be turbidites as well as hypothesizing concerning the currents themselves. By the middle 1960's turbidity currents had come to be related to submarine canyons, and the question arose as to whether the currents had actually eroded the canyons or merely served as the agent which kept them remarkably clean of unconsol-idated sediment (Shepard, 1951 and 1965).
(Enos, 1969a and 1969b; Bassett and Walton, 1960; Ballance, 1964; Allen, 1960; and van Houten, 1964) in addition to a large number of papers concerned with developing an appro-priate terminology for turbidites and their related features
(Crowell, 1958; Hsu, 1959; Kelling and Walton, 1957,and 1961; Kuenen, 1957; McKee, 1953 and 1957; Carozzi, 1957; Sanders, 1960; Rich, 1950; Allen, 1960; and Parkash, 1970). These papers have considered tool marks, flute casts, groove casts, flame structures, load casts, sole markings, convolute lamin-ations, sludge casts, stratification, cross-stratification, horizontal grading, and the like.
The origin usually proposed for a turbidity current
is an earthquake-triggered slump of sufficient size to become fully turbulent and adequately diluted to be a true turbidity current. This dilution takes place through turbulent inter-action at the flow interface by the breaking of internal waves. The term fluxo-turbidite was employed for a while
to indicate the proximal section of a turbidite (closest to the source), but some have proposed that this term be aban-doned (Walker, 1967; Dzulynski et al., 1959). Other terms referring to the proximal section such as grain flow and
inertia flow are falling into disuse (Stauffer, 1967; but see alto Middleton, 1970). At least the nearest portions of the proximal section are thought to be some sort of
pseudo-laminar flow, a transition from a disintegrating slump block to a fflly developed turbidity current.
There have been objections to the turbidity current hypothesis from the beginning, and although acceptance of
the idea is wide today, there are some recent detractors (Hsu, 1960 and 1964; Van der Lingen, 1969 and 1970; Hubert, 1966 and 1967). The usual argument is that a combination of high-angle faulting of flysch basins and waning oceanic bottom currents are responsible for the turbidites (see also
Conolly & Ewing, 1969; Kuenen, 1970). Some have pointed out that bottom currents of the required velocities are known to exist, and that they are able to sort the available sediments. Sometimes, proposed turbidity current deposits have both
parallel and interference ripples. Also, a vertical section claimed to be simply 'derived from a single turbidity current sometimes is thinly interbedded with shale members. Recently, bird tracks indicating a shallow water origin have been
discovered in what is supposedly a turbidite (Van der Lingen, 1969).
A commonly proposed difficulty with the turbidity current hypothesis is that various indicators of the direction of flow are sometimes at right angles to the primary bottom gradient. Proponents of turbidity currents have explained this discrep-ancy three ways: proposing a three-dimensional flow in the head region of the current which could generate a crisscross-ing of tool marks (Allen, 1971; Prentice, 1960); by the fact that a flow is not always parallel to the steepest gradient present (as in the case of water flowing down a channel with steeply inclined sides) (Potter & Pettijohn, 1963;
certainslump folds indicating a paleoslope perpendicular to the turbidity current path can be explained by ephemeral tectonic activity (Walker, 1970).
An added difficulty is generated by some confusion regarding the terms 'flysch' and 'greywacke' in which
turbidity current features often, but not exclusively (Wilson, 1969) occur (Dzulynski & Walton, 1965; Pettijohn, 1960;
Boswell, 1960).
The modern interpretation of turbidity current deposi-tion generally takes the form of the "Bouma Interval" popu-larized by Bouma (1962, 1964), but first proposed by
Signorini in 1936 (Bouma, 1964, p. 256). The Bouma Interval is described as follows (in order of deposition):
A. Lowest Interval: sand, commonly graded, no lamination, gravel and pebbles sometimes present.
B. Interval of Parallel Lamination: a coarse some-times faint parallel lamination in gradational contact with the A Interval.
C. Rippled Interval: ripples less than 5 cm high and 20 cm long with foreset
lamination; ripples are some-times convolute with usually a sharp contact with the B Inter-val below.
D. Interval of Parallel Lamination: usually fine sand to silty pelite; a sharp lower contact with sand content possibly decreasing upwards. E. Pelitic Interval: no visible sedimentary
struc-tures, lime content may increase upwards; a very gradual contact with the D Interval below.
upward from A through E. Some horizontal variation is indicated (Bouma, 1962; Enos, 1969a). Bouma found no
corelation between the direction of flow and the particles' long axes.
Although five intervals are listed above, one or more can be omitted in a given field sequence, but in the over-whelming majority of cases an interval is not skipped in a
manner that would result in disordering. For example, 1) A-B-C-D-E is a possibility as is 2) C-D-E-A-B or
3) A-B-A-B-C, but intervals such as A-B-D-C-A are quite
rare, even if one has two turbidity currents relatively close to each other in time with the later current doing a small amount of eroding. As the turbidity current moves away from the continent, first the A Interval is not deposited, then
the B, and so on until, far out on the abyssal plain, only the D interval and the pelagic E interval are deposited.
Walker (1970) has found that of 16,000 measured
turbidite deposits less than J of 1% differ from the Bouma model, and then the divergence usually consists of a minor
reversal such as that in 3) above. One possible explanation for these minor reversals that the author has not seen else-where is the dependent triggering of a second turbidity
current several hours after another, smaller, one. Since the larger current is hydraulically more efficient, it would override the slower smaller one which might still be depos-iting on a continental rise or abyssal plain thus causing
occasion a slump triggered by an external source would itself trigger a second slump on the edge of the continental shelf. Some authors contend that many turbidity currents originate on the lower continental slope and on the continental rise (Conolly and Iwing, 1969). It would be interesting to discover whether or not the reversals occur primarily in
turbidite intervals that are associated with currents origin-ating near the edge of the continental shelf where the likli-hood of a first slump triggering a second seems higher.
Walker (1965) modified the Bouma Interval to seven intervals, essentially adding more detail rather than changing anything basic:
1. Graded, unlaminated interval
2. Lower interval of parallel lamination 3. Clear bed-current interface forms caused
by a laminar boundary layer
4. Part of the lower parallel laminated inter-val re-worked into ripples
$. Ripples which cease moving at less than cri'tical shear
6. Upper interval of parallel lamination, silt and some mud
7. Suspended mud settles out, followed by continuous oceanic sedimentation
Walker also notes that in all probability that the current is graded during its passage vertically and horizontally with the finer fractions being to the rear and further from the sea bottom. Simons' and Richardson's upper and lower flow regimes do not seem to rule out either Bouma's or Walker's Intervals.
lack of dunal structure in turbidites. Allen (1968, 1970) has written that when the power of a flow is reduced one usually gets some dunes. Walker (quoted by Allen, 1970) felt that there simply was not enough time in the dune field for them to form. Allen agreed with this and also
added that for a typical turbidity current size distribution, the range of the dune field is quite small (see also,
Southard, 1970). Roy in his investigation of the Silurian of northern Maine employed a Markov Chain to investigate the Bouma Model and found that the D Interval was the weakest part of the model (Roy, 1970).
The Turbidity Current Proper
The turbidity current begins as some sort of slump either on the edge of the continental shelf or further down in the lower reaches of the continental slope or upper part of the continental rise. Recently it has been proposed
(Allen, 1971) that the head of the slump becomes the head of the turbidity current through a process of oppositely rotating longitudinal vortices; ambient fluid mixes with the head through 'tunnels' situated on the frontal surface, lowering the density of the slump head by introduction of the surrourding sewater, thus transforming the slump into a nascent turbidity current. Once developed, the turbidity
The argument is made that a pure slump could not be respon-sible for turbidites generally since many tens of miles can be covered on a slope of about 1 part in a 1000. (as in the case of the famous Grand Banks Earthquake turbidity current which destroyed a series of telegraph cables, the furthest
from the origin being destroyed last).
One promising suggestion which has not yet been inves-tigated in the field (Van der Lingen, 1969) is to examine the slump produced by the 1964 Alaska earthquake to determine whether or not a turbidity current was generated. Such an
earthquake should have produced a, turbidity current provided there was a sufficient supply of sediment accumulated on the edge of the shelf.
As the turbidity current moves down the slope and out onto the continental rise its grain size decreases (Gorsline & Emery, 1959; & many other papers). In addition the amount of sediment deposited decreased with distance away from the shelf. Enos (1969b) has found a decrease of approximately 7% per kilometet-in the distal sections of the Oloridorme
formation while tracing individual beds for 7.5 km. He also notes that small pre-existing bottom irregularities can
cause a large variation in bed thickness and grain size.
There is some ponding of turbidity currents as the transition from continental rise to abyssal plain occurs (Belderson & Laughton, 1966). Enos finds evidence for some erosional processes caused by the passing current. Both Enos and
considerable meandering or sinuosity in the course of a turbidity current, especially in the distal region.
Several authors have written that there is a hydraulic
jump
at the base of the continental slope causing a decreaseof about 50 in the current velocity, a height increase, and a reduction in density from 5-15% depending on the initi.l assumption structure (Brush, 1969; Middleton, 1970; Komar, 1971). However, only the coarsest fraction of the load is dropped at the
jump;
the competency of the current remains high. Once the Froude number is less than one, there islittle mixing at the fluid interface (Middleton, 1966). Studies in the Atlantic have shown that a lateral extent of
65 km is abbtevdd.
It can be seen from the above that these currents are efficient transporting agents for large amounts of sediment. At least one author (Kuenen, 1971) has theorized that thin, dilute currents could not accomplish this and has proposed a density in excess of 1.16 gm/cc and noted that a current whose height from field evidence is at least a hundred meters
can be sustained for two thousand kilometers on a sloping surface of 1/10% grade. He proposes a nose density of 1.1-1.2 gm/cc in an earlier paper (1966).
More recently, mathematical treatments by other authors have indicated that the 1/10% slope is the minimum that can
sustain a turbidity current, even if it is composed entirely of clay-sized particles, and that a density as high as that
proposed by Kuenen is not necessary (Bye, 1971; Komar, 1970). In addition, the 1/10% slope corresponds nicely to the slope of the continental rise, giving indirect evidence that
turbidity currents are slowly building a shallow wedge out
onto the abyssal plains (Bye, 1971; Belderson & Laughton, 1966). The concept of autosuspension as related to turbidity
currents has been a part of the professional literature for
some time (Bagnold, 1962; Knapp, 1938; Dzulynski & Walton, 1965). The autosuspension hypothesis results in a turbidity current
that is not concentration-limited under certain circumstances. If the downward net movement of the current as a whole
exceeds that of the settling velocity of the particle (the
'hindered' settling discussed by Knapp in which other particles in the flow hinder the settling of the given particle must be considered) then the particles themselves contribute energy to the flow as opposed to requiring the expenditure of
turbulent energy for their own support. In short, where the slope angle is a few degrees or less and
9
can be approximated by sinO , the autosuspension conditions are met whenwhere w is the hindered settling velocity, 1is the slope angle, and u is the velocity of the current (see also,
Johnson, 1966; Briggs & Middleton, 1965). Bagnold gives a typical upper limit for autosuspension as 50 microns. Johnson gives 75 to 1500 microns, but he assumes higher velocities and a greater slope angle.
DESCRIPTION OF EXPERIMENTAL APPARATUS
The experiments were carried out in a small flume
that reciculates both water and sediment. The inside width is 17.4 cm, the channel length is 550 cm, and the height of the channel is 33 cm. The headbox is approximately 45 cm long and the tailbox about 30 cm in length. The transparent walls of the flume were constructed of 3/8" Plexiglas. Large steel I-beams provide support. The flume is tiltable by means of two jacks approximately 2/3 the distance downstream from the headbox. Two round steel rails are mounted on the steel bracing along the top of the flume walls and aligned parallel to the flume bottom to within t 0.01 cm. A small carriage with metal wheels is mounted on these rails to provide a convenient location for the point gage. The carriage can be clamped or allowed to move freely along the length of the flume.
A baffle consisting of close-packed lengths of stiff plastic tubing with an inside diameter of 0.7 cm and a length of 30 cm was placed between the headbox and the channel to reduce the entrance turbulence making the flow more nearly uniform. In addition, a small board 17.3 cm wide and 25 cm long, adjustable in position, was placed in contact with the water surface immediately downstream of the headbox baffle.
Typically, it was tilted slightly downstream and rode just below the level of the free surface.
Two valves in the return pipe allow regulation of
the rate of flow, one valve allowing coarse adjustments and the other permitting finer adjustments at reduced flow rates. The return pipe is jacketed with a second, larger, pipe in which cold water is circulated, cooling the channel flow to a minimum of 16 deg. C.
The pump in use with the flume is an Ingersoll-Rand Type 30 KRVS centrifugal pump. A 2 hp motor drivesithe pump by means of a geared belt. The 1750 rpm of the motor was tripled by the pulley arrangement used.
A Jater feed system was needed to compensate for evap-oration in the longer runs and to provide water for the pore spaces of the new bed during aggradation runs. This
system consisted of a bucket of several gallons capacity into which the cooling water flowed after leaving the pipe jacket. The bucket had a hole in its top from which water could drain when it was nearly full. When the experiments were in progress, this arrangement provided a constant head
on a small valve attached to the bottom of the bucket. This smaller valve could be adjusted to provide a relatively
constant flow rate up to several tend< of cubic centimeters per minute.
A sediment-feed device was also used to introduce dry sediment into the flow at the tailbox. This apparatus con-sisted of the lower two-thirds of a thirty gallon drum mounted on a wooden frame and suspended over the end of the
channel. Holes of varying sizes were drilled into the
bottom of the drum to provide various rates of sediment feed. All holes but the one in use were corked or taped shut. Power to produce a uniform flow of dry sediment from the drum was provided by an air-powered ball Vibrator (Martin Engineering Co., Neponset, Illinois; model BDR-16, designed for prolonged continuous operation). The ball vibrator was attached securely by a bolt to the bottom of the drum a few centimeters from the various feeder holes.
A view camera was used to document each of the aggrada-tion runs. Depending on the circumstances a series of close-ups was taken and/or a series of overlapping shots taken for three to four meters along the flume. Depending on the
parti-cular run, these shots were supplemented by overhead pictures that showed both the sediment seen through the sidewall and the bed surface. In addition, on some runs the process of aggradation and ripple advance were recorded at half-hour
intervals at a given location just upstream of the tailbox. Photo 1 shows the entire experimental apparatus
except for the view camera. The main components are labeled in the photograph.
At the beginning of each run, whether an aggradation run or a calibration run, some or all of the sediment was added by hand to the flume, an appropriate amount of water admitted from the overhead holding tanks, the cooling system activated, and the dripper set to compensate for evaporation
and/or aggradation.
It was found that a drip rate of 15 drops/min (about 1 cm3/min) compensated for evaporation; at least no discern-ible change in the flow depth was noticed in a 36 hr. period.
During the calibration and aggradation runs, surface velocities were measured using a small wooden float and a standard laboratory ttopwatch. The float was timed over a convenient 183 cm distance midway down the flume. Depending on the circumstances, for each desired velocity a varying number of times (4-40) were taken and their mean used to compute Vs* V was then taken to be 0.85Vs, and Y was derived from
Y = Q/wV
All pipettings were taken using a 50 ml pipette. 50 ml beakers were used to contain the mixture. The net weight of sediment per 50 ml of mixture was obtained by
decanting and drying in an oven. The 50 ml of water-sediment mix taken from the flume was replaced with water. A triple-beam balance was used in all cases to weigh the beakers and the sediment contained therein to within ± 0.01 gm. In the
runs longer than eight hours a method was needed to remove the fine algae/sludge (the sludge being derived from the
plumbing system with time) mixture),had to be removed from the walls of the flume to obtain a view of the sediment. A thin wood sliver was used intermittently to keep the Plexiglas walls
clean and disturbed the sediment only minimally.
For each aggradation run, the particular feeder hole was calibrated by averaging several test runs to obtain Q. After each run the sediment was dried with four infrared heat
lamps. The dry sediment was then sieved through a 470 micron mesh to insure the feeder hole would not be clogged.
It was found that Qs is a function not only of the hole size but also the distance of the hole from the ball vibrator attachment bolt and the amount of dry sediment in the drum. An increase in height of the sediment in the drum resulted in two effects, the net result of which was to decrease Qs:
the increased pressure on the hole tended to produce a higher flow rate, but this was more than compensated by the greater difficulty the ball vibrator experienced in vibrating the heavier weight, thus producing a net decrease in
Qs
as the height of fill was increased from 1/3 to completely full. In addition, when the container was filled less than about 20%, the supply of dry sediment to the hole varied randomly with slumping in the container, because the hole was not completely covered at all times and therefore could not feed at a constant rate. One might think that these fluctuations would average out with time and thus would not vary the feed rate over a severalminute period, but this turned out not to be the case for
reasons that are not completely clear. There was also another effect, that of packing the sediment as it was vibrated for many hours. For this reason, the vibrator was run for several hours before each aggradation experiment in an attempt to
reduce the porosity to a constant:value.
As a result of the decrease in Qs caused by an increase in the height of sediment in the drum, sediment had to be added to maintain the level during each aggradation run.
For the flow rates involved, this was not too inconvenient, and the level of the drum was maintained at about 50 liters
t 1 liter. The concomittant small variation of the feed depth with time seemed not to be significant and did not materially
alter
Qs.
In order to estimate the amount of water needed to fill pore spaces in the aggrading bed, a small amount of sediment was packed to a reasonable density (by tapping the container on a hard surface until no change was noticed in the sediment
height) and then saturated with water. This was done twice, and the required volume of water for a given volume of sediment
remained essentially constant (Table 1).
A correction factor was needed as Qs from the feeder hole was measured with reference to a relatively unpacked state
(as it filled a 1000 ml graduated cylinder) and a mean flow rate calculated. This represented a feed rate determined from sediment in a fairly aerated state, whereas the water required to fill the pore spaces in a given volume of sediment was with
reference to a packed state. The 1000 ml graduated cylinder was then tamped in a manner similar to that noted above for the pore space sample, reducing the volume of sediment to 820 ml. The quantity Qs, then, refers to a flow rate of dry sediment into a 1000 ml cylinder (or into the flow) in an unpacked
state. The quantity QB refers to the amount of water flow required to saturate an amount of dry sediment flow equal to 0.82Qs'
Documentation of each experimental run was acquired as described above under the section on experimental apparatus.
Depending on the run involved a water surface profile (5 cm intervals) and a bed surface profile (2 cm intervals) were taken along the center line of the flume, allowing an independent calculation of Y (independent of the measure of surface velocity using the float). Depending on the velocity of the run, the Y value obtained from the profiles had to be increased 0.0 to 3.0 mm to compensate for the suspended
sediment that settled out onto the bed when the pump was stopped. A 20" Mercury manometer was used in conjunction with an orifice meter to obtain information on the flow rate, Q.
FINER SILT FRACTION CALIBRATION RUNS
Three calibration runs were performed with the finer fraction of the mid-continent loess; it was found to be less well-suited for the purposes of the experiment than the
coarser fraction. Essentially, the difficulties were two: a relative lack of the darker particles (assumed to be plant debris) to delineate the internal sedimentary structures and, less importantly, a higher suspended concentration for a given flow7velocity than the coarse fraction, resulting in greater problems in maintaining a uniform mean flow depth as the velocity was reduced.
The first calibration run consisted of a sudden drop in manometer reading from 18" to 9" in order to see how quickly the suspended concentration adjusted to the reduced velocity. The actual drop in velocity was not as much as one might think from the relationship
Q =
1700(AH") cc/5*ebecause of the amount of sediment that settled out thus
reducing the mean flow depth at the same time
Q was decreased.
From measurements made at the time, the change in velocity was from 65 cm/sec to 50 cm/sec (see Table 2 and Fig. 1).The rather rapid rise in the mean concentration beginning at about eight minutes is due to the development of high-speed ripples; at the upper velocity the bed regime is planar or nearly so.
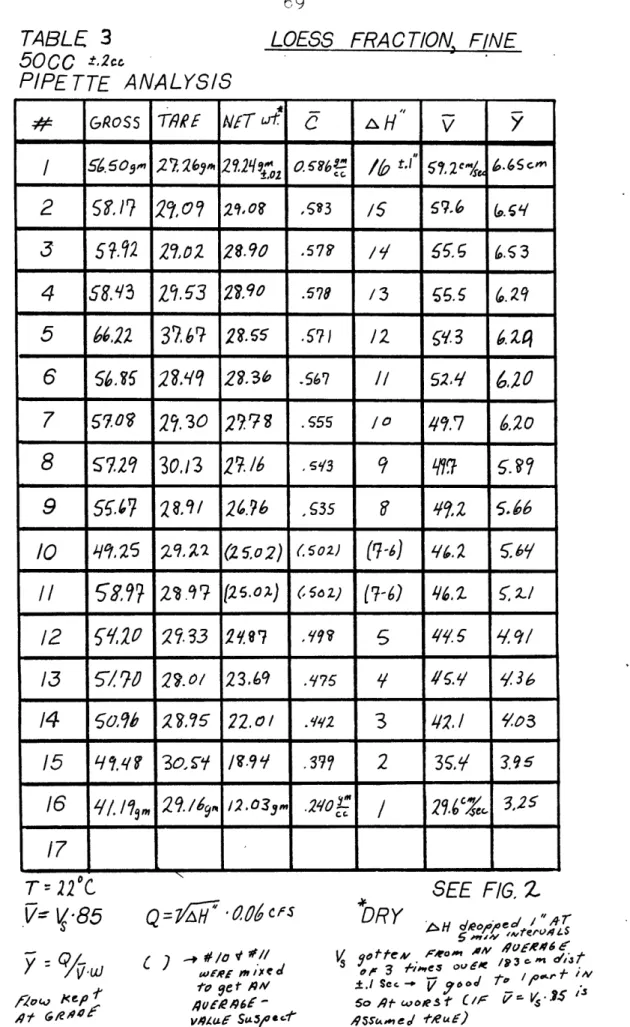
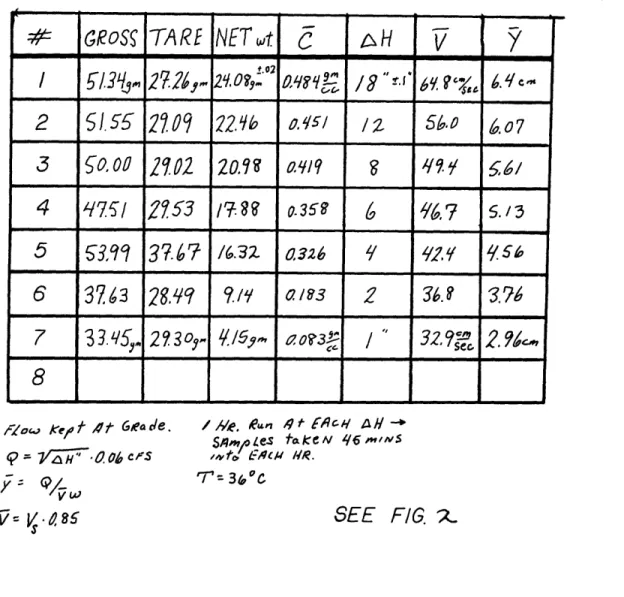
The second calibration involved two flume runs. In the first, the manometer reading was reduced by 1" every 5 min. and a pipette sample was taken for each manometer reading as it was reduced from 16" to 1". This yielded a graph of concentration versus velocity (Pig. 2 & Table 3). In the second run, larger reduction intervals were used, but an hour was allowed for the sediment to readjust to the
change in manometer reading. The idea was to see how rapidly the sediment adjusted to the new equilibrium concentration for the given velocity (Table 4).
The first interpretation from the graph (Fig. 2) was that the sediment did indeed require a long time to adjust as the concentrations were systematically lower for the run in which the sediment was given an hour to adjust to each
change in the flow velocity. Ideally, the desired sediment would adjust to a change in the velocity in four or five minutes; enough time for many passes through the flume, but not so long as to require extremely long aggradation runs with very small1but numerous reductions in the
manom-eter reading.
It was noticed, however, that during the run shown in Table 4, the temperature was 36 deg. 0, as opposed to 22 deg. C for the run shown in Table 3. The dynamic viscosity of water is a rather strong function of temperature (Table 5 & Fig. 3) (Chemical Rubber Co., Daily and Harleman, 1966; Gibbs et al., 1971) and therefore the change in viscosity due to temperature difference would change the effective
settling diameter of the sediment, since the viscosity is
a fundamental parameter of any fluid (Briggs & Middleton, 1965). Studies have shown that an increase in temperature (and thus a decrease in the viscosity) does affect the bed form as well as decrease the amount of suspended load (Hubbell & Ali, 1961).
It was decided to allow for the viscosity effect on the assumption that the viscosity and suspended concentration were linearly related in the range of this velocity and
viscos-ity. In reality, the relationship is more complicated since a change in viscosity affects not only the effective fall diameter, but also the intensity and scale of the turbulence. Intergranular collision effects would be altered too, but this is a highly complicated problem. In this case the question was whether or not the first-order correction for viscosity would systematically do away with the discrepancies
in the mean concentration as shown in Fig. 2. Taking 33 vel-ocities from Table 4 and 3 from Table 3, that were within 1% of each other (56.0/55.5, 42.4/42.1, 49'22-49.7-49.7/49.4), a comparison of the associated mean concentrations gives the following result: three ratios are obtained (high temp-erature to low temptemp-erature concentrations): 0.766, 0.771, and 0.737. The ratio of high temperature (36 deg. 0) to low temperature (22 deg. 0) viscosities (Table 5) is 0.738.
Considering the uncertainties of measurement involved (and the given 1% variance in velocities), this close an agreement is taken &A proof that the finer silt could adjust to a
change in velocity in five minutes or less. This was acceptable.
However, when test runs were made to examine the equilibrium sedimentary structures of the finer fraction it was found that the finer silt did not contain nearly as much dark plant debris as the coarse silt and thus would not delineate the sedimentary structures nearly as well,
especially at higher velocities. A visual examination by
Similar calibration runs were conducted with the
coarser silt except that the one-hour adjustment was omitted since it was known that the finer silt did not require this much time. But just to be certain, in the run in which the manometer readingwat decreased one inch at a time, a half-hour interval was used.
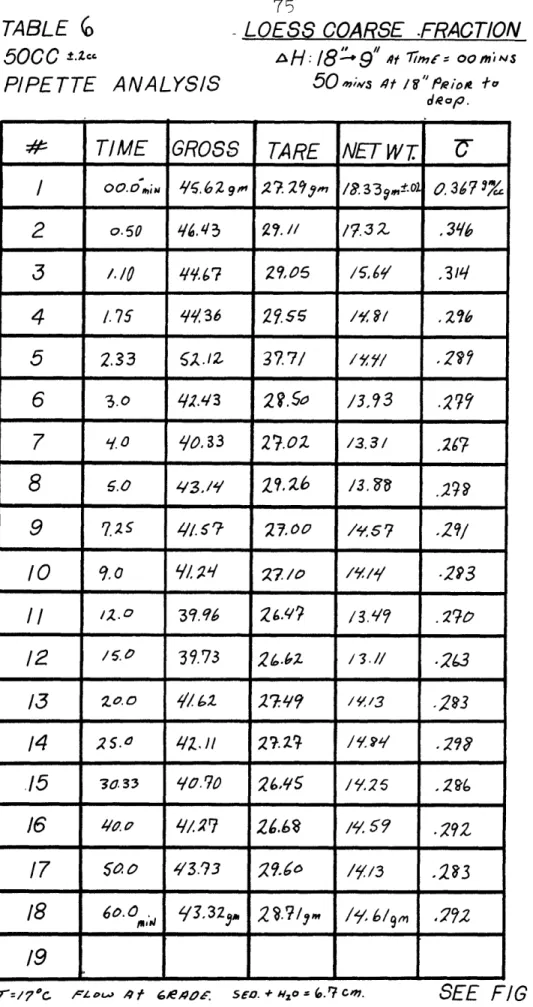
In the calibration run in which the manometer reading was reduced abruptly from 18" to 9" the net weight of
sus-pended sediment per cubic centimeter was roughly half what it was for the finer fraction (Table 6 & Fig. 4). As can be
seen from Fig.4, the sediment reacts fully to the change in velocity in about four minutes. As with the fine fraction the concentration rises sharply after the four minutes and then oscillates about an equilibrium level once ripples have begun forming.
The apparently sinusoidal variation of mean concentration with time is evident from Fig.4, and to a lesser extent in
Fig. 1. The cause of this sinuous variation is unknown. The pipettings were taken from the tailbox about 8-10 cm beneath the free surface and about 20'.aciy from the downstream end of the channel. The fluid in the tailbox is well-mixed and should reflect an average of upstream conditions such as bed roughness. If the ripples were slowly growing during the measurement
period, one would expect the concentration to climb slowly, perhaps still oscillating in the process. However, after the
first few minutes this does not occur. There were no fluctuations in the flow rate through the pump, and the suggestion that the average concentration varied with time depending on whether a trough or a crest was immediately upstream of the tailbox is unattractive, given the charac-teristics of either the coarser or finer fractions. It seems that the averaging process mentioned above must take place, so that no single terminal feature could affect
sediment concentration in the tailbox. In addition, it must be remembered that in all likelihood at a given instant the terminal feature just upstream of the tailbox is part crest and part trough because the bed features are to some degree three-dimensional. Of course, one cannot be sure that the variation is of the period indicated by the Figures; the
low rate of sampling does not allow a full description of the variation with time.
In Fig. 5 and Table 7 the results of the mean concen-tration versus velocity run are depicted. The increase in mean concentration with velocity is nearly linear
inreth&-velocity range investigated. A test run to view the equilibrium ripples and other structures showed that the coarser silt contained a considerably higher concentration of dark plant debris than did the finer fraction and would
therefore be more suited for the experimental study. In addition the lower suspended-sediment concentration of the
coarser fraction makes it easier to provide for a uniform mean flow depth in the aggradation experiments in which velocity changes with time.
A knowledge of the equilibrium concentration of sediment at a given velocity would provide an idea how much sediment would drop out of the flow as the speed was reduced, thus allowing one to corrent for the decrease in flow depth by adding water over and above that required to compensate for evaporation and the pore spaces of the
aggrading bed. However, ideally this water would have to be added in analog fashion, the rate derived from the curve of Fig. 5. This presents some additional simulation problems which are discussed below in the conclusions.
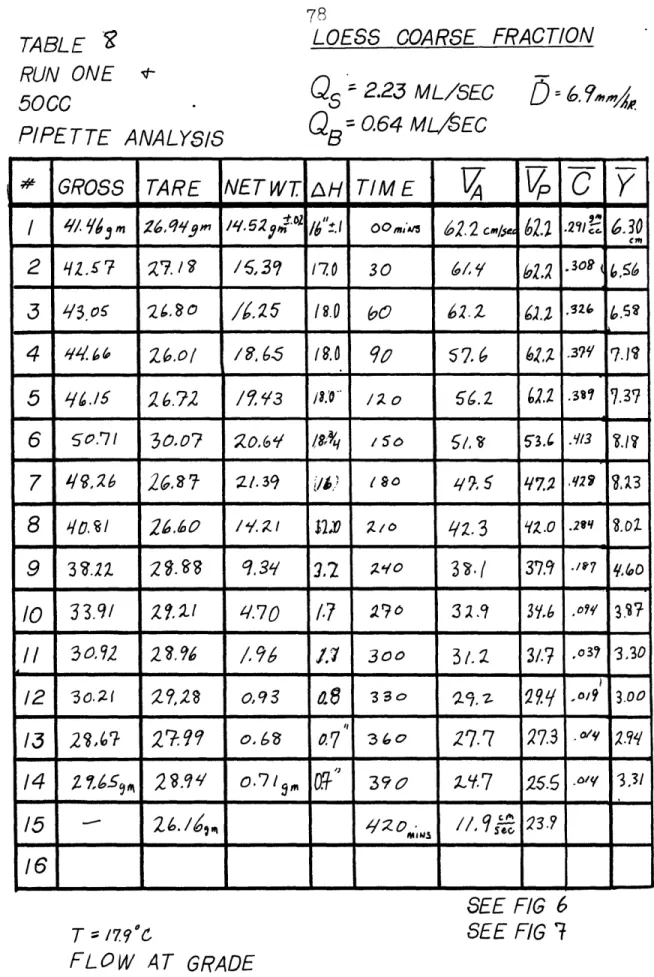
Run 1 was a preliminary run to test the entire system (Table 8 and Figs. 6 & 7). A planned velocity-reduction
program was carried out while the bed aggraded at a relatively high rate.
Qs
was 2.23 ml/sec, which, given the area ofthe flume bottom, aggraded 5.9 cm of sediment over the 420 minvltof the run, a rate of 6.8 mm/hr. It was thought before
the run that this rate of aggradation was appropriate in terms of the thickness of distal turbidites and what was felt to be a reasonable duration of current flow (5-10 hrs.).
The run produced structures that bore little resemblance to the known appearance of equilibrium ripples in the sedi-ment (Photos 2-5): their spacing was up to 30 cm, and their average height was about 3 cm. Fairly distinct foreset laminations were obtained, as well as parallel laminations of the Bouma D Interval.
The velocity was held high (plane-bed conditions) for two hours in an attempt to aggrade a B Interval. Remains of a faint B Interval can be seen in some of the photographs, but the record of the B Interval was generally destroyed by the erosive action of the 0 Interval ripples that followed. This is in contrast to statements in the literature to the effect that there is no truncation of backset laminae
(Enos, 1969a; Sanders, 1963). Even with this rate of aggradation, both the B Interval and much of the eaklier portions of the interval of ripple-drift cross lamination
were eroded away by subsequent ripples movement. Enos states that the rate of aggradation must be high in order for the laminae not to be eroded, but he does not say how high. Sanders (1963, p. 177) gives a sketch of ripples whose internal laminae are not truncated because of the rate of Vsand fallout". The sketch shows some ripples moving under equilibrium conditions without aggradation as well, but the spacing of the equilibrium and the aggraded ripples is the same.
According to Enos, the angle of climb generated by a rate of aggradation high enough to avoid truncation is about 15 deg. In two of the accompanying photographs in which the angle of climb is most readily determined from the structures the angle is 11±1 deg. Thus, it seems contradictory that almost all the B Interval and early C Interval were truncated by the C Interval itself with time. But higher aggradation rates would undoubtedly produce structures with greater spacing than the ones recorded in Run 1.
An odd structure can be seen in the Photographs 4 and 5: it appears to be a reverse ripple moving from right to left. No other reverse ripples were seen in any of the runs that approached this in size.
Whef interpreting the photographs one must realize that the top most sedimentary layer (typically shaded a little darker than the D Interval immediately below it) is composed of fine sludge and possibly brown algae that were generated within the system with time. It forms a non-laminated inter-val that could be taken to be an B Interinter-val for the sake of
completeness, except for the fact that it settled out in the few minutes after the run was stopped rather than over many years, as is the case with the true E Interval of pelagic
sediment.
As can be seen from a comparison of Figs. 5 & 7,under this aggradation rate the concentration of sediment is typ-ically two to three times higher for a given velocity than under equilibrium conditions. Curiously, there is a decrease
in sediment concentration in Run 1 for velocities above about 54 cm/sec; the only reason I can give is that it took a couple of hours in the high turbulence above 54 cm/sec for the sedi-ment to reach its maximum concentration. The run was begun with the flow saturated with sediment; an average thickness for the bed at the highest velocity was perhaps j cm along the flume channel. Apparently, highly turbulent flows can suspend sediment loads over and above their customary equi-librium concentrations for quite some time during the
aggradation process. This is to be contrasted with the calibration runs in which the sediment reacted in a few minutes to a change in velocity. But it must be remembered
that in the latter cases, there was no sediment being added to the flow.
This additional suspension created some difficulties with regard to uniform flow depth. In this run no "extra" water was added to make up for the loss in flow depth due to sediment dropped from suspension as the velocity was
reduced. This was intentional in order to get an idea
of the magnitude of the problem. Not only was there a good bit of suspended sediment to rain out when the velocity was reduced, but there was little deposition of sediment during the first two hours; most of it stayed suspended along with the small amount of pore water that was also being added.
Since little sediment settled out during the first two hours (and most of what did, the B Interval, was destroyed by truncation later in the run), the discharge had to be
increased in an attempt to maintain a constant velocity for that period. When it came time to actually reduce the
velocity according to the pre-planned curve, much sediment fell from suspension, reducing the flow depth, and thus requiring further reductions in the discharge to continue the velocity reduction, which in turn caused more sediment to settle out, etc.
An examination of Table 8 shows the variation of
7
with time for Run 1; much of the variation can be explained by the concentration of suspended sediment in the original6.3 cm of flow depth. In addition, the extremely rapid aggradation rate during the 21e-270 minute interval (over 4 cm/hr.) quite possibly formed a bed with more water than a normal bed moving under equilibrium conditions. It could
be that the calculations derived from Table 1 provide too little water for pore spaces because the sediment was packed
in the flume and the sediment measured in Table 1 indicated a similarly packed condition (the sediment was quite firm).
Because of the difficulties cited above, a decision was made to study bed forms at two different velocities
in the ripple field to see the effects of varying the aggra-dation rate.
RUN 2
Run 2 was conducted at what is thought to be a reasonable minimum rate of aggradation for a distal turbidity current. About 4.8 cm of sediment was aggraded on a pre-existing bed, which had progressed at the same speed at equilibrium for 22 hrs., by 27} hrs. of dry sediment feeding into the tailbox. This is an aggradation rate over the area of the channel bottom of 1.2 mm/hr.
The pipetted samples were allowed to settle for 2 min. in 50 ml beakers and then the liquid was poured off. An examination of the clarity of the liquid showed little
change after 1-2 mins. indicating that small or low density particles were present, probably brown algae. After 2 min. in a test cast, little change was noticed during the third minute of settling. It was decided that in Run 2 and in
future runs the fluid could be decanted any time in the 2-3 min. range and still allow most of the algae to be removed. Since more algae was produced as the run went on, this
prevented the later pipette samples from being biased to a higher weight.
At the end of Run 2 a water-surface profile was taken for about 3 m along the flume (spacing interval: 5 cm) with the pump running, and after the run was completed a bed-surface profile was taken over the same distance at 2 6m-: intervals. A careful examination had previously shown that no rail correction was necessary as the rails were parallel
to the flume bottom within
±
0.01 cm, the precision of the point gage. These two profiles allowed Y to be calculated directly and: then a V can be calculated from the equationV = Q/wy,
or one can take a series of measurements of surface velocity with a stopwatch and a small float, computing V from the assumption that the aean-yelocity is 0.85 the surface velocity, a relationship that has proved reasonable for flow over beds in the experimental flume in the past.
That the two methods of determining V differ in
results is evident from the table. Although a large number of measurements of Vs were made, reducing the chances for error there, in all likelihood there is a systematic error in assuming that the mean velocity is 85% of the surface velocity (there is probably a functional dependence on flow depth and bed profile that is not considered) so the V generated through use of the surface-profiles and the discharge equation is the more accurate.
It was noticed during this run that there appeared to be areas of net deposition and erosion on a scale larger than the ripple spacing. This produced a gently undulating bed varying in thickness considerably over the length of the
channel, the spacing of these larger undulations being about
75 cm.
Measurements were taken from photographs of the 4 m of bed immediately upstream of the tailbox for both the
equilibrium and the aggraded ripples. It was found that the spacing of the equilibrium ripples has a mean value of 10 cm, and the mean spacing for the aggraded ripples was about 12 cm. The heights were more difficult to compare since roughly 3 mm of sediment rained out of the flow when the power was shut down, but it appears that the height of the aggraded ripples is less than that of the equilibrium ripples. Measurements over 30-40 cresta givibt.4Lcm for the equilibrium ripples and 1.1 cm for the aggraded ripples.
The argument could be made that the 0.3 cm of mantling sediment made up the difference but it must be remembered that the mantling sediment rained out on both crests and troughs; certainly not the entire 0.3 cm of "fallout" was
deposited in the troughs. Although the change in ripple height can be argued, the increase in ripple spacing seems to be
nearly certain.
The values for height and spacing above have been
corrected for systematic error: the meter stick that appears in the photographs had to be placed outside the Plexiglas for clarity and convenience, thus placing the meter stick nearer the camera by its own thickness plus that of the Plexiglas. Pictures taken of two meter sticks at this
viewing distance, one offset from the other by the displace-ment distance above, and then enlarged for accuracy of
measurement, indicate a 6% reduction factor caused by this effect. Eight different measurements were taken to compute
the correction factor, and all of them produced a correction
of 6±%%. Similar corrections were taken for the other
exper-mental runs, the amount of the factor being larger in the relatively close-up photographs.
The average suspended concentration vatted with time as it had in the previous calibration runs. Pipettes 11 and
12 (Table 9) were taken within a minute of each other,
indicating that the variation in concentration either has a high frequency or that the pipette error is about 2%; the
latter is probably the better choice. Again there is no
general increase in the mean suspended concentration with time, the minimum and maximum suspended concentrations (#14 and #16) being fairly close to each other in time.
A certain planar feature whose linear projection can be seen through the Plexiglas are evident in both the
equilibrium and the aggradational ripples. This feature represents the locus of the transition between the lee slope and trough of a ripple and will be called the "Basal Trace". Photographs 6-13 depict basal traces and other features described in the accompanying captions.
Basal traces in the equilibrium ripples indicate that in some cases they are climbing (positively inclined to the horizontal), but that in other cases they are negatively
inclined; the result being a net climb angle of zero degrees. The aggraded ripples show positively inclined basal trace* generally, although they show some horizontal ones.
The aggraded ripples show some large trough structures which may or may not be related to the occasional boil-like structures that appear on the bed surface (Photos 12 and 13). Further, the rather distantly spaced (75 cm) undulating
trough-crest pattern mentioned above could be a result of the boil structures. The inter-relationship among these three features, if any, is not at all clear.
An examination of the basal traces for the equilibrium and the aggraded ripples shows that one must examine more than a few basal traces in the field before making a generalization as to-whether or not true ripple drift cross-lamination
(aggra-dation) is taking place; a basal trace may be horizontal In an aggrading bed just as equilibrium ripples can produce an occasional climbing basal trace. Only an average angle of inclination computed over several tens of basal traces can indicate what is taking place. Perhaps in a bed that is
slowly being eroded by a flow in the ripple regime the average angle of inclination of the basal traces would be negative. In any case since there are areas of relative scour and deposition along the length of the bed surface, it is the average angle of inclination that must be considered.
Run 3 was conducted at the same mean velocity and
mean flow depth as Run 2, or as nearly so as possible (Table 10). The value of
Qs
in Run 3 was 21 times that in Run 2, however. Thus one would expect the main differencesbetween the two runs to be a consequence of the increase in the dry sediment feed rate. The velocities (by averaging the two methods) were 39.0 cm/sec
±
3%, and the mean flow depth was 9.95 cm t 6%. Considering the limited effect of a small variation in flow depth and the fairly good control on velocity, the large difference in aggradation rates should explainany changes in the spacing, height, and internal structures observed.
In the equilibrium run for Run 3 the mean spacing was 10 cm and the mean height was 1.3 cm. Thus, compared to the
equilibrium ripples of Run 2 (the conditions were the same) there was no change in spacing and only a 7% decrease in amplitude.
During the aggraded interval of Run 3 pictures were taken at half-hour spacings at a given sidewall station just upstream from the tailbox.in order to ascertain more clearly how the aggradation proceeded. These pictures make possible a second estimate of the spacing and height of the aggraded ripples in addition to the estimates from photographs taken of the bed after aggradation was complete. To allow time for the bed to adjust to the aggrading process, only the
last seven hours of the aggradation photographs were used to compute mean spacing and height. The average spacing computed from measurements along the aggraded bed was 17 cm. The average spacing computed from single station measure-ments was 16 cm. The mean heights respectively were 1.0 and
1.6 cm.
In the equilibrium run, the measurements were made over 25-30 ripples in a manner similar to that for Run 2. The spacing for the aggraded ripples is nearly the same for the two methods, but there is a large difference between the 1.0 and 1.6 cm values for the ripple heights. The amplitudes generated by the single-site measurements do not decrease with time, ruling out the possibility that the bed is very slowly adjusting to its equilibrium form under aggradation.
Accepting the 1.0 cm-:Walue for the ripple height which was obtained in the--same minner as the aggraded ripple
height was reached in Run 2, it can be seen that the ripple height decreases with increasing aggradation rate, using
either the equilibrium height (zero aggradation) or the
reduced aggradation rate of Run 2 as a basis for comp@rison. The avanospacing of the aggraded ripples obviously increases from the mean aggraded spacing in Run 2 where the aggradation rate was less.
Run 3 is seen as a transition between Runs 1 and 2,
even though Run 1 involved a velocity reduction profile. The trough structures apparent in Run 2 have become more dominant
in Run 3 (Photos 14-17) and the internal structures are less distinct than in Run 2. If one looks at the structures
produced in Run 1 at about this velocity, one sees that they are even less distinct than in Run 3. It seems that at the higher aggradation rates the flow does not have sufficient time to sort the sediment and therefore produces less distinct sedimentary structures. One can see a contrast between the lower portions of the bed in Run 3 which are the remains of equilibirum ripples and the upper part of the bed where the internal structure is much less distinct.
As the aggradation rate increases the ripple spacing increases. As the aggradation rate increases, the height of the ripples decreases (to a point; in Run 1, which also had the changing mean velocity, the height increased producing the long bar-like profiles).
In contrast with Run 2, there appear to be no obvious basal traces in Run 3; it is believed that these structures were not produced: the trough structures were produced instead.
The average concentration of suspended sediment again varies over time, but in this case there is a general increase in C with time which cannot be explained;tiide~d, with the decrease in the amplitude of the ripples, a general decrease in the suspended sediment concentration would have been more expected.
RUN 4
Run 4 was made at the same rate of dry sediment feed as Run 3, but with the mean flow velocity about 30% less. An equilibrium run was made as well; the main difference
being th&t the time allowed for the ripples to come to equilibrium was doubled, since the flow velocity had been reduced. There are a variety of comparisons that can be made with Run 3. (Table 11).
In Run 4 the equilibrium ripples had a spacing of 12 cm, about 20% greater than the spacings in Run 3. The height in the equilibrium phase of Run 4 was 1.3 cm, the same as it was for the equilibrium phase of Run 3. The 20% inctease in spacing is especially significant in that the equilibrium ripples in Runs 2 and 3 had the same spacing to within a millimeter (though the data are probably only good to two figures: 10 cm).
As with all these runs there is a slight shift in the viscosity of the water with a shift in temperature of one or two deg. 0. This is believed not to be significant, since a two degree shift affects the dynamic viscosity of pure water only 5% (and the necessarily higher viscosity of sediment laden water even less).
The aggraded ripples showed a spacing of 15 cm and a height of 1.7 cm on the average. The increase in spacing with aggradation has been noted before. However, in
compari-son to Run 3, in which the shift was 60%, in Run 4 with a reduced velocity, the increase was only about 30.
An attempt to measure spacing and height from the single station photographs that were taken during aggradation failed since the scale of the photographs did not allow the longest wavelengths to be measured from the single picture.
A comparison of the heights of the aggraded ripples between Run 3 and Run 4 shows that the Ripples in Run 4 have noticeably greater heights, either compared to the equilibrium height in Run 4 or to the aggraded height in Run 3. Run 4' also produced internal structures which are more distinct than those of Run 3. Thus it appears that the more intense
turbulence at the higher velocity is a poorer creator of sedimentary structures for a given rate of aggradation.
In the aggradation ripples of Run 4, the trough structures do not appear to be as dominant as they were in Run 3 (see
Photos t$.23). They appear to be more similar to those in Run 2 where the velocity wad hlgher ,but-theaggnadation' rte
16werr' In Run 4 there is also clearer evidence of the ripple-drift-cross-lamination in that the basal traces are again present after not being produced in Run 3. As in
Run 2, the basal traces are generally inclined positively to the horizontal.
In short, from Run 4 it has been seen that a drop in the velocity (while still in the ripple field) tends to increase spacing, have little effect on the height of equilibrium ripples while increasing that of the aggraded ripples, and to increase the distinctness of the structures produced.