Publisher’s version / Version de l'éditeur:
ASHRAE Transactions, 115, 2, pp. 1-15, 2009-06-01
READ THESE TERMS AND CONDITIONS CAREFULLY BEFORE USING THIS WEBSITE. https://nrc-publications.canada.ca/eng/copyright
Vous avez des questions? Nous pouvons vous aider. Pour communiquer directement avec un auteur, consultez la
première page de la revue dans laquelle son article a été publié afin de trouver ses coordonnées. Si vous n’arrivez pas à les repérer, communiquez avec nous à PublicationsArchive-ArchivesPublications@nrc-cnrc.gc.ca.
Questions? Contact the NRC Publications Archive team at
PublicationsArchive-ArchivesPublications@nrc-cnrc.gc.ca. If you wish to email the authors directly, please see the first page of the publication for their contact information.
NRC Publications Archive
Archives des publications du CNRC
This publication could be one of several versions: author’s original, accepted manuscript or the publisher’s version. / La version de cette publication peut être l’une des suivantes : la version prépublication de l’auteur, la version acceptée du manuscrit ou la version de l’éditeur.
Access and use of this website and the material on it are subject to the Terms and Conditions set forth at
CFD study of smoke movement during the early stage of tunnel fires:
comparison with field tests
Yoon, H. J.; Hadjisophocleous, G. V.; Kashef, A.
https://publications-cnrc.canada.ca/fra/droits
L’accès à ce site Web et l’utilisation de son contenu sont assujettis aux conditions présentées dans le site LISEZ CES CONDITIONS ATTENTIVEMENT AVANT D’UTILISER CE SITE WEB.
NRC Publications Record / Notice d'Archives des publications de CNRC:
https://nrc-publications.canada.ca/eng/view/object/?id=dec8b5dd-ceeb-4743-bc47-87fd5d83b5b7 https://publications-cnrc.canada.ca/fra/voir/objet/?id=dec8b5dd-ceeb-4743-bc47-87fd5d83b5b7http://irc.nrc-cnrc.gc.ca
CFD st udy of sm oke m ove m e nt during t he
e a rly st a ge of t unne l fire s: c om pa rison w it h
fie ld t e st s
N R C C - 5 1 3 5 4
Y o o n , H . J . ; H a d j i s o p o c l e o u s , G . V . ; K a s h e f , A .
J u n e 2 0 0 9
A version of this document is published in / Une version de ce document se trouve dans:
ASHRAE Transactions, 115, (2), June 01, 2009, pp. 1-15
The material in this document is covered by the provisions of the Copyright Act, by Canadian laws, policies, regulations and international agreements. Such provisions serve to identify the information source and, in specific instances, to prohibit reproduction of materials without written permission. For more information visit http://laws.justice.gc.ca/en/showtdm/cs/C-42
Les renseignements dans ce document sont protégés par la Loi sur le droit d'auteur, par les lois, les politiques et les règlements du Canada et des accords internationaux. Ces dispositions permettent d'identifier la source de l'information et, dans certains cas, d'interdire la copie de documents sans permission écrite. Pour obtenir de plus amples renseignements : http://lois.justice.gc.ca/fr/showtdm/cs/C-42
CFD Study of Smoke Movement
during the Early Stage of Tunnel
Fires: Comparison with Field Tests
ABSTRACT
Temperature and smoke spread in the early stage of a fire were modeled, using computational fluid dynamic techniques, and compared with data obtained from field tests conducted in an operating roadway tunnel in the City of Montreal, Canada. Fire characteristics, including temperatures and smoke spread over the tunnel were measured during these tests. Two types of fire scenarios were simulated: gasoline pool fires under vehicles and gasoline pool fires behind vehicles. The estimated fire size used in the simulations was 650 kW. The initial and boundary conditions of each simulation were set to mimic the conditions of the corresponding test. Comparisons were made to temperature and smoke optical density measurements. In general, favourable comparisons between the numerical predictions and the experimental data were observed. The ceiling temperature downstream of the fire decreased with an increase in the distance from the fire source, which is also the case for smoke optical density. The ceiling temperatures produced by the fire behind the vehicle were higher than those produced by the fire under the vehicle. The temperature variation along the central cross section of the tunnel shows that the highest ceiling temperature occurs 3~5 m downstream of the fire because the plume was tilted by the airflow inside the tunnel. Fire location had a significant impact on ceiling temperature development in the tunnel. The airflow conditions at the fire location significantly affect smoke and temperature distributions in the tunnel which will also affect the performance of detection systems.
INTRODUCTION
In a tunnel environment, development of fire and smoke spread are affected by the fire set-up and ventilation conditions in the tunnel. During normal traffic operation, smoke can be diluted or pushed away from the detection system by the normal ventilation system, which is designed to maintain acceptable levels of contaminants in the tunnel (Beard and Carvel 2005). It can create conditions that may challenge
the ability of detectors to detect and locate the fire in the early stage if the fire is enclosed in a vehicle or located behind an obstruction. In order to achieve early detection of fires in a tunnel, it is essential to understand how fire develops and smoke spreads during the initial stage of fire under various conditions.
An extensive Computational Fluid Dynamics (CFD) study was carried out as part of the International Road Tunnel Fire Detection Research Project (Liu et al. 2006a), which aimed at investigating the detection performance of current fire detection technologies. The CFD study included simulations of full-scale tests conducted by the National Research Council of Canada (NRCC) in the Carleton University laboratory tunnel and a series of simulations to examine effects of various fire scenarios and different ventilation schemes. Findings of this CFD study were (Kashef et al. 2008 and Ko et al. 2008);
• Simulated results exhibited relatively good agreement with laboratory test results.
• Temperature development inside the tunnel was considerably affected by fire scenarios, such that temperature rise near the ceiling was less significant for fires enclosed by a vehicle body than that for open fires.
• The simulations agreed with the laboratory test results in that the longitudinal airflow affected the burning behaviour of the fire and smoke spread in the tunnel. Moreover, the impact depended on the relative size of fire to the airflow velocity, as well as the fire scenario. In general, the ceiling temperature decreased with an increase of airflow.
• The development of temperature depended on the ventilation scheme (longitudinal, semi-transverse and fully-transverse ventilation systems) inside the tunnel.
• The length of the tunnel did not have a significantly impact on the temperature development near the ceiling close to the fire location. Thus, the results found in the laboratory tunnel scale can reasonably be extrapolated to longer tunnels.
In order to further investigate and verify these results, field tests were conducted in an operating tunnel environment. This paper reports the CFD study carried out to simulate the field tests conducted in Tube A of the Carré-Viger Tunnel in Montreal. As well, the paper presents the results of the study and comparisons between model predictions and experimental data.
The current research employs the Fire Dynamic Simulator (FDS) version 4.07 (McGrattan and Forney 2006), developed by the National Institute for Standard and Technology, to study the fire growth and smoke movement in road tunnels. FDS is based on the Large Eddy Simulation (LES) approach and solves a form of high-speed filtered Navier-Stokes equations, valid for low-speed buoyancy driven flow. These equations are discretized in space using second order central differences and in time using an explicit, second order, predictor-corrector scheme. Turbulence parameters used in simulations were 0.2, 0.5, and 0.5 for Smagorinsky constant, turbulent Prandtl, and Schmidt number, respectively. For combustion, FDS uses a mixture fraction method based on equilibrium chemistry. Fire is modelled as the ejection of pyrolyzed fuel from the fuel surface that burns when mixed with oxygen (McGrattan and Forney 2006). Fire modelling and smoke generation are modelled based on specified stoichiometric parameters and yields for soot.
Three CFD simulations were carried out to simulate field tests conducted in the Carré-Viger Tunnel in Montreal. The aim of this study is to compare the simulation results of smoke movement with actual test results. Detailed description of the field tests can be found in Liu et al. (2008b). Comparisons were made to temperature and smoke optical density measurements.
MODEL DESCRIPTION
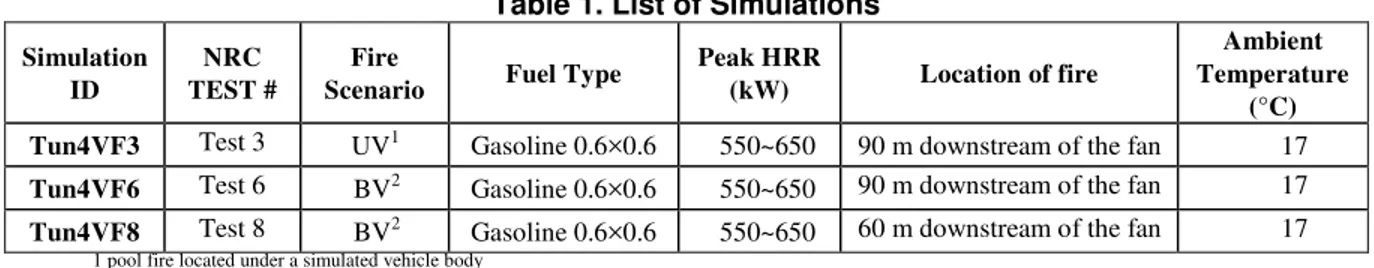
Three simulations were carried out with variations of fire set-up and location of the fire. Table 1 lists simulations and conditions used for each of the three simulations.
Table 1. List of Simulations
Simulation ID
NRC TEST #
Fire
Scenario Fuel Type
Peak HRR
(kW) Location of fire
Ambient Temperature
(°C) Tun4VF3 Test 3 UV1 Gasoline 0.6×0.6 550~650 90 m downstream of the fan 17 Tun4VF6 Test 6 BV2 Gasoline 0.6×0.6 550~650 90 m downstream of the fan 17 Tun4VF8 Test 8 BV2 Gasoline 0.6×0.6 550~650 60 m downstream of the fan 17
1 pool fire located under a simulated vehicle body 2 pool fire located behind a simulated vehicle
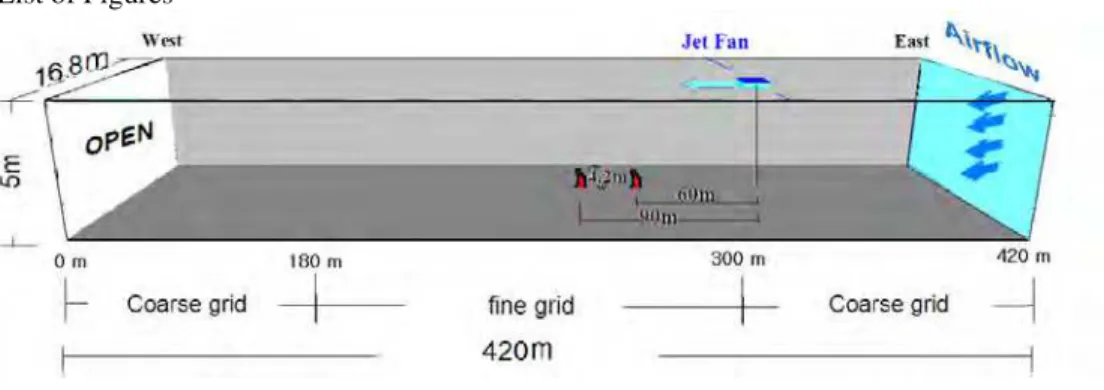
Model geometry
The simulated tunnel section was a 4-lane, 420 m long, 5 m high and 16.8 m wide, as shown in Figure 1. The fire was placed in the first lane, 4.2 m away from the north wall, as marked in Figure 1. The initial and boundary conditions of each simulation were set to mimic the conditions of the corresponding test.
The boundary condition for walls, ceiling and floor was concrete. The west end of the tunnel was open. Airflow into the tunnel was specified through the east end corresponding to measured airflow velocities (about 1.3m/s) of each experiment. The combination of this boundary condition and the air flow of a jet fan resulted in a flow of 1.4m/s near the fire, which is the velocity measured during tests of that location.
Grid size
Grid convergence tests were conducted, in which 650 kW fire source (0.6 m × 0.6 m) was simulated under natural ventilation condition. Two different grid sizes were used; 0.3 m and 0.4 m. In addition, one grid setting using two overlapping meshes was also tested. In the setting, 0.3 m grid size was used for the tunnel, and 0.1 m grid size was used for fire area. Temperature variances over time were compared for different grid settings. Although the high resolution in the combustion volume predicts better in the combustion area, it does not improve the temperature prediction at the far field (Hadjisophocleous and McCartney 2005). Since the interest of this study is temperature variance over time at some distance from the fire, the optimal spatial size 0.3 m was selected to save computation times. The grid size of the middle of the model tunnel was 0.3 m (D) × 0.3 m (W) × 0.3 m (H) (Figure 1). To save cells for the rest of the long tunnel, the grid stretching technique (McGrattan and Forney 2006) was used. For the rest of the tunnel, a non-isometric grid of 0.3 m (D) × 2 m (W) × 0.3 m (H) was used since it was found from grid tests that this grid did not affect the temperature results in the section where comparisons were made with the experiments.
Ventilation condition
The tunnel ventilation in the tests was maintained under normal operating conditions. The tunnel has a longitudinal ventilation system that is equipped with four ceiling jet fans (one in each lane spaced at 3.45 m). Detailed description of the jet fan can be found in Liu et al. (2008b). The fans are located in a recess in the tunnel ceiling, which at its maximum height is approximately 9 m. The base of the fans is at a height of 6 m. In these simulations, only one jet fan located on the ceiling of the third lane was activated. To model the jet fan in the model tunnel whose ceiling height was 5 m, the horizontal jet fan capacity was calculated taking into account the angle of the jet fan. As shown in Figure 1, the ceiling jet fan was
mounted on the ceiling of the third lane. In the model a horizontal flow of 21 m3/s (45,000 cfm) over an area of 1.5 m × 0.5 m was defined.
During the field tests, air velocity measurements were conducted at a number of cross sections of the tunnel, including the section where the fire was located. Using a hand-held velocity meter, measurements were taken prior to and during the tests. Measurements showed that air velocities were relatively uniform at the section where the fire was located, and the average air velocity was 1.4 m/s. In the field tests, air velocities were found to be more uniform and stable with an increase in distance from the fans (Liu et al. 2008b). In the simulations, the same longitudinal airflow with a velocity of 1.4 m/s was achieved at the section where the fire was located.
Fire Scenarios
The field fire tests in an operating tunnel were carried out using fire scenarios developed in Task 1 of the International Road Tunnel Detection Project for evaluating performance of road tunnel detectors. Two types of fire scenario were simulated as in the field tests: a pool fire located under a mock-up vehicle body (UV) and an open pool fire located behind a vehicle (BV). The boundary condition for these mock-up vehicles were steel plate. The fire size was approximately 650 KW. These fire scenarios are encountered in the majority of tunnel fire incidents and presented a challenge to the fire detection systems (Liu et al 2006b). These fire scenarios were identical to the ones used in the CFD study of laboratory tunnel tests. Detailed descriptions on these scenarios as well as geometry of mock-ups are provided in Liu et al. (2006b). As in the field tests, the effect of changing fire location was also simulated. The fire source was placed at two different locations in the tunnel. For simulation Tun4VF3 and Tun4VF6, the fire was placed in the first lane, 60 m down stream of the fan, where as the fire was placed 90 m downstream of the fan for Simulation Tun4VF8, as shown in Figure 1.
Figure 3-(a) shows the vehicle body mock-up used in the field tests for a fire under a vehicle scenario in which a vehicle crashed and the fuel leaks formed a pool under the vehicle body. In the simulations, a steel plate representing the vehicle mock-up was built over the pool pan. The size of the plate was 1.5 m wide by 2.4 m long and was located 0.5 m above the ground. A 0.6 m × 0.6 m gasoline pool fire was placed under this obstruction.
For an open gasoline pool fire located behind a vehicle, which is a more general tunnel pool fire scenario (Liu et al. 2006), a metal plate (2.5 m wide by 4.2 m high) obstacle simulating the front portion of a crashed truck was placed at a distance of 6 m in front of the pool fire and 0.3 m above the ground, as in the field tests (Figure 3-(b)).
Fire and smoke modelling
In FDS, the burning rate of gasoline can be prescribed by specifying the HRR of the fire, or alternatively the burning rate can be predicted based on the energy fed back from the fire. It was found, from preliminary simulations, that simulating the actual burning was sensitive to the thermophysical properties of the fuel and boundary conditions, particularly the vent conditions. Therefore, the fire source in this study was modelled by prescribing the heat release rate, eliminating some complications, and avoiding potential errors due to a combination of factors, such as insufficient grid resolution and uncertainty in the absorption coefficient and flame temperature.
The growth rate was modified to correspond to the test results so that the burning rates reflected the environment. The ramp-up time parameter was used to control the burning rate such that the fire developed within 60 seconds as in the tests. Satisfactory results were obtained in modeling these field tests.
Instrumentation
The predicted temperature and smoke optical density were compared against the field data. Temperatures were monitored at three different locations corresponding to the thermocouple trees used in the tests. Figure 2 shows schematic of thermocouple and smoke meter locations. Drop-1 and Drop-2 were placed at the middle of the tunnel with five thermocouples spaced at 1.0 m intervals starting 1 m above the tunnel floor. Drop-F was placed above the fire placed in the first lane with four thermocouples spaced at 1.0 m intervals staring 2 m above the pool. The spacing between drops was 15 m for Tun4VF3 and Tun4VF6. For Tun4VF8, Drops 1 and 2 were placed at 30 m and 60 m downstream of the fire, respectively. Smoke optical density values were monitored at two heights, 4.4 m and 2.7 m above the tunnel floor, for both Drop 1 and 2.
Flow behaviour
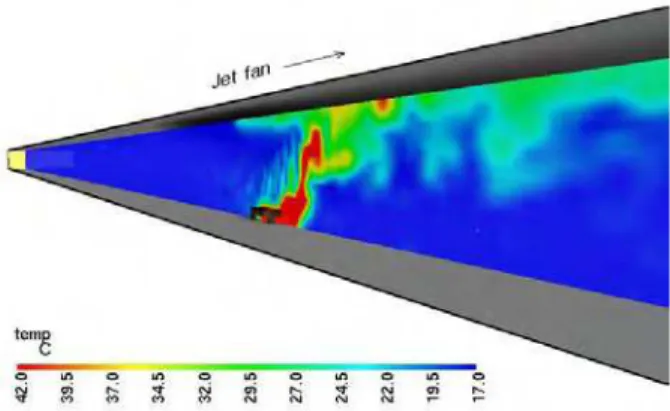
Figure 4 shows a cross sectional view of the simulated temperature contour obtained from Simulation Tun4VF3 (at about 120 s from ignition). The fire plume and smoke were pushed downstream of the fire by the longitudinal airflow. The plume from 0.6 m × 0.6 m gasoline pan fire under the vehicle mixed with more air due to the vehicle obstruction.
When the same size of fire was placed behind an obstruction representing a vehicle front body, the smoke from the open fire was less diluted, as shown in Figure 5. When the open fire was placed close to the fan in Simulation Tun4VF8 in Figure 6, the plume was highly turbulent and mixed with more air.
For both fire scenarios, the fire was tilted by the longitudinal airflow. The obstructions used in each scenario contained the flame or shield the flame, which might challenge detectors particularly flame detectors.
Temperature results
Figure 7 shows the ceiling temperature variation over time obtained at 30 m downstream of the fire for all simulations. Field test results were also plotted in Figure 7, showing relatively good agreement with the simulated results. Both simulated results and experimental results show that the ceiling temperature from a fire under the vehicle is lower than that from an open fire because the open fire grows quickly and burns freely. This result is consistent with those found in the laboratory tunnel tests, where more tests and detailed analyses of the impact of fire types were made (Liu et al 2008a).
When the fire is placed close to the fan (Tun4VF8), the air flow from the fan directly impacts on the fire and plume generation, resulting in relatively low ceiling temperature rise, comparable to the temperature from the fire under the vehicle. At the early stage of the fire, the ceiling temperature rise is substantially low particularly for the fire under the vehicle and open fire close to the fan, which might lead to detection delay for thermal detectors at the ceiling.
From the CFD modeling, time-averaged mean values of temperature between 60 s and 150 s were obtained. In Figure 8, Figure 9 and Figure 10, the time-averaged temperature variation along the central axis for the tunnel length were plotted for Tun4VF3, Tun4VF6, and TunVF8, respectively. Comparisons with test data, which were also averaged over the same period of time, were also made at locations of
Drops 1 and 2 in the figures. The figures show that the ceiling temperatures predicted in model results are slightly higher than the test results. As with experimental measurements, the temperatures decreased with an increase in height.
The largest simulated temperature gradients are found near the fire source, however the highest ceiling temperature was not near the fire location but was observed at about 3~5 m downstream of the fire. This is attributed to the tilting of the plume due to the longitudinal airflow in the tunnel.
The ceiling temperatures downstream of the fire gradually decreased with an increase in distance from the fire source. The ceiling temperature upstream of the fire abruptly dropped down to the ambient temperature for Simulation Tun4VF3, while for simulation Tun4VF6 the ceiling temperature upstream of the fire slowly dropped down to the ambient temperature (smoke moved back about 30 m against the longitudinal ventilation).
Comparing the results from simulation Tun4VF6 with Tun4VF8, it can be seen that the change of the fire location had an impact on temperature development near the ceiling close to the fire. The ceiling temperature estimated in Tun4VF8, 30 m downstream of the fire was lower than that estimated in Tun4VF6, which indicates that the detection range can also be affected by the fire location. Results from Tun4VF3 showed the least ceiling temperature variation along the central cross section of the tunnel.
Smoke Optical Density
Generation of smoke and smoke transport were modelled by FDS. Every time step, the mixture fraction at each grid cell is calculated so that smoke concentration (CS) is tracked along with other combustion products. Smoke concentration is calculated based on soot yield and mass burning rate. The value of soot yield used was 0.1, which is suggested for gasoline pool fires (Evans 1988, Notarianni 1993). Using smoke concentrations (CS), the smoke optical density (OD) is calculated, which indicates the level of smoke obscuration. The smoke optical density was calculated by Equation 1 (Mulholland 2002) using the extinction coefficient (K) calculated by FDS (Equation 2). The value used for mass extinction coefficient (Km) was 7600 m2/kg which is suggested for flaming combustion (Mulholland 2002). The visibility (S) may be calculated from the optical density (OD) as Equation 3 (Mulholland 2002)). In order to achieve visibility of 10 m, the smoke optical density should be lower than 0.13 [OD/m] for light-reflecting sign.
K=Km CS (2) S=3/K for light-reflecting sign (3)
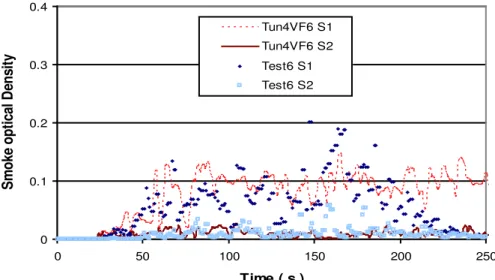
The smoke optical density predicted by FDS was compared with values measured in the field tests. The smoke optical density values were monitored at two heights, 4.4 m and 2.7 m, at Drop 1 and 2. Figure 11 compares the smoke optical density variation over time at Drop 2 resulted form simulation Tun4VF6 and measured from the Test 6. The simulated results showed that the smoke produced by the open fire under the airflow conditions fluctuated, which was consistent with measurements in field tests. At the lower height, the smoke production was quite small both in simulation and field test, which indicates the smoke layer was maintained in the upper part of the tunnel, above 2.7 m from the floor, in the early stage of fire.
The time-averaged mean values of the smoke optical densities [OD/m] near the ceiling were obtained at Drops 1, 2 both from FDS modeling and field tests. The smoke optical density values were compared in Figure 12 with respect to the distance from the fire. In general, the smoke optical density near the ceiling decreased with an increase in distance from the fire source, which is consistent with field test results. However, simulated results of the smoke optical density near the ceiling 30 m downstream of the fire for Tun4VF3 is significantly higher than that 15 m downstream of the fire. In general, the comparisons were more favourable for the scenario with the fire behind a vehicle than those for the case with a fire under a vehicle. At 30 m downstream of the fire, the smoke optical density produced by the open fire behind a vehicle was higher than that by the fire under a vehicle under the same test conditions; however, when the fire was closed to the fan, the smoke optical density near the ceiling is comparable with that from the fire under a vehicle. Both simulation and test results shows that the smoke optical density near the ceiling maintains the same level 60 m downstream of the fire. The field measurement of smoke optical density at 60 m is equivalent to visibility of about 70 m.
CONCLUSIONS
A CFD study of temperature and smoke spread in the early stage of the fire was carried out to simulate the field tests conducted in an operating tunnel in Montreal, Canada. The simulation examined the ceiling temperature distribution and smoke movement over the 420 m long section of the tunnel. Different fire scenarios and locations were simulated. The simulations results were also compared to those obtained in
field tests, showing reasonable agreement. Results were also consistent with those determined in the laboratory tunnel tests.
The ceiling temperature produced by the fire behind the vehicle was higher than that produced by the fire under the vehicle. This indicates that the response times of fire detection systems for the fire enclosed in a vehicle body can be longer than those for the open fire. However, if there is an obstacle such as a truck in front of the open fire, the flame might be invisible to flame detectors downstream of the fire.
In general, the ceiling temperatures predicted in model results are slightly higher than the test results, and the ceiling temperature downstream of the fire decreased with an increase in distance from the fire source, which is consistent with results of the smoke optical density.
The temperature variation along the central cross section of the tunnel located the highest ceiling temperature 3~5 m downstream of the fire since the plume was tilted by the air flow inside the tunnel. This indicates that locating the exact point of the fire might be challenging if the air flow inside tunnel is strong and unstable.
The change in fire location had a significant impact on the smoke production and its distribution in the tunnel. Depending on airflow condition at the fire location, the smoke tempearture distriubtion along the tunnel can be altered so that the detection range can also be affected. This indicates that air velocity field inside the design tunnel must be considered.
REFERENCES
Beard, A., and Carvel, R. 2005. The Handbook of Tunnel Fire Safety (Bendelius, A. and Brinckerhoff, P.), Thomas Telford Ltd, p.127.
Evans, D. D., Mulholland, G. W., Gross, D., Baum, H. R., and Saito, K. 1988. Burning, smoke production and smoke dispersion from oil spill combustion, Arctic and Marine Oilspill Program (AMOP) Technical Seminar 11th. Proceedings, Ontario, Canada, 41-87 pp,
Hadjisophocleous, G.V., and McCartney, “Guidelines for the Use of CFD Simulations for Fire and Smoke Modelling”, ASHRAE Transactions, DE-05-7-3 pp. 583-594, 2005
Kashef, A., Ko, Y. Hadjisophocleous, G., Liu, Z.G., Lougheed, G.D., and Crampton, G. 2008. International road tunnel fire detection research project-Phase II, Task3: Computer Modelling, Fire Research program, Institute for Research in Construction, National Research Council of Canada, Canada.
Ko, Y. Kashef, A., and G. Hadjisophocleous. 2008. Modeling of smoke movement during the early stage of tunnel fires under different ventilation conditions. The International Congress of Smoke Control in Buildings and Tunnels, Santander, Sapin.
Liu, Z.G., Kashef, A., Lougheed, G.D., Su, J.Z., Bénichou, N., and K.H. Almand. 2006. An Overview of the international road tunnel fire detection research project. 10th Fire Suppression and Detection Research Application Symposium, February 01, Orlando, FL., USA. pp. 1-7.
Liu, Z.G., Crampton, G, Kashef, A., Lougheed, G.D., Gibbs, E., Su, J.Z., and N. Bénichou. 2006. International road tunnel fire detection research project-Phase II, Task1: Fire detectors, Fire scenarios
and Test protocols, Fire Research program, Institute for Research in Construction, National Research Council of Canada, Canada.
Liu, Z.G., Crampton, G, Kashef, A., Lougheed, G.D., and Gibbs, E., and S. Muradori. 2008. International road tunnel fire detection research project-Phase II, Task2: Full-scale fire tests in a laboratory tunnel for study of tunnel fire detection technologies, Fire Research program, Institute for Research in Construction, National Research Council of Canada, Canada.
Liu, Z.G., Crampton, G, Kashef, A., Lougheed, G.D., and Gibbs, E., and Muradori, S. 2008. International road tunnel fire detection research project-Phase II, Task 4: Field fire tests on performance of fire detection systems in an operating orad tunnel in Montrea, Fire Research program, Institute for Research in Construction, National Research Council of Canada, Canada.
Liu, Z.G., Crampton, G, Kashef, A., Lougheed, G.D., and Gibbs, E., and Muradori, S. 2008. International road tunnel fire detection research project-Phase II, Task 7: Full-sacel ventilated fire tests in a laboratory tunnel for study of tunnel fire detection technologies, Fire Research program, Institute for Research in Construction, National Research Council of Canada, Canada.
McGrattan K. B., and G. P. Forney. 2006. Fire Dynamics Simulator (Version 4) - User Guide. NISTIR 6784, National Institute of Technology and Standards, USA.
Mulholland G.W. 2002. SFPE Handbook of Fire Protection Engineering, chapter Smoke Production and Properties. National Fire Protection Association, Quincy, Massachusetts, 3rd edition.
Notarianni, K. A.; Evans, D. D.; Walton, W. D. 1993. Smoke production from large oil pool fires. Interscience Communications Ltd.; National Institute of Standards and Technology; Building Research Establishment; and Society of Fire Protection Engineers. Interflam 1993. (Interflam '93). Fire Safety. International Fire Conference, 6th. Oxford, England, Interscience Communications Ltd., London, England, Franks, C. A., Editor(s), 111-119 pp,
List of Figures
Figure1. Model description.
Figure 2. Schematic of thermocouple and smoke meter locations. (Kashef et al. 2008b)
(a) Fire under the vehicle (b) Fire behind the vehicle
Figure 4. Simulated temperature contour obtained from Simulation Tun4VF3.
Figure 5. Simulated temperature contour obtained from Simulation Tun4VF6.
Figure 6. Simulated temperature contour obtained from Simulation Tun4VF8.
15 20 25 30 35 40 45 50 55 60 0 50 100 150 Time ( s ) T em p er at u re ( 'C ) Tun4VF6 Tun4VF3 Tun4VF8 Test6 Test3 Test8
Figure 7. The ceiling temperature variation over time obtained at 30 m downstream of the fire. Fire Fan 15 30 45 60 90 105 120 135 150 165 180 195 210 225 240 255 270 285 300 315 330
Distance from west end of the tunnel (m)
T em p ear at u re ( 'C )… Sim T1Sim T2 Sim T3 Sim T4 Sim T5 Test T1 Test T2 Test T3 Test T4 Test T5
Figure 8. The time-averaged temperature variation along the central cross section of the tunnel for Tun4VF3.
Fire Fan 15 30 45 60 90 105 120 135 150 165 180 195 210 225 240 255 270 285 300 315 330
Distance from west end of the tunnel (m)
T em p ear at u re ( 'C )… Sim T1 Sim T2 Sim T3 Sim T4 Sim T5 Test T1 Test T2 Test T3 Test T4 Test T5
Figure 9. The time-averaged temperature variation along the central cross section of the tunnel for Tun4VF6.
Fire Fan 15 30 45 60 90 105 120 135 150 165 180 195 210 225 240 255 270 285 300 315 330
Distance from west end of the tunnel (m)
T em p ear at u re ( 'C )… Sim T1 Sim T2 Sim T3 Sim T4 Sim T5 Test T1 Test T2 Test T3 Test T4 Test T5
Figure 10. The time-averaged temperature variation along the central cross section of the tunnel for Tun4VF8.
0 0.1 0.2 0.3 0.4 0 50 100 150 200 250 Time ( s ) S m ok e opt ic al D ens it y Tun4VF6 S1 Tun4VF6 S2 Test6 S1 Test6 S2
Figure 11. The smoke optical density variation over time at Drop 2 (from Tun4VF6).
0 0.1 0.2 0.3 0.4 0 15 30 45 60 75
Distance from the fire ( m )
S m o ke o p ti cal d en si ty Tun4VF3 Test3 Tun4VF6 Test6 Tun4VF8 Test8
Figure 12. The smoke optical density near the ceiling with respect to the distance from the fire.