Characterization and Mitigation of Crud at Pressurized Water Reactor Conditions by
Ittinop Dumnernchanvanit B.S., Nuclear Science and Engineering University of Illinois, Urbana Champaign, 2005
Submitted to the Department of Nuclear Science and Engineering in partial fulfillment of the requirements for the degree of Doctor of Philosophy in Nuclear Science and Engineering
at the
Massachusetts Institute of Technology June 2017
©2017 Massachusetts Institute of Technology. All rights reserved.
Author . . . . Department of Nuclear Science and Engineering
May 25, 2017
Certified by . . . . Michael P. Short Assistant Professor, Nuclear Science and Engineering Thesis Supervisor Certified by . . . .
Lin-wen Hu Principal Research Scientist, Nuclear Reactor Laboratory Thesis Reader
Accepted by . . . . Ju Li Batelle Energy Alliance Professor of Nuclear Science and Engineering Professor of Materials Science and Engineering Chair, Department Committee on Graduate Students
Characterization and Mitigation of Crud at Pressurized Water Reactor
Conditions
by
Ittinop Dumnernchanvanit
Submitted to the Department of Nuclear Science and Engineering on May 25, 2017, in partial fulfillment of the
requirements for the degree of
Doctor of Philosophy in Nuclear Science and Engineering
Abstract
The nuclear industry is no exception when it comes to those affected by fouling deposit problems. Fouling deposits on fuel rods in nuclear reactors, known as crud, can cause a variety of undesirable effects including axial power shifts, accelerated corrosion, increased primary circuit radiation dose, and possible fuel failure. This study revisits the crud problem once again using a newly constructed Internally Heated Testloop For PWRs (IHTFP) and new analytical techniques, and attempt to find a way to prevent or mitigate crud, or at least better understand it. This is the first time that fuel-rod coatings are examined as a way of countering crud growth. These coatings are chosen based on their surface chemical properties and robustness at PWR conditions. For the goal of gaining a better understanding of crud, this study is the first to apply fractal analysis to characterize crud. To achieve both of these goals, the IHTFP was built to obtain crud grown under the PWR thermal-hydraulic and chemical conditions. The crud-resistant coatings experiments show significantly reduced crud surface coverage, indicating reduced crud adhesion, for TiC and ZrN coatings. The results roughly agree with London-van der Waals theoretical force predictions, suggesting that London-VDW forces are responsible for the adhesion of crud to fuel cladding. This knowledge can be useful in designing better crud-resistant materials. The fractal analysis can provide a simple, effective way to characterize the macro-scale behavior of crud with its micro-scale properties. The fractal analysis experimental study found R2 values to be very close to one when applying the box-counting method to crud, which is one piece of evidence to support the usage of fractal analysis on crud. Moreover, a strong logarithmic relationship trend between fractal dimension and porosity was found. This relationship applies to both the IHTFP’s and Westinghouse loop’s crud, even though the two experimental setups used different crud precursors and heat flux. This could indicate that crud’s fractal dimension is dependent only on porosity. This relationship could simplify crud modeling and lead to better predictions of crud’s behaviors. Better predictions can lower margins, leading to more efficient reactors.
Thesis Supervisor: Michael P. Short
Title: Assistant Professor, Nuclear Science and Engineering Thesis Reader: Lin-wen Hu
Acknowledgments
I would like to extend my sincere gratitude to Professor Michael Short for his continuous support and guidance of this Ph.D project. With his patience, motivation and tremendous knowledge, we were able to undertake such ambitious project and complete it despite various technical hurdles. I was extremely lucky to be able to work, with someone as brilliant as Professor Michael Short. My admiration for him is not only confined to science but extend to the way he leads our research group, kept everyone motivated, and beyond.
Also, I am very grateful for having late Professor Mujid Kazimi as my former thesis reader, who gave a lot of great insights in all the committee meetings that we have had. It was my great honor to be able to receive comments and feedbacks from someone who is at the zenith of his field like Professor Mujid Kazimi.
I am also very lucky to have Dr. Hu as my thesis committee. She shared many important advice for both my thesis and experiment.
Professor Baglietto for reviewing and advising me on the thesis writing.
I am also incredibly fortunate to have Peter Stahle helping with the construction of the loop. Without his help and kindness, all the technical hurdles would have taken far longer and the crud loop would take far longer to complete.
Prof. Ron Ballinger for a donation of many of the components for the auxiliary loop, and letting us take many pieces of equipment from his lab.
I would also like to acknowledge Dr. Thomas Mckrell for his various helping advices during the IHTFP design and construction.
During the assembly of the crud loop, it would have been taken a lot longer if it was not for the skills and expertise of Naiqi Zhang.
Alexander Delmore, Gilberto Mota, and Sean Robertson for their help with building and running the IHTFP.
Special Thanks to Dr. Koroush Shirvan for his great help with his great help using Star-CCM+ program.
Dr. Moodera, Renan for his advice regarding sputtering coating of samples Dr. Kurt Broderick for his many advice with the biphilic coatings.
Dr. Shiahn Chen for teaching me how to use scanning electron microscopes. Vikash Kumar for his SEM expertise.
Miaomiao for her help with MAMBA-BDM
Lastly, I would like to thank my family and friends for their support through my many years at the institute as PhD student.
Contents
1 INTRODUCTION 13
1.1 Fouling in Energy Systems . . . 13
1.1.1 What are Fouling Deposits? . . . 14
1.1.1.1 Definition and Formation Mechanisms of Fouling Deposits . . . 14
1.1.1.2 The Undesirable Effects of Fouling . . . 20
1.1.2 Crud: Fouling in Light Water-Cooled Nuclear Reactors . . . 22
1.1.3 Why Is Studying Crud Important? . . . 24
1.1.3.1 Crud as a Bottleneck in Power Uprates . . . 25
1.1.3.2 Degradation of Heat Transfer . . . 26
1.1.3.3 Increased Pressure Drop . . . 26
1.1.3.4 Crud-Induced Power Shift (CIPS) . . . 26
1.1.3.5 Crud-Induced Localized Corrosion (CILC) . . . 27
1.1.4 Obstacles to Eliminating Crud . . . 28
1.2 Objectives of the thesis . . . 28
1.2.1 Our approach to obtaining Crud samples . . . 29
1.2.2 Our approach to mitigating or preventing Crud . . . 29
1.2.3 Our approach to analyzing Crud . . . 29
1.3 Key Scientific & Engineering Contributions . . . 31
1.3.1 Engineering Contributions . . . 31
1.3.2 Scientific Contributions . . . 33
1.4 Description of chapters . . . 34
2 BACKGROUND 36 2.1 Fouling and Adhesion in Energy Systems . . . 36
2.1.1 Definition and Formation Mechanism of Fouling Deposits . . . 36
2.1.2 Important Parameters of Precipitation Fouling Deposits . . . 44
2.1.2.2 Microscopic parameters . . . 46
2.1.3 Effects of fouling deposits in heat transfer system . . . 52
2.1.3.1 Pressure drop . . . 52
2.1.3.2 Reduction in Heat Transfer Efficiency . . . 53
2.1.4 Fouling Deposit Mitigation Strategies in heat transfer system . . . 54
2.2 Crud and Fouling in Nuclear Reactor Primary Circuits . . . 56
2.2.1 What is Crud? . . . 57
2.2.2 Origins of Crud . . . 58
2.2.2.1 Corrosion of reactor internals . . . 58
2.2.2.2 Mass transport in the primary circuit . . . 63
2.2.2.3 Sub-cooled boiling and deposition . . . 63
2.2.3 Characteristics of Crud . . . 66
2.2.3.1 Examples of crud in PWR . . . 66
2.2.3.2 Structure . . . 68
2.2.3.3 Composition . . . 71
2.2.4 Important Parameters of Crud Deposits . . . 72
2.2.4.1 Macroscopic Parameters . . . 72
2.2.4.2 Microscopic Parameters . . . 78
2.2.5 Effects of Crud . . . 83
2.2.5.1 Crud-Induced Power Shift (CIPS) . . . 83
2.2.5.2 Crud-Induced Localized Corrosion (CILC) . . . 86
2.2.5.3 Increased worker dose . . . 88
2.2.5.4 Reactor Design and Operation Limitation . . . 90
2.2.5.5 Conclusion on Effects of Crud . . . 91
2.2.6 Previous Studies on Crud . . . 91
2.2.6.1 Modeling Crud Growth . . . 91
2.2.6.2 Experiments Simulating Crud in PWR Conditions . . . 98
2.2.7 Prevention or Mitigation of Crud . . . 104
2.2.7.1 Primary water chemistry modification . . . 104
2.2.7.2 Surface modifications . . . 107
2.2.7.3 Ultrasonic cleaning . . . 109
2.2.7.4 Fuel shuffling schemes . . . 109
2.3 Fractal Analysis for Crud . . . 111
2.3.1 Fractals in Nature . . . 111
2.3.2 Crud Fractal Analysis Problem . . . 114
2.3.4 Fractal Dimensions . . . 115
2.3.5 Fractal Permeation Model . . . 117
2.3.6 Fractal Tortuosity Dimension (dT) . . . 119
2.3.7 Fractal Area Dimension (dN) . . . 119
2.3.8 Methods for Obtaining Fractal Dimension . . . 120
2.3.9 Obtaining Fractal Dimensions via Box-Counting Method . . . 123
2.3.9.1 Preprocessing images for the box-counting method . . . 126
2.3.9.2 Box-counting method . . . 131
2.3.9.3 Fixed Grid Scan . . . 132
2.3.9.4 Sliding Box Scan . . . 133
2.3.9.5 Subsampling and local dimension scan . . . 133
2.3.10 Uncertainty for Fractal Parameters . . . 134
2.4 Adhesion Forces . . . 135
2.4.1 Types of Adhesion Forces . . . 135
2.4.1.1 Coulombic Force . . . 135
2.4.1.2 Magnetic Force . . . 135
2.4.1.3 Chemical Bonding . . . 136
2.4.1.4 Hydrogen Bonding . . . 136
2.4.1.5 Van der Waals Force . . . 136
2.4.2 Van der Waals forces and Hamaker constant . . . 136
2.4.2.1 Approximating the Hamaker constant . . . 140
2.4.2.2 Tabor-Winterton Approach: . . . 140
2.4.2.3 Single Oscillator Model Approach: . . . 142
2.4.2.4 Surface Energy Relation to Hamaker: . . . 142
2.4.2.5 Additional knowledge useful for calculating Hamaker constant . . . 143
2.4.2.6 Effect of temperature on Hamaker constant . . . 143
2.4.2.7 Index of refraction and dielectric constant relationship . . . 144
2.4.2.8 Critical surface tension of solid and, the surface free energy of solid relationship: . . . 145
2.4.2.9 Implication of Van der Waals Force Background . . . 148
2.5 Implications of Background to Controlling Crud . . . 148
2.5.1 The approaches to preventing and mitigating crud . . . 148
2.5.2 Benefits of crud prevention and mitigation . . . 149
3 DESIGN AND CONSTRUCTION OF THE IHTFP TEST FACILITY 151 3.1 Experimental Overview . . . 151
3.2.1 Overview of the crud loop . . . 152 3.2.2 Main Loop . . . 152 3.2.2.1 Pressure Control . . . 155 3.2.2.2 Temperature Control . . . 155 3.2.2.3 Flow control . . . 157 3.2.3 Auxiliary loop . . . 158
3.3 Crud Loop Preliminary Design . . . 159
3.3.1 Design Considerations . . . 159
3.3.2 Crud Loop Design Parameters . . . 164
3.3.3 Pressure Drop Calculations . . . 165
3.3.4 Heater Calculations . . . 166
3.3.4.1 Heat transfer calculation . . . 166
3.3.5 Autoclave Geometry Considerations . . . 171
3.3.6 Computational Fluid Dynamics (CFD) Model . . . 174
3.3.7 Finite Element Stress Analysis . . . 174
3.4 Crud Loop Parameter Controls . . . 177
3.4.1 Pressure Control . . . 177
3.4.2 Temperature Control . . . 179
3.4.3 Flow Control . . . 180
3.5 Crud Loop Measurement and Instrumentation . . . 180
3.5.1 Pressure Measurement . . . 180
3.5.2 Temperature Measurement . . . 182
3.5.3 Flow Measurement . . . 182
3.5.4 pH Measurement . . . 184
3.5.5 Dissolved Oxygen Measurement . . . 185
3.5.6 Conductivity Measurement . . . 186
3.6 Crud Loop Components (and Equipment Selections) . . . 187
3.6.1 Main Loop . . . 187
3.6.1.1 Autoclave Components . . . 189
3.6.1.2 Heating Tape Control Components . . . 195
3.6.1.3 Pressure Control Components . . . 200
3.6.1.4 Flow Control Components . . . 203
3.6.1.5 Safety Components . . . 208
3.6.1.6 Other Components . . . 210
3.6.2 Auxiliary Loop . . . 213
3.6.2.2 Flow Sensor . . . 219
3.6.2.3 Valves and Actuators . . . 223
3.6.2.4 Pressure Transmitter . . . 224
3.6.2.5 Back Pressure Regulator . . . 224
3.6.2.6 Sample Cooler . . . 225
3.6.2.7 Water Tank . . . 228
3.6.2.8 Argon Tank . . . 228
3.6.2.9 Deionization System . . . 230
3.6.2.10 Gas Exhaust Flasks . . . 231
3.6.2.11 Neslab Cooling Water Heat Exchanger System . . . 231
3.7 Data Acquisition and Control System . . . 232
3.7.1 Control Program . . . 232
3.7.2 Electronics . . . 233
3.7.2.1 Agilent Data Acquisition and Control Unit . . . 234
3.7.2.2 Crud Loop Relay Box . . . 236
3.7.2.3 Valves Relay Casing . . . 237
3.7.2.4 Heating Tape Controller System Wiring Diagram . . . 238
3.7.2.5 Connecting Plugs . . . 238
3.7.2.6 Heating Tape Controller System Wiring Diagram . . . 241
3.8 Safety Systems . . . 242
3.8.1 Safety Relief Valves . . . 242
3.8.2 Pressure Switch . . . 243
3.8.3 Closed Room . . . 243
3.8.4 Polycarbonate Shield . . . 244
3.8.5 Electrical System . . . 244
3.9 Operation of the IHTFP . . . 244
3.9.1 Precautions before operating the loop . . . 245
3.9.2 Preparing the Water . . . 245
3.9.2.1 Filling Up the Water Tank . . . 247
3.9.2.2 Deionizing the Water . . . 247
3.9.2.3 Removing Oxygen . . . 247
3.9.2.4 Adding Crud Particles, Boric Acid and Lithium Hydroxide . . . 248
3.9.3 Top Flange and Heating Rod Assembly Insertion . . . 249
3.9.4 Filling Up the Loop . . . 250
3.9.5 Pressurizing . . . 252
3.9.5.2 Back-pressure regulator valve position . . . 254
3.9.5.3 How to begin pressurizing . . . 254
3.9.5.4 Start data acquisition . . . 254
3.9.6 Flow Control . . . 254
3.9.7 Heating the System . . . 255
3.9.7.1 How to Operate Autoclave Heating Controller . . . 255
3.9.7.2 How to Operate Heating Tapes . . . 257
3.9.7.3 Heating up the System . . . 258
3.9.8 Cooling the System . . . 259
3.9.9 Depressurizing the System . . . 259
3.9.10 Draining the Loop . . . 259
3.9.11 Top Flange and Heating Rod Assembly Removal . . . 260
3.9.12 Safety Precautions During Loop Operation . . . 260
3.10 Maintenance of the Loop . . . 261
3.10.1 Replacing Autoclave Windows . . . 261
3.10.2 Replacing the Argon Tank . . . 261
3.10.3 Replacing Vacuum Pump Oil . . . 262
3.10.4 Replacing the Ion-Exchange Column . . . 262
3.11 Troubleshooting . . . 262
3.11.1 Troubleshooting in the Case Pressurization is Not Achieved . . . 262
3.11.2 The Autoclave Controller Box Remains Shutdown . . . 264
3.11.3 Neslab Heat Exchanger Stopped Working . . . 265
3.11.4 Failure to Get to the Desired Temperature . . . 265
3.12 Example Raw Data Outputs from the Loop . . . 266
4 EXPERIMENTAL AND ANALYTICAL METHODOLOGY 273 4.1 Introduction . . . 273
4.2 Experimental Matrix & IHTFP Parameters . . . 273
4.2.0.1 Trial A: First Test Growth Trial (August 28, 2015) . . . 274
4.2.0.2 Trial B: Fractal Analysis Trial (September 22, 2015) . . . 274
4.2.0.3 Trial C: Crud-Resistant Trial (Febrary 12, 2016) . . . 275
4.2.0.4 Trial D: Crud-Resistant Trial (March 18, 2016) . . . 276
4.2.0.5 Failed Trials . . . 277
4.3 Preparing Test Samples . . . 279
4.3.1 Reasons for Using Sample Rings . . . 279
4.3.2 Surface-Chemistry Modification for Crud Resistance . . . 280
4.3.2.2 How Should It Work? . . . 281
4.3.2.3 Material Selection . . . 281
4.3.3 Fabrication . . . 281
4.3.3.1 Machining . . . 283
4.3.3.2 Electropolishing . . . 283
4.3.3.3 Coating Sample Rings with Crud-resistant Materials . . . 284
4.3.3.4 Press-Fitting . . . 285
4.4 Analysis Methodology . . . 287
4.4.1 Fractal Analysis of Crud . . . 287
4.4.1.1 SEM/FIB Images to Obtain . . . 287
4.4.1.2 Binary Image Processing . . . 288
4.4.1.3 Values to Obtain . . . 295
4.4.1.4 Plots to Obtain . . . 298
4.4.1.5 Testing Fractal Dimensions on the MAMBA-BDM Crud Model . . . 298
4.4.2 Crud-Resistant Surface Modification . . . 299
4.4.2.1 SEM Images to Obtain . . . 299
4.4.2.2 Binary Image Processing . . . 299
4.4.2.3 Values to Obtain . . . 299
4.4.2.4 Plots to Obtain . . . 302
4.4.3 Loop Conditions . . . 302
5 RESULTS 304 5.1 Introduction . . . 304
5.2 Fractal Analysis of Crud . . . 304
5.2.1 Loop Conditions . . . 304
5.2.1.1 Trial B (September 22, 2015) . . . 305
5.2.2 Images . . . 309
5.2.2.1 Trial B (September 22, 2015) . . . 309
5.2.2.2 WALT loop sample . . . 327
5.2.3 Quantitative Results . . . 330
5.2.3.1 Crud Thickness . . . 331
5.2.3.2 Porosity . . . 332
5.2.3.3 Fractal Dimensions . . . 332
5.2.3.4 Porosity vs Height Position . . . 332
5.2.3.5 Fractal Dimension vs Height Position . . . 333
5.2.3.6 Fractal Dimension vs Porosity . . . 334
5.3.1 Loop Conditions . . . 335 5.3.1.1 Trial C (February 12, 2016) . . . 335 5.3.1.2 Trial D (March 18, 2016) . . . 336 5.3.2 Images . . . 342 5.3.2.1 Trial C (February 12, 2016) . . . 342 5.3.2.2 Trial D (March 18, 2016) . . . 378 5.3.3 Quantitative Results . . . 405 6 DISCUSSION 409 6.1 Fractal Analysis Discussions . . . 409
6.1.1 Is Crud Fractalline? . . . 409
6.1.2 Porosity/Fractal Dimension vs Height Relationship . . . 412
6.1.3 Fractal Dimension vs Porosity Relationship . . . 412
6.1.4 Other Literature that Explored Fractal Dimension vs Porosity . . . 413
6.1.5 Fractal Result’s Effect on the MAMBA-BDM Crud Model . . . 415
6.2 Crud-resistant Surface Coating . . . 416
6.2.1 Effectiveness of Crud-resistant Surface Coatings . . . 420
6.2.2 Relationship Between Crud Area Reduction and Refractive Index . . . 420
6.2.3 Relationship Between Crud Area Reduction and AFM Experimental Data . . 421
6.3 Sources of Experimental Error . . . 423
6.3.1 Heating Element Manufacturing Imperfections . . . 423
6.3.2 Uneven Mixing of Nickel Oxide particles . . . 423
6.3.3 Uneven Roughness on Sample Ring Surfaces . . . 423
6.3.4 Gap Between Sample Ring and Heater Tube . . . 424
6.3.5 Unequal Heating Along the Heating Rod’s Length . . . 424
6.4 Experimental Improvements . . . 424
6.4.1 Heating Rod Procurement . . . 424
6.4.2 Sapphire Windows . . . 425
6.4.3 Laser Triangulation . . . 425
6.4.4 Raman Spectroscopy . . . 426
6.5 Future Experiments . . . 426
6.5.1 AFM at PWR conditions . . . 426
6.5.2 Experimental Measurement of Refractive Indexes . . . 426
6.5.3 Testing of Materials with Very Low Refractive Index . . . 426
6.5.4 Hydrophobic/Biphilic Crud-Resistant Coatings . . . 427
6.5.4.1 Hydrophobic Crud Resistant Coating . . . 427
6.5.4.3 Text Matrix & Loop Parameter . . . 437
6.5.4.4 Procedure in Fabricating the Biphilic Surfaces . . . 437
6.5.5 Low Surface Energy Material . . . 439
6.5.5.1 Self-cleaning . . . 440
6.5.5.2 Combination with Biphilic . . . 441
6.5.5.3 Limitations . . . 441
7 CONCLUSION 442 7.1 Summary of Findings . . . 443
7.1.1 Fractal Analysis . . . 443
7.1.1.1 R2 Values Close to One in the Box-counting Method Indicates that Crud is Fractalline . . . 443
7.1.1.2 Crud Porosity vs. Height from Cladding Relationship . . . 443
7.1.1.3 Crud Fractal Dimension vs. Height from Cladding Relationship . . 443
7.1.1.4 Crud Porosity vs. Fractal Dimension Relationship . . . 444
7.1.1.5 Fractal Result’s Effect on the MAMBA-BDM Crud Model . . . 444
7.1.2 Crud-resistant Fuel-rod Coating . . . 444
7.1.2.1 Effectiveness of Crud-resistant Coating Materials . . . 444
7.1.2.2 Crud Porosity vs. Fractal Dimension Relationship . . . 444
7.1.2.3 Crud Area Coverage Reduction vs. AFM Adhesion . . . 445
7.2 Major Contributions . . . 445
Chapter 1
INTRODUCTION
1.1 Fouling in Energy Systems
Fouling is defined as an accumulation of unwanted substances on fluid-facing surfaces. The mate-rials which constitute fouling deposit come in various forms, including matemate-rials such as corrosion products, organic materials, and living substances. It is usually detrimental to the system in which it occurs. Fouling deposits are a ubiquitous problem affecting a wide range of industries, such as coal power plants, petroleum refineries, nuclear reactors, shipping, and many other processes utilizing heat exchanger systems.
The accumulation of fouling deposits in any system can lead to various problems. In general, fouling deposits usually cause issues with decreasing heat transfer efficiency, increasing fluid friction, and increasing corrosion under the deposit [1]. For example, in a coal-fired power plant, fouling of heat transfer surfaces by the fly ash produced during coal combustion affects its main boiler. Ashes that accumulate on a boiler’s heat transfer surface lead to decreased heat transfer, and have an adverse effect on the boiler’s safety and cost [2, 3]. In petroleum refining and production, fouling can increase the resistance to heat transfer and fluid flow. This results in significant energy losses and safety concerns for petroleum refineries and pipelines [4].
To compensate for the effects that accumulating fouling deposits have on any particular process, system operators need to incur extra costs for maintenance, cleaning, and mitigation of the fouling deposits. In one study, the total fouling related costs for major industrialized nations were estimated at around US$4.4 billion annually [5]. In a less conservative estimate that includes the loss of production from fouling, the total effect of fouling on the economy could be as high as 0.25% of the GDP in industrialized nations [6]. The nuclear industry is no exception when it comes to those affected by fouling deposits. This thesis will focus specifically on fouling deposits that grow in nuclear reactor cores.
Inside nuclear reactors, zirconium alloy fuel claddings within the reactor vessel house nuclear fuel, normally based on uranium, used to create the nuclear reaction. Fouling on the surface of these fuel claddings still remains one of the main challenges in achieving higher burnup and power uprates for nuclear power plants [7, 8]. In the nuclear industry, this type of fouling deposit is known as Chalk River Unidentified Deposit (crud), named after the location (The Chalk River Laboratory in Canada) where it was first recorded. If the crud problem is ignored or left untreated, it can jeopardize the integrity of nuclear fuel rods [7]. A more detailed look at what fouling deposits in general and crud in particular are, and their effects on the systems on which they accumulate will be presented below.
1.1.1 What are Fouling Deposits?
Fouling is the accumulation of undesirable substances on top of fluid-facing surfaces. Examples of fouling include deposits in heat exchanger tubing, lime scale buildup inside pipes, or even layers of mussels growing on pipes near the sea. In most cases, these deposits are detrimental to the function of the system on which they accumulate. For instance, fouling deposits on a heat exchanger will decrease heat transfer and make that heat exchanger less effective. Fouling in filters can clog the filter, rendering it unusable [9]. In addition, fouling deposits on fuel rods of a nuclear reactor are detrimental to cladding surface heat transfer, and in the case of pressurized water reactor (PWRs) they accumulate boron used to control the nuclear reaction, causing axial power shifts and accelerated corrosion. Although the term “fouling deposit” is often used to describe situations where unwanted substances accumulate, the actual underlying process that causes fouling in different systems varies considerably from system to system. The section below introduces more details on various forms of fouling.
1.1.1.1 Definition and Formation Mechanisms of Fouling Deposits
“Fouling” is a word used to describe the general phenomenon of the adhesion of unwanted substances or organisms to material surfaces. Within the umbrella of fouling, there are multiple mechanisms that are very different from each other in their nature. Fouling mechanisms can be categorized into six categories: particulate fouling, corrosion fouling, crystallization fouling, reaction fouling, biological fouling, and solidification fouling. This section will briefly explain each of these mechanisms with a few illustrative, real-world fouling deposit examples. For further details on each type of fouling, please refer to the background section 2.1.
Particulate fouling. The most important fouling mechanism upon which this thesis is focused is particulate fouling. This is the driving mechanism behind crud formation on the fuel rods within PWRs. It occurs in any system with fluids containing colloidal particulates. In particulate fouling,
particles are transported to heat transfer surfaces by a working fluid, where they can attach them-selves by mechanisms such as adsorption [10] or adhesion [11]. One example of particulate fouling is the ash fouling in coal power plants, where ashes deposit in the convection area of the boiler. This happens because the inorganic elements that are vaporized during coal combustion may recondense upon contact with lower temperature surfaces, to form a type of glue between the ash particles and heating surfaces [12, 13]. Figure 1-1 shows fouling on the superheater tubes in a coal-fired power plant. The fouling can be seen as fluffy layers on the lower part of the superheater tubes.
Figure 1-1: Ash fouling on superheater tubes in a coal-fired power station [14]. The fouling deposits are the fluffy layers on the bottom of the superheater tubes.
Reaction Fouling. Reaction fouling is caused by a chemical reaction inside the fluid stream within the system. Reactions between soluble precursors in the stream can turn into insoluble foulants, which sometimes deposit on surfaces. Metallic heat transfer surfaces can also act as cata-lysts for these chemical reactions [15]. Reaction fouling commonly occurs in the oil industry, where heat exchangers used in crude oil distillation plants can be fouled with asphaltenes. Food industries such as the milk processing industry may also experience chemical reaction fouling , by either protein or calcium ion adsorption [15]. Figure 1-2 shows the asphaltenes chemical reaction fouling on the heat transfer surface of a heat exchanger in a crude oil refinery.
Figure 1-2: This image shows the asphaltenes fouling on the heat transfer surface of a heat exchanger in a crude oil refinery. This is a common type of chemical fouling [16].
Corrosion Fouling Corrosion fouling is similar to reaction fouling in that it involves chemical reactions. For reaction fouling, the reactions that produce fouling deposit precursors occur between constituents of the process fluid. On the other hand, for corrosion fouling, the reactions that produce fouling precursors occur between the process fluid and heat transfer surface [17]. When corrosion occurs on the heat transfer surface and the corrosion product is not soluble, it will accumulate on the originating heat transfer surface. One example of corrosion fouling is the reddish orange rust on carbon or low alloy steel. When steel corrodes, the iron oxide corrosion product does not form a protective layer, nor does it dissolve. Instead, the iron oxide accumulates as porous reddish corrosion fouling commonly referred to as rust [18]. Figure 1-3 shows an example of this type of corrosion fouling.
Figure 1-3: This image shows an example of corrosion fouling, in the form of red rust produced by the corrosion of low-alloy steel with surrounding water. The fouling material results from the reaction between the process fluid and heat transfer surface [16].
Precipitation Fouling (Crystallization Fouling/Scaling) Precipitation fouling, also known as crystallization fouling, happens when salts, oxides, or hydroxides from solution crystallize on the surfaces of fluid-facing materials. It occurs when the concentration of solutes exceeds the saturation concentration in the solvent. When this happens, solutes will start to crystallize, leading to the precipitation of solids on the fluid system surface. The reason that the concentration of solutes can exceed the saturation concentration could be driven by changes in temperature, or solvent evapora-tion. Particulate fouling typically occurs in liquid, soluble salt, or aqueous solutions. It could occur with both soluble salts with normal or inverse solubility [17].
Precipitation fouling is especially common in salts with inverse solubility. For salts with normal solubility, the solubility will increase with increasing temperature. On the other hand, the opposite will happen to salts with inverse solubility. In this case, the solubility of salt will decrease as the temperature rises. If a solution with inverse solubility is heated, crystalline precipitates will form and deposit on heat transfer surfaces [17]. If fouling happens from inorganic salts in water, it is called scaling. In the case that the precipitate settles because of gravity, the fouling layer is called sedimentation fouling. The most common example of precipitation fouling is the limescale deposit as shown in figure 1-4, commonly found throughout the world in residental and industrial water pipes. If a heat exchanger uses hard water, or water with a high mineral content, limescale may form as the water is heated causing the solutes with inverse solubility to precipitate. This phenomenon is shown in figure 1-4 [19, 20].
Figure 1-4: This figure shows a limescale layer in a heat exchanger pipe. Its thickness reduces the area through which the fluid can flow, and deteriorates the heat exchanging capacity of the pipe [21].
Solidification Fouling (Freezing Fouling) Solidification fouling or freezing fouling occurs when a component of the fluid freezes on a heat transfer surface, hence the name [9]. This solidifi-cation of fluid could lead, for example, to the separation of wax when a hydrocarbon-based process fluid comes into contact with a colder surface, fouling deposition in phenol coolers, and formation of ice layers in chilled water production. The parameters that may affect solidification fouling include temperature, mass flow rate, surface conditions, and the chemistry of the process fluid [17]. This type of fouling is very important to oil refineries and pipelines. The paraffin in crude oil can precip-itate and accumulate into a fouling deposit under appropriate environmental conditions as shown in figure 1-5. These fouling buildups in oil pipelines and oil refineries can effectively choke the flow of hydrocarbon [9].
Biofouling When a fouling deposit is caused by biological organisms such as bacteria, algae, or barnacles and other sea creatures, it is called biofouling. Biofouling is generally controlled by the use of chemical agents such as chlorine [22, 23]. It can be separated into two types, microbial fouling, and macrobial fouling. Microbial fouling involves microorganisms such as algae, fungi, yeast, and bacteria. Macrobial fouling involves larger organisms such as barnacles, mussels, and sea vegetation [17]. Figure 1-6 shows a layer of barnacles macrobial fouling on a ship’s hull. For nuclear power plants, this type of fouling often occurs in the systems that use sea water, such as the condenser in the secondary loop of boiling water reactors (BWRs) or the tertiary loop of PWRs [23].
Composite Fouling Lastly, in many cases, a fouling phenomenon can have multiple causes. Two or more fouling mechanisms mentioned above could be present in the same system. When this
Figure 1-5: Solidification fouling in a petroleum refinery where paraffin solidified from a cooled petroleum product [16]. The dark layer covering the heat exchanger is the paraffin solidification fouling.
occurs, it is called composite fouling. One example of composite fouling is the fouling of condensers in power plants. In some cases, such as the one shown in figure 1-7, fouling could be a result of both scaling deposits as well as corrosion fouling [25, 26]. Another example of composite fouling is the fouling in oil pipelines and refineries. Both asphaltene or wax in crude oil can form a fouling layer in oil pipelines and refineries [9]. When composite fouling is present, the fouling problem becomes very complex [17].
Figure 1-7: Fouling deposits in the condenser of a power plant, composed of both precipitate fouling and corrosion fouling. The dirty yellow-green layers are caused by the scaling of calcium, while the reddish layers are iron oxide corrosion products [27].
1.1.1.2 The Undesirable Effects of Fouling
Fouling is a ubiquitous problem affecting many industries. As mentioned earlier, the estimate of the cost due to fouling is a significant part of the GDP of industrialized nations [5, 6]. The effects of fouling vary among different systems in which it grows. The following subsections explain a few of the most notable detrimental effects of fouling.
Undesirable Effects on Coal-fired Power Plants In a coal-fired power plant, ash fouling of heat transfer surface is one of the main concerns for operation. The likelihood of ash fouling happening in a coal-fired power plant depends on its ash content and how the ash interacts in specific boiler conditions such as its temperature and oxidation condition [28]. The complexity of these interactions makes it very difficult to predict ash fouling. Ash deposits on a coal-fired boiler’s heat transfer surfaces can reduce the power plant efficiency, or in extreme cases, lead to boiler shutdown [14]. A survey by the Electric Power Research Institute (EPRI) in the US showed that 7% of coal-fired power plant units suffer from frequent fouling, while another 40% experience occasional
problems with fouling [2].
Undesirable Effects on the Petroleum Industry Fouling deposits in the oil industry are formed from wax, asphaltenes, inorganic compounds, or all three. When waxes are present, they can increase fluid viscosity and form a layer on refinery or process tubing walls. These layers can constrict the flow through the filters, valves, or in some cases, pipelines. This leads to increased pumping energy and cost, or reduced crude oil production. When asphaltenes are present, they also form a fouling layer which leads to flow restriction, and forces the furnace to fire harder to compensate for the decreased outlet temperature [9, 29]. Overall, when fouling deposits occur in petroleum refineries, they can cause the loss of heat transfer, the blocking of process pipes, under-deposit corrosion, and localized hot spots. The increase in the heat transfer resistance and the blocked fluid flow can cause significant energy loss and safety concerns. These physical effects lead to production losses and heightened maintenance cost [9, 30]. Fouling therefore contributes directly to the emission of a significant amount of carbon dioxide in petroleum refining [4].
Undesirable Effects on Ships Biofouling deposits on ships result in a reduction of speed, an increase in the fuel and maintenance costs, and potentially accelerated corrosion. The reduction in speed is caused by an increase in frictional resistance of the hull when passing through the water. When fouling deposits are present on a ship’s hull, the speed reduction of the ship may be on the order of several knots. Figure 1.1 shows the effect of fouling on different classes of military ships after six months out at sea. The figure clearly shows the significant fuel consumption effect that fouling deposits have on ships. Even in temperate water, the loss of speed could range from 1-2 knots, and the percentage increase in the fuel consumption to maintain certain speeds could be as high as 35%-50%. Note that in the table, the frictional resistance is assumed to increase by 1/4 percent per day. This is the British Admiralty’s frictional resistance value for temperate water, based on its experience. In tropical water, British Admiralty suggested a frictional resistance of 1/2 percent per day, which will lead to even more speed reduction and fuel consumption [23, 31].
Type of Ship DisplacementStandard (Tons) Loss of Maximum Speed (Knots) Percentage Increase in Fuel Consumption to Maintain a Speed of 10 Knots 20 Knots Battleship 35,000 1.5 45 % 40 % Aircraft Carrier 23,000 1.25 45 % 40 % Cruiser 10,000 1.25 50 % 45 % Destroyer 1,850 2 50 % 35 %
Table 1.1: The effect of fouling on military ship speed and fuel consumption, after six months out of dock in temperate water. Frictional resistance is assumed to increase by 0.25% per day. The loss of speed can be significant as shown. The fuel consumption rate percentage increase after six months out of the dock in temperate water could be as high as 50% [31].
1.1.2 Crud: Fouling in Light Water-Cooled Nuclear Reactors
Crud is the term for fouling deposits that grow on fuel cladding inside light water reactor (LWR) cores. This thesis will focus on PWRs, as the effects of even a small amount of crud can be more severe. Note that the term “crud” had been with nuclear industry since 1959, when a research reactor in Canada, located at Chalk River, was testing corrosion of fuel element and found unidentified deposits covering the fuel elements [32]. It is known, that the term “crud” is a bacronym, coined after the discovery of the deposits. Therefore, this thesis will not capitalize the term as “crud.”
To understand how crud deposits occur, one must understand the anatomy of a PWR. A PWR contains two coolant loops – the primary loop, and the secondary loop. Both use water as the coolant. The primary loop flows coolant through the reactor vessel where nuclear reactions take place. The coolant carries heat away from the reactor vessel to the steam generator, a large two-phase heat exchanger. The secondary loop then receives the heat from the primary loop through the steam generator. In the primary loop, coolant water is not supposed to boil, hence the high level of pressurization. To maintain the very high temperature of over 300 ºC, the coolant water inside the primary loop is pressurized to 15.5 MPa [33]. Figure 1-8 is a diagram of a typical PWR primary loop, showing the major components involved in the formation, transport, and deposition of crud. Figure 1-9 and 1-10 exhibit examples of crud deposit layers on BWR and PWR fuel rods, respectively. The following paragraphs will explain how crud forms in the reactor vessel part of the primary loop [34].
Usually, the primary loop’s coolant contains dissolved species and suspended particulates. Some of these chemical species are intentionally added, while some are unavoidably present no matter what. For example, boric acid is intentionally added to control the nuclear reaction, by preferential neutron absorption. Others, such as nickel ferrites, are the result of corrosion of the alloys that made up the primary circuit, such as 300-series stainless steels and 600-series nickel-based alloys [33, 35]. Some of these dissolved species and suspended particulates can accumulate to form crud on the surface of the fuel rods’ claddings, especially on the sections where sub-cooled boiling occurs [33, 36, 37, 38, 39].
Nickel ferrites, nickel oxides, and iron oxides constitute the majority of the particles that even-tually deposit as crud [35]. The PWR water treatment system does not filter these particles well, because they are both too large to be filtered out by mixed-bed ion exchangers and too small for removal by typical particulate filters [40]. Therefore, only a small fraction of these crud-forming particles are properly filtered from the system. Most of these particles remain suspended inside the reactor primary coolant system, and eventually deposit on various surfaces inside the system [36, 41]. The number of suspended particles that form deposits depends on both their concentration within the coolant and the surface area of alloys in contact with the primary coolant. In a typical four-loop PWR, the total primary coolant surface area is approximately 25,000 m2 [33]. The steam
genera-Figure 1-8: This figure shows the diagram of a typical PWR primary loop. The reactor vessel is where fuel rods are situated and where crud grows. The steam generator is where majority of crud particles originate.
tor has the greatest fraction, accounting for approximately 60% of the total primary loop’s coolant surface area as an enormous bundle of bent tubes. The steam generator is typically made of nickel alloys, either alloy 600 or alloy 690, which explains the large nickel content commonly found in crud. Zirconium-alloy fuel cladding, where crud deposits, makes up 25% of the primary coolant contact surface area. The rest of the surface area is from the reactor vessel, pipes, and other components. Most of these components are made of stainless steel alloys, such as 304 or 316, while high pressure valves are often made of cobalt-bearing Stellite [33]. This primary coolant contact surface anatomy can partially explain the composition of crud, which is typically nickel ferrites, nickel oxides, iron oxides, and some zirconium oxides [35]. Finally, while the fuel rods do not form a majority of the reactor internal surface area, there is an expression in the nuclear industry: “There’s no better filter than the fuel.” This refers to the very high ability of fuel rods, especially those undergoing sub-cooled boiling, to trap particulates in the coolant as crud.
Figure 1-9: These two images show examples of heavy crud growth in a BWR at River Bend. Crud is the dirty-looking orange layer covering the fuel rods. The orange crud would suggest the presence of iron oxide, suggesting that there was high oxygen in that plant. It was observed that the thickest crud was very location specific in the River Bend core. [42]
1.1.3 Why Is Studying Crud Important?
Understanding crud is important because it places limits on reactor design and operation, which continue to be the main limiting factors for PWR operation even today. If left unchecked, crud can cause a variety of undesirable effects on the performance of the plant. Specifically, crud can worsen heat transfer, increase pressure drops, elevate primary coolant and surface radiation dose rates, cause crud-induced power shift (CIPS), and lead to crud-induced localized corrosion (CILC). The reduction in heat transfer, the pressure drop increase, and the CIPS still result in expensive actions, such as deoptimized fuel loading patterns or mandatory power level reductions, to offset their effects. CILC can lead to sudden fuel failure, and is much harder to predict [7, 33]. Finally, the activation of crud on fuel rods and its subsequent release into the primary coolant greatly elevates
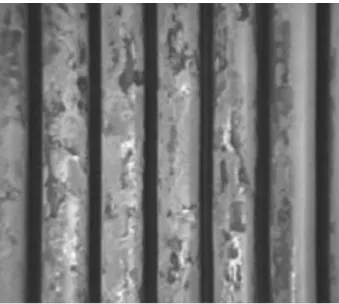
Figure 1-10: Crud deposit on PWR fuel rods in Three Mile Island Unit 1.
radiation dose levels throughout the primary system, creating safety issues for maintenance workers. The following subsections will explain the different types of undesirable effects that crud has on PWRs.
1.1.3.1 Crud as a Bottleneck in Power Uprates
Crud represents one of the main challenges in achieving higher burnup and power uprates in PWRs [7]. Crud prevents the push for power uprates because if the power is increased in the reactor, it will be more likely for sub-cooled boiling events to occur on the surfaces of fuel rods. Sub-cooled boiling events aid the formation of crud. Therefore, unless the operators want to face serious negative effects that come with crud, they have no choice but to lower the power rating to mitigate crud formation. Crud prevents the achievement of higher burnup by limiting the amount of boron that can be added to PWRs. According to the EPRI PWR Primary Water Chemistry Guidelines Volume-1 1999, having a pH below 6.9 when operating a PWR is not recommended [43]. The reason for this suggestion is that a lower pH leads to huge amount of crud by inducing faster corrosion rates on primary coolant-facing surfaces. Pushing for higher burn-up also means that more boron will have to be added to moderate the neutron flux at the beginning of nuclear fuel cycle. Adding more boron or boric acid will push the pH lower, unless extra lithium hydroxide (LiOH) or potassium hydroxide (KOH) is added to maintain the pH. Elevated levels of LiOH have been strongly implicated in accelerated corrosion in PWRs, making this course of action not preferred. If crud’s limitation is removed, reactors can operate at a higher level of boron, lower pH, and higher burnup [43]. Therefore, solving crud problems will remove the design and operation limitations, leading to a more efficient reactor.
1.1.3.2 Degradation of Heat Transfer
In the case that there is no crud, heat normally flows directly from cladding to coolant. On the other hand, having any layer including crud in the way, constitutes an extra thermal resistance. Even though fluid flows through crud, boron precipitation in the crud pores can lead to further heat transfer reduction. Jin/Short (2016) [44] demonstrated through modeling that crud can have a vapor dryout layer, accelerating film boiling. It is generally accepted that fouling deposits worsen heat transfer of the surface on which they grow. However, for crud, the issue is still left open for further research verification. Some studies suggest that crud may actually improve heat transfer, under certain conditions. This improved heat-transfer is the result of mechanism called “wick boiling” [36, 45]. More information on wick boiling can be found in this thesis’ background chapter on crud’s effects. Nevertheless, the uncertainties that go into heat transfer across crud would still be worrying to anyone operating or designing the PWR.
1.1.3.3 Increased Pressure Drop
Similar to other types of fouling deposits, crud growth can also lead to a pressure drop within the system on which they grow. When crud grows, the roughness of the surface bordering flowing fluid may increase, since crud deposits are rougher than metal surfaces. crud’s typical roughness is between 0.5 to 3.0 µm [45], while typical metal roughnesses are below 0.15 µm [46]. The resulting changes in surface roughness will lead to an increase in frictional pressure drop.
In nuclear reactors, this crud pressure drop effect may lead to various side effects depending on where the crud deposits grow. For example, if crud grows or accumulates on a venturi meter used to measure flow rate, the obstruction of the flow instrument can indicate a higher flow rate than reality. If crud grows in the nuclear reactor vessel’s diffuser region, the increased pressure drop can lead to an earlier flow separation, which increases drag and prevents pressure recovery on the diffuser region [47].
1.1.3.4 Crud-Induced Power Shift (CIPS)
During PWR operation, crud can worsen heat transfer from the fuel and accumulate boron. The accumulated boron in crud can cause a power distribution shift. Since boron absorbs neutrons, the places where crud grows and boron accumulates will absorb more neutrons, leading to localized suppression of the neutron flux. This leads to an undesired power distribution shift that can be called either axial offset anomaly (AOA) or crud-induced power shift (CIPS) [48, 49].
One example of such CIPS occurred at the Union Electric Company (UE) Callaway Plant, which was built by Westinghouse. The Callaway Plant is a PWR with a power rating of 3565 MWt. Beginning in cycle 4, the plant operator observed an unexpected power distribution shift towards the bottom of the core. Westinghouse and Union Electric Company concluded that the power
distribution shift was likely caused by the formation of crud [50]. In addition, more aggressive fuel loading patterns may be used if CIPS ceases to be an issue, or fuel fresh feed assemblies may be used in a loading pattern designed for the same burnup. Both of these strategies result in significant cost savings, reaching a few hundred thousand dollars per fuel cycle.
1.1.3.5 Crud-Induced Localized Corrosion (CILC)
As mentioned earlier, crud can accumulate boron inside its layer. Other than that, crud can also induce a temperature rise, either by boiling point elevation due to concentrated soluble species or by inducing vapor dryout, and concentrate many chemical species. The slow fluid flow within crud slows or stops the flushing away of radiolysis products, resulting in a more chemically aggressive environment within any liquid trapped in the pores of crud. All these effects can contribute to heightened corrosion within the crud layer. This heightened corrosion is called crud-induced localized corrosion (CILC) [7]. It was reported by a few US PWR power plants between 1995 to 2000 that crud deposits worsened fuel corrosion. In particular, the TMI-1 experienced as many as nine failed fuel rods that were believed to arise from the heavy buildup of crud deposits at the upper spans on the outer surface of peripheral fuel rods [42]. Figure 1-11 shows an example of a fuel failure caused by the accumulation of a crud deposit. The hole on the middle fuel rod in the figure is a breach in fuel cladding.
Figure 1-11: Example of fuel rod failure caused by crud-induced localized corrosion (CILC) in the River Bend BWR [42]. At the end of cycle 11 at River Bend, six failed fuel assemblies were identified. The hole in the middle fuel rod in the image is one of the fuel failures. The orange coverings around the fuel rods are crud.
1.1.4 Obstacles to Eliminating Crud
Crud has been a problem in nuclear reactors for more than half a century, but still remains unsolved. One probable reason is the difficulty in studying and preventing it. Crud is extremely hard to obtain and work with because of its radioactivity. Recreating crud in a lab is also difficult because of the extreme PWR conditions, and the difficulties associated with precisely replicating the often unspecified or unknown conditions within a PWR. These following subsections will go into more detail on why it is difficult to study crud as well as the ways people had previously explored crud mitigation and prevention.
Real reactor crud samples are very difficult to obtain and are only available to few organizations, specifically those with the capability and hot cells to handle highly radioactive materials. Real reac-tor crud samples are also radioactive, leading to various problems with handling it for experiments. This is why it is rather rare to find literature that actually analyzes a reactor’s crud. A more popular approach to studying crud is through growing it in ex-core experiments. However, the experimental approach to obtaining crud also has many disadvantages. First, growing crud similar to that in PWRs is hard because it is very difficult to recreate the reactor conditions. This is why there are only a few experimental loops worldwide capable of achieving this. Second, it takes a very long time to grow crud. In real reactors, crud grows in an environment where each fuel cycle lasts over a year and a half. That kind of experimental time span is impractical; therefore, in experimental loops, many parameters are tweaked to aid crud growth. Even so, it still takes at least two weeks to grow thick crud similar to that found in a reactor [8]. Many crud experiments will adjust various parameters to simplify the experiment. The obvious downside is that crud samples grown in those experiments may be different from those obtained from nuclear reactors.
The problem of crud has persisted for a very long time and there have been many attempts to prevent or mitigate it in the past. Many techniques for stopping crud had been experimented with and patented, but none have yielded effective results interesting enough to be applied to actual commercial reactors. These techniques include approaches such as electro-polishing of fuel rod surfaces, adding zinc, magnetic filtering, increasing coolant pH, and ultrasonic cleaning [51]. More detailed information for each of these techniques mentioned can be found in the background section. This thesis will address the crud challenge by using fuel cladding surface coating.
1.2 Objectives of the thesis
As shown in the previous section, the fouling deposits on fuel rods, or crud, still remains a significant problem for PWRs. The goal of this thesis is to revisit the crud problem once again, using a newly constructed PWR loop and new analysis techniques, and attempt to find a way to prevent or mitigate crud, or at least better understand it. For the goal of preventing or mitigating crud, our group is
the first to experiment with using fuel-rod coatings as a way of countering its growth. For the goal of gaining a better understanding of crud, our group is also be the first to apply fractal analysis to characterize crud. The following subsections will explain in more detail our actual goals for crud mitigation/prevention, crud analysis, and the way that we achieved them.
1.2.1 Our approach to obtaining Crud samples
As explained above, analyzing real crud isn’t very practical in our case. The real reactor crud sample is very hard to obtain and has critical radioactive hazards. Our best options are to either use computer models to analyze crud or design an experiment that can simulate the conditions as close to that of the the real PWR as possible. Computer modeling of crud will be tackled by another part of our group. Therefore, this thesis will focus on an experimental approach to understanding and mitigating crud.
To be able to experiment with new techniques for preventing crud, as well as gain crud samples to analyze, we chose to build a facility, called the Internally Heated Testloop For PWRs (IHTFP) that can simulate conditions at the PWR fuel cladding surface. crud will be grown on this simulated PWR fuel cladding surface. The IHTFP has the ability to match the temperature and pressure in actual PWRs, as well as non-radioactive chemical conditions. The simulated fuel rod situated inside the IHTFP’s autoclave is the place on which crud will grow. Crud from this facility is what we will use for analysis in the rest of the thesis. In the scope of this thesis, coatings will be applied to the simulated fuel rod surface. The detailed description of how the IHTFP facility was built and is operated can be found in Chapter 3, Design and Construction of the IHTFP.
1.2.2 Our approach to mitigating or preventing Crud
Our approach to mitigating or preventing crud will be to experiment with crud-resistant coat-ings that prevent the adsorption of crud particles onto fuel cladding surfaces. Various chemical surface-modification coatings will be tested to determine if any of them will prevent or mitigate the adsorption of corrosion-product particles. Preliminary results of the crud-resistant coating experi-ments done on a smaller scale in our group, shown in figure 1-12, motivated this approach due to their initial, qualitative success. Therefore, we are taking this experiment to the next step with an experiment using potentially crud-resistant materials in conditions very close to those found in reactors using the IHTFP.
1.2.3 Our approach to analyzing Crud
Another approach to the crud problem is to gain a better understanding of its surface coverage in order to adjust reactor parameters for better optimizations. Since industrially relevant parameters,
Figure 1-12: The two left pictures show how crud particles bonds to Zircaloy-4, while the right picture shows how crud particles do not bond to zirconium carbide. The figures show that crud bonds very well to the zircaloy surface while a clear separation can be seen in the right picture between the crud particle and the zirconium carbide surface [52].
such as the heat-transfer across crud, have been examined many times, especially by the industry themselves, we take a different approach and look deeper into the inner workings of crud. With the rise of more complex computer simulations aided by recent advances in modeling and simulation, we can now properly include many parameters, previously ignored for simplification, in our modeling of crud. The MAMBA-BDM model developed by our group treats crud as a chemical deposition in an environment that varies in concentration of soluble species and heating. The model is based on a complex fractal-based flow geometry, and uses fractal parameters to determine many crucial crud parameters, such as permeability and thermal conductivity. For example, the permeability is calculated by taking into account the porosity, tortuosity, and two fractal dimensions [7]. Despite the fractal parameter’s usefulness in modeling crud structure, the fractal parameters of crud have never been measured. This thesis will bridge this gap by using experimental data to verify the assumptions made, and improve upon the MAMBA-BDM model. Specifically, we will examine both the porosity and the two fractal dimensions of crud. The detailed explanation of the parameter descriptions and the methods of acquiring those parameters are presented in the background section.
Other than analyzing crud from the fractal perspective, we also measure surface coverages of crud to quantify the crud resistance of a number of potentially crud-resistant coatings. The surface coverage analysis is done by applying image processing algorithms to separate the crud from the underlying surface. The surface fraction covered by crud can be used as a quantitative measurement of how effective each material is in mitigating crud. Even if an effective industry-ready crud-resistant material is not found by this thesis, these quantitative studies can lead to better understanding of
how crud and fouling deposits form in general.
1.3 Key Scientific & Engineering Contributions
This section lists the major contributions of this study. The first sub-section lists the engineer-ing contributions regardengineer-ing the designengineer-ing, construction, and testengineer-ing of the IHTFP. It provides an overview of how the IHTFP is unique when compared to other similar experimental loops around the world. The second sub-section lists the new scientific findings that were made in this thesis using the IHTFP. The section gives an overview of notable scientific results in this thesis, as well as how our scientific findings are unique.
1.3.1 Engineering Contributions
The main engineering contribution is the design and construction of the loop used to carry out the crud growth experiments. Our experimental loop setup has to simulate the extreme thermal-hydraulic and chemical conditions in a PWR. The whole section on design and construction of IHTFP has been allocated to explain how this engineering feat was carried out. The sections below will list the accomplishments from building this crud loop, as well as emphasize several aspects of the loop that make it stand out from other, similar loops.
Simulating PWR Conditions As mentioned earlier, the IHTFP has the capability to closely simulate PWR conditions. This is currently one of only a few known in the world outside of industry capable of simulating PWR conditions. The IHTFP grows crud on a simulated fuel rod, with geometry similar to that of real PWRs. The IHTFP can operate at a pressure of 155 bars and a temperature of 325 ºC, similar to the temperature and pressure conditions within a PWR. Other than this, the loop also has the capability to make the water mass flux within the test section match the actual PWR mass flux. The IHTFP can also be adjusted so that the Reynold’s number within the test section is within the same order of magnitude as that found in a PWR. Moreover, the chemical conditions within the reactor are also simulated in the IHTFP by adding boric acid and lithium hydroxide in similar amounts to those of PWRs. crud precursor particles, in the form of nickel oxide (NiO), are added in large amounts to increase the crud growth rate. in addition, the IHTFP loop is made of 316 Stainless steel and therefore contributes to iron oxide (F e3O4) source
term natrually. This only leaves out radiation which is unlikely to affect crud growth. The summary of the IHTFP’s conditions compared to the PWR’s conditions is provided in table 1.2.
Finding a loop that can simulate PWR condition in a university setting is very rare. The only other similar setup that was built in a university setting, that we are aware of, is the loop built by Professor Ji Hyun Kim at Seoul National University. The loop at Seoul National University is used
Condition PWR IHTFP
Pressure 15.5 MPa 15.5 MPa
Liquid Temperature 287-324°C 320°C Reynolds Number 5·105 1.62 · 105 Mass Flux 3500kg/m2s 1920kg/m2s F e3O4, N iO 13-116 ppb 20,000 ppb Boron 1400 ppm < 2000 ppm Lithium Hydroxide 3 ppm ~2.2 ppm pH 6.9 6.9 - 7.4 Dissolved Oxygen > 5 ppb >1 ppb Water Electrical Conductivity ~11-23 µS/cm ~10-15 µS/cm
Table 1.2: This table compares conditions between that of the IHTFP and a typical PWR. Note that the IHTFP only contains nickel oxide (NiO) particles. The large amount of NiO was added to speed up crud growth. The lower-end value of pH was also chosen for the purpose of speeding up crud growth in the IHTFP [43, 53, 54].
for in-situ Raman and crack growth testing. Other loops that we are aware of are mostly operated by industry, such as Westinghouse’s WALT loop and CRIEPI’s crud loop in Japan. When compared to those loops, the IHTFP is still unique in its features that will allow unique experiments to be conducted. The explanations of some interesting unique features are listed below.
Usage of large sapphire windows in the experimental autoclave with PWR thermal-hydraulic condition Our crud loop is the first-of-its-kind to have sapphire windows as large as 2 cm. With the large sapphire windows, many possibilities open up. For example, the autoclave windows can be used for laser triangulation-based crud thickness measurement, Raman spectroscopy, and observation of sub-cooled boiling with a microscopic camera. The fact that the IHTFP contains three windows also makes it possible to take in-situ photographs and conduct high-pressure contact angle experiments.
Internal rod heating instead of ohmic heating for fuel rod (Second-of-its-kind) Nor-mally, other experimental loops that simulate PWR conditions ohmically heat their test section, changing the electrochemical conditions on the rod surface. The IHTFP’s heating rod is structured so that an electrically-isolated heating element is inserted inside a cladding, just like real PWRs. Internal rod heating with cladding is better than normal ohmic heating, because by using normal ohmic heating throughout the rod, the electricity flowing on the surface of the heating rod might interfere with the surface chemistry. This would have made it difficult to correctly gauge the crud resistance of candidate coatings.
1.3.2 Scientific Contributions
After the IHTFP was built, it was used to make three main scientific contributions. Most of our data from our crud loop were extracted from crud samples using scanning electron microscope (SEM) images. By applying image-processing techniques in many different ways, we were able to discover many interesting findings, briefly explained in the following list. More detailed information is provided in the discussion chapter of this thesis.
First nanoscale cross-section characterization of PWR-representative crud morphology & composition. In this study, the cross-section of crud is cut with a focused-ion beam (FIB) and analyzed at the nanoscale using a scanning electron microscope (SEM). With the high precision of the FIB and the SEM, we were able to observe and analyze the cross-section of crud at the nanoscale level. Although many SEM images of crud had been taken before, and cross-sectional images of crud already exist, this was the first time that crud’s cross-section was observed at the nanoscale level. Using these cross-sectional images, we discovered that crud exhibits fractalline properties, and found a strikingly strong correlation between the fractal dimension and porosity. This correlation holds true across both the crud obtained from our facility and the crud provided to us by Westinghouse from their WALT loop facility.
Crud fractal measurements. As far as we are aware, this is the first time that fractal analysis tools have been applied to crud. Fractal analysis tools are still relatively new to the world of science and have recently gained popularity in their use for material analysis, especially for soil. Crud’s composition, which is made up of particles, bears great resemblance to the composition of soil. Therefore, crud is a great candidate to apply fractal analysis tools. We chose the box-counting algorithm as a way of obtaining fractal dimensions from crud. The box-counting algorithm is one of the most commonly used fractal analysis tools with widespread usage in soil studies.
The fractalline properties of crud were examined. We found that fractal analysis via the box-counting method yields very low errors in the box-box-counting plots, supporting the theory that crud is fractalline. Although the low R-squared in the box-counting plot does not necessarily imply that the object of examination is a true fractal, the R-squared value as high as 0.9989 (figure 2-81) is very good evidence to support the theory that crud exhibits fractalline properties. In addition, fractal dimension vs porosity of crud was found to show a strong correlation. crud samples from our experiment, as well as crud samples received from Westinghouse’s experimental loop, were both analyzed. We found that crud from both sources follows the same trend as shown in figure 2-81. Furthermore, fractal dimension and porosity’s relationship to height position within crud layer was examined. The data was obtained by using computer code to repeatedly find fractal dimensions from cropped images of crud at different heights. From our experimental results, the crud’s porosity
and fractal dimension decreases as the height position in crud layer increases.
Testing of PWR-condition Crud-resistant materials In this thesis, the crud-resistant coating approach to preventing crud was explored. Our results show an interesting relationship between the Hamaker constant (stickiness) of crud-resistant coating and the deposition of crud particles. Now that we know there is a relationship between the Hamaker constant and crud-resistant coating, the next step is to conduct experiments which will test crud-resistant coatings with Hamaker constants close to that of water.
1.4 Description of chapters
The thesis is organized so that, after the introduction, the background section will provide detailed explanations for all the science that is related to understanding this work. Next, details of the IHTFP will be covered in Chapter 3, along with its design and construction. Chapter 4 will then lay out the experimental plans, the test matrix, and analysis methodologies. After that, the experimental data will be presented, discussed and summarized. The description of each chapter is listed below: Chapter 2 Chapter 2 contains the scientific background that is needed to understand all the concepts related to the experiments. The first part of this chapter guides readers through what fouling deposits are in general, how they are formed, what their characteristics are, and their effects on the respective systems in which they are found. The second part narrows down the topic to just fouling inside nuclear reactors, or crud. This part expands on the previous section to dig deeper into crud’s specific origins, characteristics, and effects on nuclear reactors. In this part, previous literature and previous attempts at experiments and modeling related to crud are examined. The third part ties together what is shown in the background section and digests the information to answer the question of what all this background implies about the experiments.
Chapter 3 Crud grows in PWR conditions which are not easy to simulate experimentally. There-fore, lots of effort was put into building an experimental setup that can carry out the experiments we planned at PWR conditions. The detailed information of how the loop was built, as well as how to operate the loop, is presented in this chapter. This chapter is meant both as a complete guide to the operation of the IHTFP for future users, as well as to aid other researchers in constructing and running their own similar facilities.
Chapter 4 Chapter 4 describes the experimental text matrix. It describes the kind of data we want to obtain, as well as the plan we went through to obtain it. The chapter provides descriptions
of the data processing and analysis methods that were chosen, as well as how they were done, and why they were done.
Chapter 5 This chapter presents the resulting data and observations for both the fractal analysis and the crud-resistant coating experiment. The first part of this chapter deals with the image processing and analysis of crud samples obtained. The second part shows the results of the crud-resistant surface modification coating experiments. The third part ties the coating experiments’ result to the Hamaker Constant. The last part of this chapter shows the new crud modeling results using the existing MAMBA-BDM code with our new experimental data as input parameters, to give a more realistic picture of the effects of crud on PWR operation.
Chapter 6 From the results and analysis presented in chapter 5, this chapter processes the data a step further to yield meaningful scientific findings, and discusses the implications of these results. Both the results related to fractal analysis and results related to the crud resistant coatings will be reviewed in this chapter. Finally, for those conducting future experiments, the direction for this research’s continuation and sources of error will be discussed in this chapter as well.
Chapter 7 This chapter is the conclusion chapter that briefly summarizes the resulting scientific findings and their implications.
Chapter 2
BACKGROUND
2.1 Fouling and Adhesion in Energy Systems
Fouling of an energy system is the accumulation of an undesirable deposit on top of the fluid-facing surface. An example of fouling deposits include deposits in heat exchanger tubings, limescale buildups inside pipes, or even mussel layers growing on pipes near the sea. In some cases, these deposits are detrimental to the function of the system it grows on. For instance, fouling deposits on heat exchanger will decrease the heat transfer and make the affected heat exchanger less efficient. Fouling deposits in filters can clog the filters, rendering them unusable. Fouling deposits on fuel rods of nuclear reactors, called crud, are also detrimental to cladding surface heat transfer. In addition, crud deposits also accumulate boron which can cause power shift and accelerated corrosion.
2.1.1 Definition and Formation Mechanism of Fouling Deposits
Fouling deposits are accumulations of unwanted material on solid surfaces. Most types of fouling deposits are similar in that they lead to undesirable effects such as decreased heat transfer, increased pressure drop and under-deposit corrosion. The mechanisms which lead to the formation of these fouling deposits, however, can vary widely. Within this “fouling” umbrella, multiple mechanisms cause different types of fouling, which are very distinct from each other in their nature. Fouling mechanisms can be categorized into six categories: particulate fouling, corrosion fouling, crystal-lization fouling, reaction fouling, biological fouling and solidification fouling. This section explains each of these mechanisms, and shows their real-world fouling deposit examples. The most important fouling mechanism that will be focused on in this thesis is particulate fouling, which is the driving mechanism behind fouling deposits on the fuel rod within the pressurized-water nuclear reactor core.
![Figure 2-7: The condenser tubing shown in this image is covered in solidification foulings partially caused by solidified hydrocarbon [65].](https://thumb-eu.123doks.com/thumbv2/123doknet/14233782.485900/43.918.201.716.106.452/figure-condenser-covered-solidification-foulings-partially-solidified-hydrocarbon.webp)
![Figure 2-8: This image shows a ship hull covered with a biofouling layer [67].](https://thumb-eu.123doks.com/thumbv2/123doknet/14233782.485900/44.918.203.714.102.491/figure-image-shows-ship-hull-covered-biofouling-layer.webp)


![Figure 2-44: Capture cross sections vs energy of zirconium-90 [111]. Zirconium-90 is the most common isotope of zirconium.](https://thumb-eu.123doks.com/thumbv2/123doknet/14233782.485900/84.918.253.657.712.966/figure-capture-sections-energy-zirconium-zirconium-isotope-zirconium.webp)
![Figure 2-45: Capture cross sections vs energy of nickel-58 [111]. Nickel-58 is the most common isotope of nickel.](https://thumb-eu.123doks.com/thumbv2/123doknet/14233782.485900/85.918.253.656.195.447/figure-capture-sections-energy-nickel-nickel-common-isotope.webp)
![Figure 2-49: This graph, taken from Henshaw (2006) paper, shows the relationship between pH and crud depth [112]](https://thumb-eu.123doks.com/thumbv2/123doknet/14233782.485900/88.918.225.704.518.796/figure-graph-taken-henshaw-paper-shows-relationship-depth.webp)
![Figure 2-52: This figure shows the effect of crud thickness on the maximum concentration factor [115].](https://thumb-eu.123doks.com/thumbv2/123doknet/14233782.485900/93.918.210.698.146.545/figure-figure-shows-effect-thickness-maximum-concentration-factor.webp)
![Figure 2-56: This figure shows the calculated effective crud thermal conductivity (k ef f [BT U /hr − f t − ºF]) vs heat flux (k ef f [BT U /hr − f t − ºF ]) for various WALT loop rods [44]](https://thumb-eu.123doks.com/thumbv2/123doknet/14233782.485900/96.918.151.707.561.887/figure-figure-shows-calculated-effective-thermal-conductivity-various.webp)
