Brazilian joumal of Genetics, 20, 2,299-306 (1997) (Revista Brasileira de Genética)
METHODOLOGY
Proposal for
applyíng
combined
selection to diallel analysis
C/eso Antônio Patto Poctieco', MariaAmélia
Gava Fetrào'.
Cosme Damião Cruz"
and Ro/and
s/encovskv"
ABSTRACT
The philosophy of intrapopulation combined selection is the search for and identification of individuais with superior genotypic behavior, based on their performance compared tothe family mean and, at the same time, of their family mean in relation to the population mean, through the weighting of the phenotypic values represented, respectively, by the within and among families heritability coefficient. The objective of this study was to adapt and apply this philosophy to diallel analysis. The crosses were considered as having fixed effects and selected on the basis of their specific combining ability (SCA),and on the mean performance of the two involved parents, in relation to the general combining ability (GCA). This work was based on Griffing's (Heredity 10: 35-50, 1956) method 2, model1 which involves p(p + 1)/2 treatments. The proposed index resulted from the weighting of the effects of GCA (grs) and SCA(Sij's)by the respective determination coefficients of additive and dominant genetic deterrninatíons, resulting from the partitioning of the total genotypic determination coefficient. An example is given for ilIustration.
INTRODUCTION
When individuals are related by a simple family structure, the phenotypic value (P) of an individual, measured as the deviation from the population mean, may be expressed as the sum of two parts: the deviation fram its family mean in relation to the population mean (Pf) and the deviation from the individual mean to the family mean (Pw)' which is the within family deviation (Falconer,1981) so that:
1EMBRAPA-CNPMS,Caixa Postal151,35701-970 Sete Lagoas,MG, Brasil.Send correspondence to C.A.P.P.
2EMCAPA-EEL,Caixa Postal62,29900-970 Linhares, ES,Brasil. 3Departamento de Biologia Geral, UFV,36570-000 Viçosa, MG,
Brasil.
4ESALQ-USPCai, xa Postal83,13400-970 Piracicaba,SP,Brasil.
The selection pracedure varies according to the weight given to these two parts. Selection can be based only on the fami1ymean (Pj),totally ignoring the within fami1y deviation (Pw). Selection can also be ma de only on Pw: totally ignoring Pf. Further, selection can be ma de considering both components, Pfand Pw' given different weights, chosen to make the best use of the information sources.This is called combined selection. Thus, the individuals are assessed in a single stage,not two, and their individual value is not the only information used for their selection or rejection.
In combined selection, the first step is to find which are the appropriate weights to be used, so that they contain the fami1yand theindividual withinfamily contributions. It is, therefore, necessary to estimatedhe appropriate éoefficients for ~he individual values and for the means of the corresponding families (Cruz, 1995).
300
In the genotypic study of a metric trait, only the
individual phenotypic value can be measured, but it is the geneticvalue which determines itsinfluence in the
next generation. In this context, the heritability (h2),
expressedastheproportion of thetotalvariance which
is attributed to the mean genetic effect,predicts the reliability of thephenotypic value as a measure of the genetic value.Therefore,the success of individual selec-tion according to the phenotypic value can only be predicted by knowledge of the degree of
correspond-encebetween the phenotypic and the genetic values measured bytheheritability.
Taking the heritability as a regression of the genetic values on the phenotypic values, a good estimate of the geneticvalue of an individual may be
obtained by multiplying its phenotypic value by the heritability,h2P.Thisidea can be applied, separately, to
thetwo parts of the phenotypic value, as long as they
arenot correlated and provide independent informa-tionon thegenetic value.
Thus, taking both parts of the phenotypic
value, the best estimate of the genetic value of the
individual is given by:
Expected genetic value: G=h;Pf+h~P;
Theweights which make the most effieient use
ofthetwosourcesof information are, therefore, the two
appropriate heritabilities,thatis,the heritability among
(hf) and within (h~) families.
The combined selection criteria may be presented in the form of an index model, where:
This solution of the problem, that is, the best use
of the information provided by the parents, may be preciselymolded in the way in which the problem is
introduced.
In the present study the use of a combined
selection criterionwas adapted todiallel analyses. For this,the best parents must be known simultaneously,
based on their general combining ability (GCA), and
within the best hybrids, based on their specific combining ability (SCA).
METHODOLOGY
An estimate of a selection index for diallels, combining theinformation among parent means, which involve GCA, with the information within the same parents involving SCA was developed, using an
Pacheco etaI.
approach similar to Falconer's (1981) index for
combined selection.
Only balanced diallels involving parents and their FI crosses were considered, with p(p + 1)/2 fixed treatments and Griffing's (1956) method 2, model 1
presented by Cruz and Regazzi (1994), with the
following statistical model:
(i)
where, Yif mean value of hybrid (i=1= j) or parent (i
=
j) combination; m: general mean; gi: general combining ability effects of i-th parent (i=
1, 2, ...,p);sif specific combining ability of the cross between the i-th and j-th parents; eif mean experimental error assoeiated with the ij-th observation.In this model, the g's refer mainly to the additive genetic effects due to loci in homozygosis in the parents, while sij'srefer to the non-additive genetic effects due to the heterozygous loei.It was taken that non-additive effects are due to dominance, ignoring epistasis. The same weight was given to both types of effects, so thatmodel (i),replaced by the estimatesof the effects,can be written as follows:
When the effects are random and calculated within a population, [(gj +gj)+Sjj] refers to a phenotypic component established by the relationship among the treatment means. Its variance involves an additive genetic part due to (gj+gj) and another dominant genetic part due to Sjj'
Thus, diallel analysis allows the partitioning of the phenotypic variance, leading to a better knowledge of the size and proportion of the variation which is due to the additive gene effect and that which is due to a specific combination of these genes. This information allows a safer deeision on the choice of parents and/or hybrids.
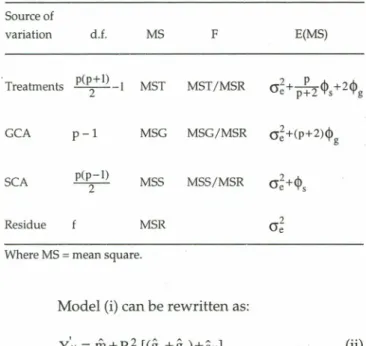
The phenotypic nature of the gi's and the Sij's
can be seen through the presence of theenvironmental variation component, associated with the additive and dominance quadratic components, in the expected values of the mean squares, E(MS), in the respective sources of variation, GCA and SCA, as shown in Table I.Thus,to work only with the genotypic components it would be enough to multiply thegi:s and theSij'seffects by the heritability (h2) or, in a fixed model, by the genotypic determination coefficient (R~), estimated
bf
the following expression:R2 _ MST-MSR
Proposal for applying cornbined selectian tadiallel analysis
Table I - Summary ofthe Griffing method 2 diallel analysis ofvariance
based on means and mathematical expectatians ofthe mean squares,
regarding the treatments as fixed effects.
Source of variation d.f. MS F E(MS) Treatments p(p+l) -I MST MST/MSR 2 GCA MSG MSG/MSR (j~+(p+2)<1> g p-I SCA -p(2p--I) MSS MSS/MSR Residue MSR Where MS=mean square.
Model (i) can be rewritten as:
In this new model, the Y·ij value would express a genotypic value, probably more adequa te than the first (phenotypic), however still without using all the genetic potential provided by the partition of this genotypic value into its additive and dominant parts.
It is known that the coefficient of heritability allows the estimation of the part of the total genotypic variation which is of additive genetic nature. The heritability is important because it is a good indicator of the size and the variation of the additive effects, which determines the correlation among relatives. Thus, this coefficient is used to predict the genetic gains in the next generation, from the selection differential estimated from the selected genotypes.
The dominant component, when present in in-trapopulation selection, reduces the correlation among the selected progenies and the next generation because of the nature of these effects. However, when there is interest in a certain hybrid combination, this component is very important because itis responsible for heterosis. Therefore, a dominance heritability coefficient or a dominant genetic determination coefficient would allowestimating the success of (FI) hybrid selection.
The quadratic components inyolved in the GCA and SCA expected mean squares can be isolated by a combination of MS, so that: I A MSG-MSR <1>g= p+2
$5
=MSS-MSR 301These quadratic components have been used to determine the magnitude of the additive effects compared to the dominant effects, when both GCA and SCA effects are significant, and help to establish the criteria for selection of parents and/or hybrids.
In the E(MS) for treatments, these two quad-ratic components are weighted by different coefficients, so that <1>ghas greater weight than <1>5' tending to a 2:1 ratio, when there is a large number of parents.
An orthogonal partition of the genotypic deter-mination coefficient (Rb) in its additive (R~) and dominance (Rt) parts ispossible, so that:
and since: (ii) then, or 2 (MSG-MSR) R2_ p+2 g- MST 2(MSG-MSR) = (p+2)MST or P~2 (MSS-MSR) Rt MST p(MSS-MSR) (p+2)MST
Thus an index based on the weighting of the additive and dominance effects may be determined by their corresponding genetic determination coefficients. This index may be expressed as:
At least three types of relationship between R~and Rt can be predicted to compare lijand Yij'when i;t j:
1- R~>Rt
)
302
In the first case, the greater the difference
between the two determination coefficients, the greater the predominance of the additive effects. Consequently,
hybrid prediction based on the parental gi's effects will be reliable.
In the second case, the opposite occurs, and the greater the difference between the two determination
coefficients, the greater the predominance of dominant
effects. In this situation, where large heterosis effects are expected, the parental givalues are not good predictors of the hybrids' behavior. Since the importance of the
quadratic component due to the dominance effects is
large, a significant alteration in the orders of the
treatment classification based on I .. and y ..is expectedlJ lJ . In the two situations described above, the
predominance of one effect over the other was
considered. However, in practice, several other situations occur between the two extremes (case 3).Itis
expected that the proposed index will contribute more
in these intermediate cases, where there is a small
advantage ofone effect over another. In these situations,
the choice between two parents or two hybrids may be
better decided by the combination of small genotypic differences, mainly in cases where the advantage tends
to dominance by the weakening of the gi's predictive
power.
An important consideration should be added to the proposal of the index in its comparison with the ylJ..
observed values; the constant presented in the model, the general mean, which is estimated by phenotypic
values, corresponds to the mean of the genotypic
values, because the other factors of the model are estimated as deviations whose sum is zero. Therefore, the general mean of the Yijand Iijexpressed in the model
below corresponds to the constant m,For i
*
j,(iii)
Finally, the Griffing model considered in this
study, expressed by the parameters of Gardner and
Eberhart (1966), as presented by Cruz and Vencovsky
(1989), for the cases where i=
i.
may be written as:(iv)
whose simplification leads to the following expression:
Pacheco et al.
_~ ~ (p-l)~
Yii-ffi+vi-(p+l) h
From this expression (v) it can be seen that the
mean of the parents is a function only of the variety
(
v
J
,
as the effects of varietal heterosis (hi) cancel outand the general mean (rn ) and the mean heterosis (h)
are constants in each analysis under consideration.
According to the (iv) expression, the index for
parent selection may be written in the following way:
Yii
=
m
+R~[(iVi +~~~;~h
i)+( iVi + ~~~;~h
i)]+(v)
(vi)
whose simplification leads to the folIowing expression:
..=~ 2~. ( 2_ 2 2(p-2)~ 2(p-l)~ (Vil")
YlI m+Rgv,+ Rg Rs) (p+2) hi-Rs(p+l)h
where itcan be seen that: 1) when the ratio between the
two coefficients of determination isunity (R~=Rt), one
parent will be selected based only on its varietal effect, which would be expected only when the dominance effects were nil; 2) when R~<Rt ,the index will take into
consideration nega tive values of the varietal heterosis,
instead of the desirable positive values.
Thus, the use of the proposed index for parent
selection, based on the estimable effects of the Griffing
model (1956), should be made with great caution, as the
results will only be coherent incases where R~is much
larger or much smalIer than Rt, and, in the latter
situation, it isnecessary to invert the varietal heterosis
signo
APPLICATION
Diallel analyses involving parents and F1's
displaying significant varietal ar GCA and heterosis ar
SCA were surveyed in the literature to illustrate the
proposed methodology.
Thestudies originally assessed by Gardner and
Eberhart (1966) were re-analyzed using Griffing's (1956) method 2, modell. In all examples, the additive
genetic quadratic components (<I>g)'the non-additive effects (<I>s)'the genotypic determination coefficients (Rt), additive genetic (R~) and the non-additive genetic
(R~) were calculated, following the methodology
described in item 2.
. . Based on the size of these components ard
-coefficients, as well as their ratios, five studies which
illustrate the three different proportions were chosen
Proposal for applying combined selectian tadiallel analysis 303
Table II -Genatypic determinatian (Rb),additive genetic (R~)and domínance (R~)coefficients, additive quadratic
genetic ($g)'and quadratic dominance ($s)cornponents and their relationships in five diallel analyses using Griffing's (1956) rnethod 2. 5aurce Rb R~ 1.Miranda (1987)a 0.9574 0.8858 b" 0.9038 0.2470 2.Delbani et ai.(1989) 3. Gamide (1980)b 0.7820 0.4070 4.Paini (1994) _lc 0.7301 0.3949 5.Paini (1994) - 2c 0.7529 0.3078 R~ R2 <l>g g <l>g <1>5 R~
"
[
0.0716 12.37 36.69 7.91 4.64 0.6568 0.38 0.039 0.273 0.14 0.3750 1.08 0.226 0.520 0.43 0.3352 1.18 320886.0 680887 0.47 0.4451 0.69 298515.3 1079253 0.27"Number of fruits per sweet pepper plant.
bMaize grain weight in kg/plat of 5.0 m2•
'Maize grain weights in kg/ha.
*Quated by Cruz and Regazzi (1994).
In Miranda (1987) there was a predominance
of R~; in Oelboni et al, (1989)of R~; in Gomide (1980)
the R~and R~ values were similar; in Paini (1994)-1,
there was a slight superiority of R~ and in Paini
(1994)-2,of
R
t
.
Theexample of Oelboniet al. (1989)quoted by
Cruz and Regazzi (1994) was chosen from these five examples because it isthe most illustrative.Sixvarieties of maize and their FI hybrids are involved. Their yield
data (kg/ha) was originally analyzed using Gardner
and Eberhart (1966)methodology, and the analysis of
variancecarried out according to Griffing (1956),with
apartition of the treatment sum of squares into GCA
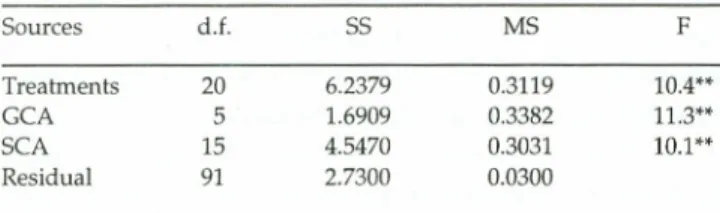
and SCA, as shown in TableIll,
Table Ill - Analysis ofvariance of grain weight per plat in a diallel with six varieties of maize and their FI hybrids. 5tudy by Delbani et
ai.(1989) quated by Cruz and Regazzi (1994).
5aurces d.f. 55 MS F Treatments 20 6.2379 0.3119 10.4** GCA 5 1.6909 0.3382 11.3** SCA 15 4.5470 0.3031 10.1 ** Residual 91 2.7300 0.0300 Mean =2.67 kg/plat; coefficient ofvariatian (C.V.%) = 6.49.
According to the literature the conclusion
about the type of genic action predominant among the assessed material is normally based on the size of the quadratic components. However, analyzing the E(MS) for treatments (Table I) it can be see that <l>ghas a participation 2(p + 2)/p times greater than that of<l>s' thus showing that the ratio 1:1commonly used may be
overestimating the importance of the SCA.The relation
between thequadratic components themselves does not
seem to be the most appropriate indicator of the
predominant gene action, mainly in the intermediate situation, as seen in those represented by cases 3, 4, and 5 in Table 11.
In the case of Oelboni et al. (1989),where the
dominant genetic determination coefficient (R?) was
2.66 times greater than the additive genetic (R~), the
great importance that should be given to a hy
bridiza-tion program becomes clear. A similar conclusion is
made when the quadratic components are examined,
however, it overestimates the tendency with <l>sseven
timesgreater than <l>g'When this last proportion is not
so large, the researcher may arrive at different
conclusions by using one or another relationship to infer about the predominance of gene action and make a
wrong decision about his breeding programoTable 11
shows an intermediate situation, as that found in the
work of Gomide (1980), where the conclusions are
conflicting. When quadratic components are used, a
predominance of the dominance effects is found, while
when using the determination coefficients a slight
tendency of superiority of the additive effects is
detected.
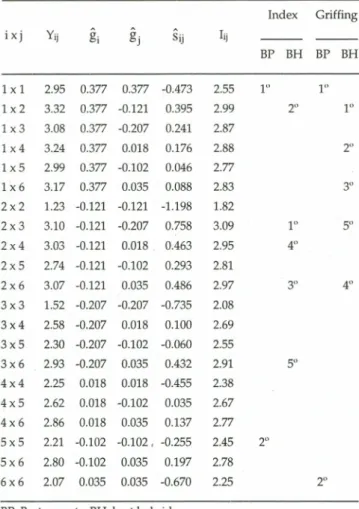
Table IV shows the mean values ofYij' the gi'
gj andSijeffects, the estimated index values (Iij)and the
material selected based on the index and the Griffing
(1956)methodology.
The criterium for selection of parents and
hybrids by the Griffing (1956)methodology is based on
gi's and Sij's' According to Cruz and Regazzi (1994)the
estimates of the GCAeffect(gi's) provide information
about theadditive effects of the genes and have been of
great use in indicating parents to be used in breeding
programs. The SCA (Sij's) effects, estimated as
devia-tions of a hybrid in relation to what would be expected based on the GCA of its parents, are a measure of the
non-additive genetic effects.Normally, the breeder is
interested in a hybrid combination with high S
estimates involving at least one of the parents with
i
highgi effect. . .
The Sii values have great genetic significance
304
Table IV -Yijgenotypic values, gi' g. and $ij effects,lijindex value and the rank of the five best materfals selected by the index and Griffing's (1956) methodology. Study byDelboni et al.(1989), quoted byCruz and Regazzi (1994). Index Griffing ixj Yij gi gj Sij lij BP BH BP BH 1x1 2.95 0.377 0.377 -0.473 2.55 1" 1" lx2 3.32 0.377 -0.121 0.395 2.99 2" 1" 1x3 3.08 0.377 -0.207 0.241 2.87 1x4 3.24 0.377 0.018 0.176 2.88 2" 1x5 2.99 0.377 -0.102 0.046 2.77 1x6 3.17 0.377 0.035 0.088 2.83 3" 2x2 1.23 -0.121 -0.121 -1.198 1.82 2x3 3.10 -0.121 -0.207 0.758 3.09 1° 5° 2x4 3.03 -0.121 0.018. 0.463 2.95 4° 2x5 2.74 -0.121 -0.102 0.293 2.81 2x6 3.07 -0.121 0.035 0.486 2.97 3" 4" 3x3 1.52 -0.207 -0.207 -0.735 2.08 3x4 2.58 -0.207 0.018 0.100 2.69 3x5 2.30 -0.207 -0.102 -0.060 2.55 3x6 2.93 -0.207 0.035 0.432 2.91 5" 4x4 2.25 0.018 0.018 -0.455 2.38 4x5 2.62 0.018 -0.102 0.035 2.67 4x6 2.86 0.018 0.035 0.137 2.77 5x5 2.21 -0.102 -0.102. -0.255 2.45 2" 5x6 2.80 -0.102 0.035 0.197 2.78 6x6 2.07 0.035 0.035 -0.670 2.25 2" BP:Best parents; BH:best hybrids.
TheSii values will be nega tive when the deviations are
predominantly positive, and vice-versa (Cruz and
Vencovsky,1989).The size of $ii is indica tive of the
varietal heterosis and its sum is a linear function of the
mean heterosis.
According to Griffing (1956), the materials
whichshould be selected were varieties 1 and 6 and the
hybrid combinations 1 x 2, 1X4, 1X6, 2X6, and 2 x 3.
With the proposed index, the best materials were
varieties 1 and 5,while the best hybrid combinations
were 2x3, 1X2, 2X6,2X4,and 3 x 6. Little agreement was observed between the two methods, which may be attributed to the weight given by the Griffing method
to the gi effects.Sincein this case the dominant gene
effectswere more important, the index provided a more
desirable selection because it was not solelybased on
the parental performance.Thegi's were poor predictors
of the parents superiority in this case because the
parents were not good performers per se but were in crosses.
Our data were originally analyzed using
Gardner and Eberhart's (1966) method. The varieties
Pacheco etai.
Table V -Yjjgenotypic values, Viand hi effects,index liivalues and parents selected by the proposed index expressed in the form of Gardner and Eberhart effects.Study by Delboni et ai. (1989), quoted by Cruz and Regazzi (1994). ixj Yii Vi hi lii BP 1x1 2.95 0.912 -0.158 2.79 2° 2x2 1.23 -0.808 0.567 2.84 1° 3x3 1.52 -0.518 0.104 2.61 4x4 2.25 0,212 -0.176 2.61 5x5 2.21 0.172 -0.376 2.46 6x6 2.07 0.031 0.039 2.70 BP: Best parents.
(Vi) and heterosis effectsweresignificant at the 1%level
of probability, showing that the varieties did not make
up a homogeneous group and therewasheterosis in the
crosses.The partition of the heterosis effect detected a
significant mean (/1) and varietal heterosis (hi)'
indicating that the heterosis was not the same for all the
varieties, although the variation of this effect on these
varieties was not caused by specific heterosis(5'ij)' Table
Vshows the effectsof Gardner and Eberhart (1966)for
the parents and the index estimates using expression
(vii) presented in item 2, with an inversion of the
varie tal heterosis sign because R~< R?.
Using the Vi values Oelboni et al. (1989)
con-cluded thatvarieties 1,4 and 5 have greater potential for
per se use. Heterotic combinations were obtained with
the use of parents 2, 3 and 6,which had the largest hi
values. They aiso emphasized that hybrid combination among divergent parents with good genetic potential
should be preferred. Therefore, variety 1, for its
performance,andvariety2,foritsdivergence in relation
to the other parents, would be the best options.
The comparison of the values obtained by the
index for the parents in Tables IV and V shows, as
already pointed out in the methodology, that the
proposed index should only be favored for selecting
parents when R~is much greater than R?. Sincein the
example under consideration this did not happen, the
parents should beselected based on the data in Table V.
As in the Gardner and Eberhart (1966)and the Griffing (1956)methods, the superiority of variety 1was
also recognized by the index,in part because it carried
the greatest number of favorable alleles among the six
varieties analyzed. Because of the highly favorable
condition forexploitation of heterosis, the index aiso
selected variety2 ashaving great potential for a hybrid
program because, in spite of having a lower phenot~ic mean, it was the most divergent and had the best gene
Proposal for applying combined selection todiallel analysis
The main differenee between the index and the
other two methods for hybrid seleetion is in the
selection of the eross 2x3 by theindex and 1 x 2 by the
other two.Looking at the Yijvalues in Table IV it is, at
first sight, difficult to understand how a mean of 3.10
(2x3) ean be better than one of 3.32 (1 x 2).However,
taking into eonsideration that the proposed index
expresses the eomponents aeeording to their
determination eoeffieients, it ean be seen how an
inversion in the means classifieation ean oeeur. The
meansbeeame3.09 for theeross 2 x3and 2.99 for 1x2.
In faet,the 2 and 3 parents were more divergent, as ean
be seen by the size of the hi and Sii values (both had the
greatest hi or smallest Sii) eoupled with the best gene
eomplementation, shown by the greater Sij value.
Finally, the good agreement between the
results obtained with the index and the Gardner and
Eberhart (1966) method for the example under
eonsideration isprobably due to the strong genotypie
determination eoeffieient (90.38%of the phenotypic
variation was due to the genetie effects), so that the
phenotypie values were good estimators of the
genotypie values.
CONCLUSIONS
Combined seleetionis a proeedure adopted in
familyseleetion (random model).The adaptation of this
breeding philosophy to data produeed by diallel
analysis,with a fixed mo del, in the form of the proposed
index, produeed results whieh allow the following
conclusions: a) the proposed index allowed the
partitioning of the genetic determination eoefficient into its additive and dominant parts and introdueed these eoeffieients as determining faetors in the choiee of erosses, beeause of the relationship between the two
types ofgene aetion whieh these eoefficients represent
in a diallel analysis; b) the total phenotypie variation
(100%) was partitioned into environrnental, additive
and dominant geneticvariations, allowing the breeder
to assess with greater eonfidenee the relative
importanee of each factor in the selection proeess; e) the eoneept of immediate heritability or determination
eoeffieientof the dominant effeets,whose use is similar
to that of the narrow sense heritability, is introdueed. It
gives an idea of the sueeess the breeder will have,on the
average, with heterosisin the FI hybrid generation, and
d) the proposed index was shown to be adequate for
hybrid seleetion. However, the seleetion of parents
should be ma de eautiously, as its eonstruction is
dependent on the relationship between the additive and dominant genetie determination eoeffieients.
305
Publieation supported by FAPESP.
RESUMO
A filosofia da seleçãocombinada intrapopulacional é a busca eidentificação de indivíduos de comportamento
genotípicosuperior com baseno seu desempenho emrelação
àmédia de sua família e,ao mesmo tempo,de sua família em
relação à média da população, através da ponderação dos valores fenotípicos por pesos apropriados, representados
pelos coeficientesde herdabilidade dentro e entre famílias,
respectivamente. Oobjetivo desse trabalho foio de adaptar e
aplicar essa filosofiaàanálise dialélica,ondeoscruzamentos, considerados como de efeitos fixos, são selecionados com base
no seu comportamento específico (SCA)e no desempenho
médioem cruzamentos dosdois progenitores envolvidos,em relaçãoàmédia geral(GCA).O desenvolvimento foi feito com base no método 2,modelo 1 de Griffing (Heredity 10: 31-50,
1956),que considera p(p + 1)/2 tratamentos. O índice
proposto resultou da ponderação dos efeitosda capacidade
geral de combinação (gi's) e da capacidade específica de
combinação (sij's), pelos respectivos coeficientes de
determinação genético aditivo e genético dominante,
provenientes do desdobramento do coeficiente de
determinação genotípico. Um exemplo de aplicação é dado
para ilustração.
REFERENCES
Cruz, C.D.(1995).Seleçãocombinada. In: Notas de Aulas do Curso deGenética Quantitativa Aplicada aoMelhoramento de
Plantas -FIT 770.UFV,Viçosa, MG(mimeografado).
Cruz, C.D. and Regazzi, A.]. (1994). Modelos Biométricos
Aplicados ao Melhoramento Genético. UFV,Impr. Univ.,
Viçosa, MG, pp.390.
Cruz,C.D. and Vencovsky,R.(1989).Comparações de alguns
métodos de análisedialélica.Rev. Bras.Genet. 12:425-438. Falconer, D.S. (1981).Introdução à Genética Quantitativa. UFV,
Impr.Univ., Viçosa,MG,pp. 279.
Delboni, J.S., Silva, J.c., Cruz;C.D. etai.(1989).Análise de
cruzamentos dialélicos entre variedades de milho
braquítico usando ométodo de Gardner e Eberhart.R. Ceres, 36:365-372.
Gardner, c.a. and Eberhart, S.A. (1966). Analysis and interpretation of the variety cross diallel and related populations. Biometrics 22:439-452.
Gomide, B.G. (1980). Cruzamentos dialélicos entre variedades de milho (Zea mays L.).Master's thesis, UFV,
Viçosa, MG,pp.71.
Griffing, B.A. (1956).A generalized treatment ofthe.use of
diallel crosses in quantitative inheritance. Heredity 10:
31-50.
~ Miranda, ].E.C.(1987).Análise genética de um cruzamento
306 Pacheco et ai.
thesis, Escola Superior de Agricultura Luiz de Queiroz, Piracicaba, SP, pp. 159.
Paini, J.N. (1994). Capacidade combinatória e heterose em oito variedades de milho (Zea rnays 1.), avaliadas sob
condições climáticas da região sul do Brasil. Master's
thesis, UFV,Viçosa, MG,pp. 125. (Received September 9, 1996)