READ THESE TERMS AND CONDITIONS CAREFULLY BEFORE USING THIS WEBSITE. https://nrc-publications.canada.ca/eng/copyright
Vous avez des questions? Nous pouvons vous aider. Pour communiquer directement avec un auteur, consultez la première page de la revue dans laquelle son article a été publié afin de trouver ses coordonnées. Si vous n’arrivez pas à les repérer, communiquez avec nous à PublicationsArchive-ArchivesPublications@nrc-cnrc.gc.ca.
Questions? Contact the NRC Publications Archive team at
PublicationsArchive-ArchivesPublications@nrc-cnrc.gc.ca. If you wish to email the authors directly, please see the first page of the publication for their contact information.
NRC Publications Archive
Archives des publications du CNRC
This publication could be one of several versions: author’s original, accepted manuscript or the publisher’s version. / La version de cette publication peut être l’une des suivantes : la version prépublication de l’auteur, la version acceptée du manuscrit ou la version de l’éditeur.
Access and use of this website and the material on it are subject to the Terms and Conditions set forth at
Toward creating a database on delay times to start evacuation and walking speeds for use in evacuation modeling
Fahy, R. F.; Proulx, G.
https://publications-cnrc.canada.ca/fra/droits
L’accès à ce site Web et l’utilisation de son contenu sont assujettis aux conditions présentées dans le site LISEZ CES CONDITIONS ATTENTIVEMENT AVANT D’UTILISER CE SITE WEB.
NRC Publications Record / Notice d'Archives des publications de CNRC:
https://nrc-publications.canada.ca/eng/view/object/?id=4fef7a5e-f184-408a-b11f-3ffbf2a61ddf https://publications-cnrc.canada.ca/fra/voir/objet/?id=4fef7a5e-f184-408a-b11f-3ffbf2a61ddf
Toward creating a database on delay times to
start evacuation and walking speeds for use
in evacuation modeling
Fahy, R.F.; Proulx, G.
A version of this paper is published in / Une version de ce document se trouve dans : 2nd International Symposium on Human Behaviour in Fire, Boston, MA., U.S.A., March
2001, pp. 175-183
www.nrc.ca/irc/ircpubs
Toward Creating a Database on
Delay Times to Start Evacuation and Walking Speeds
for Use in Evacuation Modeling
Rita F. Fahy, Ph.D., National Fire Protection Association, USA Guylène Proulx, Ph.D., National Research Council of Canada
ABSTRACT
The development and use of evacuation models requires the collection of specialized human-behavior data. Not all of the data necessary to fully predict or model human human-behavior has been collected or possibly could ever be collected. This paper presents a brief overview of data collected for large buildings with large numbers of occupants at evacuation exercises, and after actual fire incidents that have provided important insights into behavior, such as the duration of delays before beginning evacuation. The paper also summarizes data on walking speeds, both those measured during controlled experiments and those actually observed for both able-bodied and mobility-impaired populations during evacuation. This effort represents just a start. There is a great deal of data that has not been compiled or reported in a format useful to model users. The authors present this material in an attempt to move forward the discussion of data compilation and dissemination.
INTRODUCTION
Regardless of the techniques used, all evacuation models require data on characteristics of occupants, their actions during evacuation, delays that may occur, and travel speeds for different types of occupants. First, for the development of a model, there is the need for data on, for example:
• delay times, since people do not react instantaneously on becoming aware of an emergency;
• walking speeds, under a range of conditions of crowdedness on horizontal surfaces and up and down stairways;
• occupant characteristic, to account for differences in actions and reactions among the different types of people for different types of occupancies;
• actions during evacuation, since they may increase the time people take to leave the building;
• effects of obstructions in travel paths, which can cause delays or block egress; and • exit choice decisions, which determine travel paths and affect travel times.
Second, careful observations from evacuation exercises, laboratory experiments and actual fires provide the data needed to verify and validate model predictions. Data from actual fires often provides a reality check for model assumptions.
Data on walking speeds have been collected since at least the early 1900s.1 Several important studies of movement on exit paths, through doorways and on stairs include work by Fruin,
Predtechenskii and Milinskii and the London Transport Board.2-4 More recently, data have been collected in Northern Ireland on the walking speeds of adults with a range of disabilities.5-8 The University of Ulster also undertook a research project to study the impact of disabled occupants on the evacuation of a hotel.9
In contrast, research on delay time to start an evacuation is quite recent. In the past, it was described for fires such as the Beverly Hills Supper Club or the Coconut Grove fires that occupants delayed their response to the initial cues of the fire, but this behavior was justified, at the time, by the specific conditions of these fires. It is now acknowledged that delay times to start occur in all fires and data on this aspect is slowly building up. Consequently, it is essential that modelers take into account this reality of a delay time to start in their models, and for designers to account for it in their evaluation of engineered designs.
Unfortunately, data on delay to start and speed of movement is not available in a single, concise, accessible document. This paper presents delay times and walking speeds derived from major studies conducted in Australia, Canada, Japan, Northern Ireland, and the United States. This effort is intended simply as a start in attempting to assemble such a database. The authors do not claim that this listing is all-inclusive. The layout used is only meant as a suggestion that we hope will be useful in the development and assessment of evacuation models.
DELAY TIME
A key component of total evacuation time is the amount of time that occupants delay before they begin to move to exits. In the literature, this delay time is sometimes described as the "pre-movement time," "initial response time," or the "time to start." This time can be defined as the elapsed time from when an occupant perceived that something unusual is happening to the time this person decides to attempt to evacuate the building or to reach an area of refuge. During this delay time, which can last from a few seconds to several minutes, people can be ignoring the situation or seeking information through investigation or discussion with others. These pre-evacuation activities have been documented in a number of papers and reports.10-12 Data on delay times for office buildings, mid- and high-rise apartment buildings and retail stores have been published in several papers.11-18 Studies have shown that the time occupants will delay can vary according to the cue they receive (alarm bells, warnings by staff, voice announcements or smoke, for example). The series of evacuation drills in mid- and high-rise apartment buildings underway at the National Research Council of Canada has provided data on time to start in summer and winter.11,14 Similar data are also available from studies undertaken in Australia.19 The retail store studies, as well as others, have demonstrated the effectiveness of staff training in reducing the delay time and speeding up an evacuation.12,15,20 Other studies have shown that while occupants are evacuating, they may encounter, and be hindered by, the upward travel of emergency personnel in stairways or by objects such as briefcases, suitcases or coats left in stairwells by evacuees.18,20,21,22
A great deal of data on pre-movement delays has been collected in Japan. Data from five studies were summarized and reported in a recent paper.23 The paper includes results of overnight experiments conducted at a training facility. The subjects were at the training facility because they had firesafety responsibilities in their positions at hotel and health-care facilities. An evacuation drill was held during the night and the subjects were videotaped as
they left their rooms. Ninety percent of the subjects left their rooms within 90 seconds, but delays lasted as long as 5 minutes. This research study also looked at the relationship between initial response time and self-reported levels of intoxication, levels of sleep and time asleep. They did not find any marked effect. The researchers point out in the paper that those attending the training would recognize the need for immediate reaction on hearing an alarm and, coupled with the fact that this was a training drill, that the time durations would be considerably longer in an actual fire. The paper also summarizes the findings on mean evacuation delays in four actual fires. Two fires, for which the type of occupancy was not described, had mean delay times of 2.82 and 3.68 minutes. For a hotel fire, they report a mean delay time of 7.0 minutes. And for a fire in a multi-story condominium, they report a mean delay time of 5 to 10 minutes, derived from questionnaires.
As a result of the data collected from the incidents and studies described above, evacuation model developers and users should have a growing database of essential information. Data are available on delay times from offices, retail stores, hotels, apartment buildings and assembly properties. These observed or reported delay times provide a benchmark for estimates used in modeling other structures. Details on the activities that evacuees engaged in before and during their evacuation provide important input into the estimation of appropriate delay times.
Table 1 presents delay times derived from major studies. The common format used in the table was imposed on the reported data, which varied in both what was reported and how it was reported. (Values that were not reported and could not be calculated are noted on the table.) Although significant factors that may have affected the delay times are noted, such as poor alarm performance, time of day, weather, etc., the reader is referred to the referenced reports for complete details on the conditions under which the delay times were measured. The source of the data, i.e. survey questionnaires vs. videotaped drills, is also identified. Questionnaire data may not be as accurate as observations recorded on videotape, but it was obtained for actual fire situations. Videotaped observations may be more accurately reported, but they do not record behaviors under actual fire conditions. The user will have to exercise judgement in the use of delay times reported in the literature.
MOVEMENT SPEED
Movement speeds have been measured and reported in the literature for a long time. It is not expected that the actual speeds at which people travel on horizontal surfaces or going up and down stairwells have changed much through the years. However, some factors are now judged important to consider, such as the speed of movement of a family group that is likely to be determined by the slowest member, or the speed of movement of a person who walks with a cane.
A number of factors have an impact on the speed of movement, including the characteristics of the occupants, such as age, gender, grouping, clothing and physical ability. The environmental conditions are also important, such as the presence of a crowd, smoke or emergency lighting. The stairwell or corridor design, dimensions, and covering can also play an important role in the speed of movement. All these factors are rarely considered in evacuation models. It is up to the modeler to justify the decision of whether or not to take these factors into consideration.
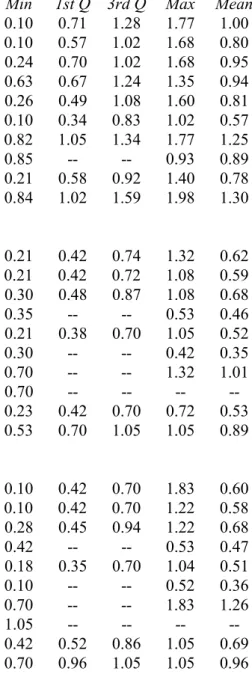
Table 2 presents the travel speeds reported in the studies referenced in this paper. The reader is again referred to the literature for complete details on the conditions under which the travel speeds were observed.
SUMMARY
The authors do not intend to imply that the data summarized in this paper represents all available data. However, it is essential that engineers, designers and building officials have available to them accurate information upon which to base any assumptions of occupant time to start and movement speed that will be used in the evaluation of an engineered building design. The engineering community needs a repository for this information, readily accessible by them and building officials. The authors are presenting here one possible format for that data and hope that those holding additional data will contribute that data and the appropriate reference material to the database.
The research community studying human behavior in fire needs to develop a process for collecting and distilling peer-reviewed pre-movement and travel speed data into an accessible database. A format for that database needs to be developed and agreed upon. A repository for the database needs to be found. Access, possibly via the internet, should be open to all users.
REFERENCE LIST
1. National Bureau of Standards, Design and Construction of Building Exits, National Bureau of Standards Miscellaneous Publication M151, Washington DC, October 1935. 2. J.J. Fruin, Pedestrian Planning Design, Metropolitan Association of Urban Designers
and Environmental Planners, Inc., New York, 1971.
3. V.M. Predtechenskii and A.I. Milinskii, Planning for Foot Traffic Flow in Buildings, Amerind Publishing Company, Inc., New Delhi, 1978.
4. Second Report of the Operational Research Team on the Capacity of Footways,
Research Report No. 95, London Transport Board, London, 1958.
5. K.E. Boyce, T.J. Shields, and G.W.H. Silcock, “Toward the Characterization of Building Occupancies for Fire Safety Engineering: Prevalence, Type, and Mobility of Disabled People,” Fire Technology, Vol. 35, No. 1, February 1999, pp. 35-50.
6. K.E. Boyce, T.J. Shields, and G.W.H. Silcock, “Toward the Characterization of Building Occupancies for Fire Safety Engineering: Capabilities of Disabled People Moving Horizontally and on an Incline,” Fire Technology, Vol. 35, No. 1, February 1999, pp. 51-67.
7. K.E. Boyce, T.J. Shields, and G.W.H. Silcock, “Toward the Characterization of Building Occupancies for Fire Safety Engineering: Capability of Disabled People to Negotiate Doors,” Fire Technology, Vol. 35, No. 1, February 1999, pp. 68-78.
8. K.E. Boyce, T.J. Shields, and G.W.H. Silcock, “Toward the Characterization of Building Occupancies for Fire Safety Engineering: Capability of People with Disabilities to Read and Locate Exit Signs,” Fire Technology, Vol. 35, No. 1, February 1999, pp. 79-86.
9. T.J. Shields, Fire and Disabled People in Buildings, Report BR 231, Building Research
10. J.L. Bryan, "Behavioral Response to Fire and Smoke," SFPE Handbook of Fire
Protection Engineering, 2nd ed., National Fire Protection Association, Quincy MA,
1995.
11. G. Proulx, J.C. Latour, J.W. McLaurin, J. Pineau, L.E. Hoffman, and C. Laroche,
Housing Evacuation of Mixed Abilities Occupants in Highrise Buildings, Internal
Report No. 706, National Research Council of Canada, Ottawa ON, August 1995. 12. G. Proulx, A. Kaufman and J. Pineau, Evacuation Time and Movement in Office
Buildings, Internal Report No. 711, National Research Council of Canada, Ottawa ON,
March 1996.
13. G. Proulx and R.F. Fahy, "The Time Delay to Start Evacuation: Review of Five Case Studies," Proceedings of the Fifth International Symposium on Fire Safety Science, Y. Hasemi, Editor, International Association for Fire Safety Science, 1997, pp. 783-794. 14. G. Proulx, "Evacuation Time and Movement in Apartment Buildings," Fire Safety
Journal, Volume 24, Number 3, 1995.
15. T.J. Shields, K.E. Boyce and G.W.H. Silcock, Unannounced Evacuation of Marks &
Spencer Sprucefield Store, unpublished report, University of Ulster Fire SERT,
Carrickfergus, January 1997.
16. G. Proulx, J. Latour and J. MacLaurin, Housing Evacuation of Mixed Abilities
Occupants, Internal Report No. 661, National Research Council of Canada, Ottawa ON,
July 1994.
17. T.J. Shields and K.E. Boyce, "A Study of Evacuation from Large Retail Stores," Fire
Safety Journal, Vol. 35, No. 1, July 2000, pp. 25-49.
18. G. Proulx, D. Tiller, B. Kyle and J. Creek, Assessment of Photoluminescent Material
During Office Occupant Evacuation, Internal Report 774, National Research Council of
Canada, Ottawa ON, April, 1999.
19. P. Brennan, "Timing Human Response in Real Fires," Proceedings of the Fifth
International Symposium on Fire Safety Science, Y. Hasemi, Editor, International
Association for Fire Safety Science, 1997, pp. 807-818.
20. G. Proulx and J.D. Sime, "To Prevent 'Panic' in an Underground Emergency: Why Not Tell People the Truth?," Proceedings of the Third International Symposium, G. Cox and B. Langford, Editors, International Association of Fire Safety Science, 1993, pp. 843-852.
21. R. Fahy and G. Proulx, unpublished analysis of World Trade Center data, National Fire Protection Association, Quincy MA, October 1994.
22. P. Edelman, E. Herz and L. Bickman, "A Model of Behaviour in Fires Applied to a Nursing Home Fire," Fires and Human Behaviour, 2nd edition, D. Canter, Editor, David Fulton Publishers, London, 1990, p. 194.
23. M. Nakano and I. Hagiwara, "Experimental Study on Starting Time of Evacuation in Sleeping Condition," presented at the Fourth Asia-Oceania Symposium on Fire Science and Technology, Waseda University, Tokyo, May 25, 2000.
24. J.L. Bryan, An Examination and Analysis of the Human Behavior in the MGM Grand Hotel Fire, revised report, National Fire Protection Association, Quincy MA, 1983.
25. J.L. Bryan, An Examination and Analysis of the Dynamics of the Human Behavior in the Westchase Hilton Hotel Fire, revised edition, National Fire Protection Association,
Table 1. Delay Times Derived from Actual Fires and Evacuation Exercises Reported in the Referenced Literature (in Minutes)
Event Description N Min 1st Q Median 3rd Q Max Mean Factors
High-rise hotel24 536 0 3.3 60.0 130.9 290 n/a MGM Grand Hotel fire, no alarm notification, grouped data from questionnaires
High-rise hotel25 47 0 2.0 5.0 17.5 120 n/a Westchase Hilton Hotel fire, no alarm in early stages, grouped data from questionnaires
High-rise office building21 85 0 2.0 5.0 10.0 245 11.3 World Trade Center explosion and fire, no alarm notification (building closer to explosion) High-rise office building21 46 0 4.5 10.0 31.5 185 28.4 World Trade Center explosion and fire, no alarm
notification (building further from blast) High-rise office building19 107 1.0 1.0 1.0 1.0 6.0 n/a Fire incident, no alarms, data from interviews
with occupants of four floors of building (11 interviewees were trapped)
High-rise office building18 12 0.5 n/a 1.0 n/a 2.3 1.2 Unannounced drill on 3 floors; data for first person to reach each of four stairwell doors to wait for voice instruction; trained staff; data from video recordings
Mid-rise office building12 92 0 0.4 0.6 0.8 < 4 0.6 Unannounced drill, good alarm performance; fire wardens; warm day
Mid-rise office building12 161 0 0.5 0.9 1.4 < 5 1.1 Unannounced drill, good alarm performance; fire wardens; cool day
One-story department store15,17 95 1 0.2 0.3 0.5 0.9 0.4 Unannounced drill; trained staff; data here derived from grouped data for 95 participants n/a -- not reported
Table 1 (continued)
Event Description N Min 1st Q Median 3rd Q Max Mean Factors
Three-story department store17 122 0.05 n/a n/a n/a 1.6 0.6 Unannounced drill; trained staff; times distilled from analysis of videotapes
One-story department store17 122 0.07 n/a n/a n/a 1.7 0.5 Unannounced drill; trained staff; times distilled from analysis of videotapes
One-story department store17 71 0.03 n/a n/a n/a 1.0 0.4 Unannounced drill; trained staff; times distilled from analysis of videotapes
High-rise apartment bldg13 n/a 0 n/a n/a n/a n/a 10.5 Forest Laneway fire; for occupants who
attempted to evacuate in the first hour, based on questionnaire responses
219 0 n/a 187.8 n/a 720 190.8 Forest Laneway fire, for all occupants High-rise apartment bldg11 33 0.3 0.8 1.3 4.4 10.2 2.8 Unannounced drill; good alarm performance High-rise apartment bldg11 93 0.4 1.5 3.6 6.9 18.6 5.3 Unannounced drill; good alarm performance;
heavy snow during drill
High-rise apartment bldg19 27 1.0 2.0 8.0 14.0 > 20 n/a Fire incident in early morning, alarm functioned, fewer than half the occupants evacuated
Mid-rise apartment bldg16 42 0.6 1.0 1.4 3.0 > 14 2.5 Unannounced drill; good alarm performance Mid-rise apartment bldg16 55 > 0.5 1.6 4.4 13.5 > 21 8.4 Unannounced drill; poor alarm performance Mid-rise apartment bldg16 77 > 0.3 1.9 7.7 19.1 > 24 9.7 Unannounced drill; poor alarm performance Mid-rise apartment bldg16 80 > 0.3 1.2 2.5 3.7 > 12 3.1 Unannounced drill; good alarm performance Training facility23 566 < 0.2 0.7 1.1 1.5 > 5 n/a Testing sleeping subjects at a training facility n/a -- not reported
Table 2. Travel Speeds Reported in the Referenced Literature A. Where Density Was Reportedly Not a Factor
Type of Situation Measured Travel Speeds
Transport terminals2 265 ft/min on walkways (1.35 m/s)
Average under "normal conditions"3 60 m/min (1.0 m/s) Experiment with Disabled Subjects6
On horizontal (m/s) Min 1st Q 3rd Q Max Mean
All disabled subjects 0.10 0.71 1.28 1.77 1.00
With locomotion disability 0.10 0.57 1.02 1.68 0.80
No aid 0.24 0.70 1.02 1.68 0.95
Crutches 0.63 0.67 1.24 1.35 0.94
Cane 0.26 0.49 1.08 1.60 0.81
Walker/Rollator 0.10 0.34 0.83 1.02 0.57
Without locomotion disability 0.82 1.05 1.34 1.77 1.25
Unassisted wheelchair 0.85 -- -- 0.93 0.89
Assisted ambulant 0.21 0.58 0.92 1.40 0.78
Assisted wheelchair 0.84 1.02 1.59 1.98 1.30
On upward incline
All disabled 0.21 0.42 0.74 1.32 0.62
With locomotion disability 0.21 0.42 0.72 1.08 0.59
No aid 0.30 0.48 0.87 1.08 0.68
Crutches 0.35 -- -- 0.53 0.46
Cane 0.21 0.38 0.70 1.05 0.52
Walker/Rollator 0.30 -- -- 0.42 0.35
Without locomotion disability 0.70 -- -- 1.32 1.01
Unassisted wheelchair 0.70 -- -- -- --
Assisted ambulant 0.23 0.42 0.70 0.72 0.53
Assisted wheelchair 0.53 0.70 1.05 1.05 0.89
On downward incline
All disabled 0.10 0.42 0.70 1.83 0.60
With locomotion disability 0.10 0.42 0.70 1.22 0.58
No aid 0.28 0.45 0.94 1.22 0.68
Crutches 0.42 -- -- 0.53 0.47
Cane 0.18 0.35 0.70 1.04 0.51
Walker/Rollator 0.10 -- -- 0.52 0.36
Without locomotion disability 0.70 -- -- 1.83 1.26
Unassisted wheelchair 1.05 -- -- -- --
Assisted ambulant 0.42 0.52 0.86 1.05 0.69
Assisted wheelchair 0.70 0.96 1.05 1.05 0.96
Mid-rise apartment drill16 0.47 m/s on stairs (ranged from 0.34 to 1.08 m/s
among various adult age groups; one visually impaired person traveled 0.31 m/s)
Mid-rise apartment drill16 0.44 m/s on stairs (ranged from 0.32 to 0.56 m/s
Mid-rise apartment drill16 0.41 m/s on stairs (ranged from 0.30 to 0.47 among various adult age groups)
Table 2 (continued) A. Where Density Was Reportedly Not a Factor (continued)
Type of Situation Measured Travel Speeds
High-rise apartment drill11 1.05 m/s (ranged from 0.57 to 1.20 m/s among various
adult age groups)
High-rise apartment drill11 0.95 m/s (ranged from 0.56 to 1.12 m/s among various
adult age groups) B. Where Density Was a Factor
Location Measured Travel Speeds
Public places2 100-250 ft/min on walkways (0.51-1.27 m/s)
70-150 ft/min on stairs (0.36-0.76 m/s)
Public places3 17 m/min minimum on horizontal (0.28 m/s)
11-16 m/min downstairs (0.18-0.27 m/s)
Theaters and educational3 15-20 m/min (0.25-0.33 m/s) max 2.33 m/s
Industrial buildings3 25-30 m/min (0.42-0.56 m/s) max 2.33 m/s
Transport terminals3 20-25 m/min (0.33-0.83 m/s) max 2.10 m/s
Descending stairs3 20-25 m/min (0.33-0.42 m/s) max 1.28 m/s
High-rise office building drill18 mean speed density
stair with full lighting 0.61 m/s 1.30 p/m2
stair with reduced lighting 0.70 m/s 1.25 p/m2
stair with photoluminescent material (PLM)
installation and reduced lighting 0.72 m/s 1.00 p/m2
stair with PLM only 0.57 m/s 2.05 p/m2
Mid-rise office building drill12 0.78 m/s down stairs
Mid-rise office buildng drill12 0.93 m/s down stairs
Hotel exercise - along corridor (m/s) 9
Daytime Scenario 1 Min 1st Q Med 3rd Q Max Mean
able-bodied participants 0.6 1.1 1.3 1.8 4.0 1.5 wheelchair users 0.2 -- -- -- 1.2 0.8 walking disabled 0.1 -- -- -- -- -- Daytime Scenario 2 able-bodied participants 0.3 0.9 1.1 1.3 1.6 1.1 wheelchair users 0.4 -- -- -- 0.7 0.6 walking disabled 0.7 -- -- -- -- -- Nighttime Scenario able-bodied participants 0.5 1.1 1.3 1.7 3.8 1.5 wheelchair users 0.5 -- -- -- 0.9 0.7 walking disabled 2.4* -- -- -- -- --