Publisher’s version / Version de l'éditeur:
Vous avez des questions? Nous pouvons vous aider. Pour communiquer directement avec un auteur, consultez la première page de la revue dans laquelle son article a été publié afin de trouver ses coordonnées. Si vous n’arrivez pas à les repérer, communiquez avec nous à [email protected].
Questions? Contact the NRC Publications Archive team at
[email protected]. If you wish to email the authors directly, please see the first page of the publication for their contact information.
https://publications-cnrc.canada.ca/fra/droits
L’accès à ce site Web et l’utilisation de son contenu sont assujettis aux conditions présentées dans le site LISEZ CES CONDITIONS ATTENTIVEMENT AVANT D’UTILISER CE SITE WEB.
Controlled Technical Report (National Research Council of Canada. Canadian
Hydraulics Centre); no. CHC-CTR-068, 2010-01
READ THESE TERMS AND CONDITIONS CAREFULLY BEFORE USING THIS WEBSITE.
https://nrc-publications.canada.ca/eng/copyright
NRC Publications Archive Record / Notice des Archives des publications du CNRC :
https://nrc-publications.canada.ca/eng/view/object/?id=6a59e8ce-d1c7-4ab3-8265-9d98c2b2fe7e https://publications-cnrc.canada.ca/fra/voir/objet/?id=6a59e8ce-d1c7-4ab3-8265-9d98c2b2fe7e
Archives des publications du CNRC
For the publisher’s version, please access the DOI link below./ Pour consulter la version de l’éditeur, utilisez le lien DOI ci-dessous.
https://doi.org/10.4224/23002246
Access and use of this website and the material on it are subject to the Terms and Conditions set forth at
Analysis of multi-year ice loads Molikpaq data (1985-86 winter
deployment): final report
Frederking, R.; Sudom, D.; Bruce, J.; Fuglem, M.; Jordaan, I; Hewitt, K.;
Wright, B.
ANALYSIS OF MULTI-YEAR ICE LOADS
MOLIKPAQ DATA (1985-86 WINTER DEPLOYMENT)
FINAL REPORT
R. Frederking and D. Sudom
NRC-CHC
J. Bruce, M. Fuglem and I. Jordaan
Ian Jordaan and Associates Inc.
K. Hewitt
K. J. Hewitt & Associates Ltd.
With some input from
B.
Wright
Brian
Wright
&
Associates
Ltd.
Controlled Technical Report prepared for:
ConocoPhillips Canada
Shell International Exploration and Production
American Bureau of Shipping
Statoil
Keppel Offshore & Marine USA
ExxonMobil Upstream Research Company
Program for Energy Research and Development
Controlled Technical Report CHC-CTR-068
January 2010
EXECUTIVE SUMMARY
This Joint Industry Project was initiated with the purpose of narrowing uncertainties associated with the 1986 multi-year ice loading events on the Molikpaq offshore structure in the Beaufort Sea. Insights gained from prior studies were built upon, and new thinking was applied to the issues. The project was aided by complete access to the extensive library of original Gulf Canada Resources and contractor reports on the Molikpaq deployments in the Beaufort Sea. This included access to the original data tapes, videos, Ice Observer notes, initial analysis notes, and contact with personnel who were involved during the events and had first-hand knowledge. Some of the reports had not been re-evaluated since they were originally prepared. A thorough review was carried out during the present project of the reports prepared in the Gulf Canada Resources Phases 1A/1B and Phase 2 JIPs on Dynamic Ice-Structure Interaction with the Molikpaq. Through these reviews, it became apparent that some of the original assumptions made in deriving ice loads from measured response of Molikpaq instruments could be questioned.
All previous analysis has taken MEDOF panel data as the basis for interpreting ice loading, either directly from the panels or indirectly for calibrating strain gauge and extensometer data. Questions had already been raised as to the state of the sand in the core and the limits on its ability to resist ice loading. The current study also identified softening of the material in the MEDOF panels as a reason why loads estimated using their original calibrations were so large.
The ice load estimates determined by the project team are based on the extensometer readings, combined with the finite element model in the Sandwell report; are supported by geotechnical estimates in the current and previous work of K. Hewitt; are consistent with the analysis of the May 12 decelerating floe impact; and are corroborated by a comparison between the MEDOF panel pressure results and local ice pressures measured in other regions. Ice loads initially determined by the above means were about 50% lower than those determined based on the original calibrations of the MEDOF panels. Analysis by the project team based on probabilistic averaging led to a 15% to 20% reduction of global ice loads. Where phase lock occurred, ice failure was simultaneous and loads were increased by 20% to 30% from the non-simultaneous case. The largest loads are associated with phase lock, and occurred on March 8, April 12 and May 12. Of these, the largest estimated load was for the April 12 event and was in the range of 200 to 250 MN.
The findings of the project team differ from the original Gulf Canada Resources evaluations of over 20 years ago and new analyses which are presented in the 2009 Klohn Crippen Berger report. The Klohn Crippen Berger evaluations conclude that, although the core was not densified, the partial liquefaction during the April 12 event was not due to the loose core. Instead, it was the result of the large cyclic loading experienced by the Molikpaq, on the order of 500 MN, which in turn is based on the assumption that the original MEDOF panels are reliable.
The load estimates based on the original calibration of the MEDOF panels have strongly influenced estimates in past publications regarding the Molikpaq. We believe that the ice loads determined by the present project team are an improved representation of multi-year ice loads on the Molikpaq over the 1985-86 season. New field measurements, either with improved panels on an offshore structure in the Arctic or impacts on a natural feature, are recommended.
EXTENDED ABSTRACT
This Joint Industry Project involved the detailed analysis of time series records to estimate ice forces and global pressures during periods of multi-year ice interaction with the Molikpaq caisson structure. Original data files, reports and videos from the 1985-86 deployment at the Amauligak I-65 location were used in the analysis. The objective of the JIP was to determine global ice loads and pressures resulting from multi-year ice interactions and relate them to ice conditions (thickness, feature shape, drift rate), ice failure mode (crushing, cyclic crushing, mixed modal, flexure, creep), and identify trends. Underlying this was a careful and critical review of all instrumentation systems, analysis methods and data sources used in previous analysis of ice loading on the Molikpaq.
New Findings
The work has identified factors which call into question the instrument calibration factors previously used in the interpretation of Molikpaq ice loads. Analysis of the deceleration of a second-year floe on May 12 gave substantially lower loads than those based on the original MEDOF calibrations. Comparison of local ice pressures from the MEDOF panels showed them to give average local ice pressures on average two times higher than the average local ice pressures from other comparable data sources and ice thicknesses. Softening of the MEDOF panels due to high local loading of the polyurethane buttons has been identified as a factor which explains this discrepancy. Additionally, geotechnical analysis indicated lower ice loads on the Molikpaq than loads predicted from MEDOF panel measurements. Placement of the sand core resulted in it being loose and unable to generate much resistance at the small deformations measured. It is our judgement that historical MEDOF panel derived ice loads are of the order of two times too high. We have developed new calibration factors to reflect this. In this report results are presented based on the new calibration factors, the “Best Estimate” case, and, for comparison with previous Molikpaq analysis based on original MEDOF panel calibration, the “Historical Case”.
Event Selection
The first task of the project was to review all information sources to identify times when multi-year ice was likely interacting with the Molikpaq. This included the hourly ice observations made by environmental observers onboard the Molikpaq throughout the winter, and provided near continuous information on concentration, ice type by partial concentration, and drift speed and direction. They covered ice conditions in an area of a few kilometre radius around the Molikpaq. Because the distinction between second-year ice and multi-year ice is not generally clear, both were included in the inventory. Additionally, logs of videos, which identified multi-year ice that interacted with the Molikpaq, and ice interaction observation sheets or “rubble maps”, which provided sketches and descriptions of ice type and failure mode, were reviewed. These latter records were more useful in identifying actual multi-year ice interactions with the Molikpaq. Twenty-one periods were identified for possible analysis. Within these time periods, when multi-year ice was present, events or Sub-events corresponding to a particular failure mode, drift speed, ice thickness, etc. were identified. Ice Conditions
The 1985/86 winter season at the Amauligak I-65 location was judged to be more severe than normal. In late October, at the time of freeze-up, the edge of the polar pack was further south than normal, with some pockets of multi-year ice extending southwards across the same latitude as the Amauligak location. By early January the landfast ice edge was at the 20 m water depth contour, about 15 km south of the Molikpaq. In late February and early March, strong north-westerly winds brought second-year and multi-second-year ice southwards, into the vicinity of the Molikpaq's location. During the first week of March a mix of multi-year and second-year ice floes moved across the Amauligak location, impacting the Molikpaq in the process. On March 8, the southerly ice drift stopped, being constrained
by the landfast ice to the south. The ice then remained stationary, initiating a few creep loading events, until April 12, when the ice movement generated the largest loading event of the winter. During the remainder of the winter the ice was mobile and there were several encounters with second-year and multi-second-year ice.
Ice thicknesses for events were generally estimated by the Ice Observer and noted on sketches of interaction events. Video records were used to verify the visual observations. There is considerable uncertainty in the ice thickness observations, ± 0.5 m for ice around 2 m thick, and ± 1 m for ice 3 m and thicker. The ice which interacted with the Molikpaq on March 7-8 and April 12 was stationary for four weeks following March 8. This allowed access to the ice surface to measure ice thickness by drilling holes along the edges of the broken track and other areas, some that subsequently moved past the Molikpaq on April 12. It was for these events that the best measurements of ice thickness were obtained. Average thickness in specific areas related to loading events varied from 3.3 m to 5.9 m. The coefficient of variation from over 70 measurements of multi year and second-year ice in the region was 0.37. The feature which resulted in the largest load on the structure was a multi-year hummock 70 m long and with a 3 m sail height surrounded by ice with an average thickness of 3.3 m. The maximum load was limited by failure of thinner ice at the back side of the hummock.
Description of Molikpaq and Instrumentation
The Molikpaq is an annular steel caisson supporting a deck structure. The core of the annulus was filled with sand, which provided a portion of the horizontal resistance. The caisson has near vertical sides (7° from the vertical at the waterline) and is octagonal in plan. Because the structure was one of the earliest purpose-built structures for exploratory drilling in water depths greater than 20 m, it was extensively instrumented to gather information on the ice loading it experienced. A variety of sensors were installed in and around the structure:
- Ice load measurement systems on the caisson: MEDOF panels, strain gauges, extensometers, tiltmeters and accelerometers
- Geotechnical data measurement systems in the sand core and berm: pore pressure cells, total pressure cells, in-place inclinometers, manual inclinometers, electric piezometers and manual piezometers
There were 512 channels of instrumentation and a data acquisition system to record the output of the instruments. Depending upon trigger levels on instrument output, the recording system could record data in several modes:
- DAY files for which average, minimum and maximum values from a 1 Hz scan of all 512 channels were recorded every 5 minutes. This record was for periods of low or no ice loading, and was useful for establishing baseline or zero readings for the instruments.
- FAST files were triggered automatically when certain measured values were exceeded, or manually at the operators discretion. In this case all 512 channels were recorded at 1 Hz for 65 minutes.
- EVENT, or Burst, files were triggered by even more selective criteria, and a reduced selection of 128 channels was recorded at 50 Hz for about 60 seconds.
Another, and equally important part of the measurement program, was visual observations and video records of ice interaction to compliment the measurement data.
Evaluation of Instrumentation
Before determining ice forces, a comprehensive evaluation and assessment was made of the instrumentation used to measure ice loads on the Molikpaq caisson faces (MEDOF panels), and the Molikpaq caisson response (strain gauges, extensometers, accelerometers and tiltmeters). The instrumentation for measuring the response of the core was also examined (in-place-inclinometers and
manual inclinometers). In previous analyses, the MEDOF panels were taken as the basis for measurement of ice forces, and strain gauges and extensometers were calibrated from the MEDOF panel forces. In the original analysis projects by Gulf Canada Resources Limited (GCRL), extensive effort was put into verifying the response of the MEDOF panels, and identifying independent means of calibrating the strain gauges and extensometers. For the MEDOF panels, it focused primarily on evaluating and correcting for their creep behaviour. It was not until the latter phase of the GCR studies that an independent finite element calibration of the extensometers for determining ice loads was undertaken (Sandwell report in Appendix C of Rogers et al (1991b)). It used a 3-D finite element model of the caisson, friction under the base, and passive pressure resistance from the sand core on the loaded face and active pressure resistance from the sand core on the other faces. Even though the Sandwell report stated the sand core was dense, the actual stiffness values used in the analysis were likely for a loose sand. The analysis gave caisson ring stiffness values that were from one third to two thirds the value of 6 MN/mm obtained from MEDOF panel force measurements. This large difference in calibration factors led to a detailed examination of all factors which might explain the discrepancy. Regardless of the instrument used for determining ice loads, there should be a fixed relation between them since they were responding to the same ice load. There is uncertainty, however, in the relation between load determined from extensometers, strain gauges and MEDOF panels. Using the MEDOF panels as a base, the factors relating MEDOF panels to extensometers have a coefficient of variance (COV) of 0.23 and the factors between strain gauges and MEDOF panels a COV of 0.34.
MEDOF Panel Softening
Because so much depended on the MEDOF panels, their performance was thoroughly assessed. Unfortunately the panels no longer exist, so they can not be recalibrated. Softening of the polyurethane buttons, which are the load supporting elements in the MEDOF panels, was identified by the Ian Jordaan and Associates team as a factor which could explain the discrepancies in estimated forces (see Chapter 3 of Appendix B). The literature on polymers has been searched and the work of Qi and Boyce (2005) on polyurethane was identified as the closest to describing the loading conditions to which the button material in the MEDOF panels was subjected. This publication presents measurements on polyurethane under high stresses of 20 MPa, and repeated loading. These loading conditions are similar to those experienced by the buttons in the MEDOF panels during ice crushing, when it is known that local pressures in “high pressure zones” are of the order of 10 to 20 MPa on areas 0.3 m by 0.3 m. Pressures on the polyurethane buttons themselves would be twice these values. The Qi and Boyce tests showed that polyurethane exhibited non-linear behaviour for stress above about 5 MPa. Furthermore, softening by about a factor of two after only a few repeats of these high load-unload cycles was observed. This behaviour, inherent in polyurethane, is convincing evidence that softening of the MEDOF panels is a real factor.
MEDOF panel and strain gauge data from the 1984-85 deployment of the Molikpaq at Tarsiut P-45 was thought to provide a means of verifying MEDOF performance before the panels were subjected to extensive loading. Review of the Tarsiut data indicated the MEDOF panels had already experienced extensive ice loads by the time the first measurements were recorded. The occurrence of softening, after only a few load cycles, is why analysis of the 1984-85 Tarsiut data did not help clarify the panel softening issue.
Extensometer Response
The Sandwell (1991) report was prepared for GCR to develop an independent calibration of extensometer measurements as a basis for the determination of ice loads. The report presents a finite element analysis (FEA) of the combined caisson and core of the Molikpaq, the only analysis of the total structure. It was done using COSMOS on a mini-computer. The original FEA for the design of the Molikpaq was done on a mainframe computer using STARDYNE with non-linear soil properties. In a comparison case, for the March 25 loading event, the results of the two programs compared closely. Subsequent cases were run using COSMOS to explore the influence of load magnitude, load distribution, core sand properties and stiffness on calculated extensometer response. COSMOS had the shortcoming that only linear soil properties could be included.
The Sandwell report considered three load distributions across the structure; a uniformly distributed load (UDL) just on the long face, a uniform distributed load (full UDL) across the whole structure including the corners, and a distribution, termed the “Most Likely”, in which the corner loads were reduced. The latter two distributions generated lateral forces acting inwards on the corners, which significantly increased the apparent stiffness of the caisson (see Chapter 2 of Appendix B). For a given total load on the structure, all other factors being the same, a uniform load on the long face gave a ratio of 2.7 MN/mm. If the same load was distributed uniformly across the centre face and corners, the ratio was 3.9 MN/mm in terms of the global load and 2.3 MN/mm in terms of the long face load. In the case of the “Most Likely” distribution, the factors were 3.2 and 2.3 MN/mm. The proportion of load transmitted to base friction in the model had a significant effect. Increasing the base friction loading proportion from 20% to 40% to 60% increased the ratio from 3.6 MN/mm to 4.1 MN/mm to 4.5 MN/mm. These factors are all much lower than the “historical case” value of 6 MN/mm for face loading, but they demonstrate that determining a face load or global load from the caisson distortion ratio depends upon the assumptions used.
Shell also shared some of their experience with the redeployment of the Molikpaq to offshore Sakhalin. Direct comparisons were difficult because the Sakhalin configuration of the Molikpaq rested on a 15 m high annular spacer, the sand core was densified and the waterline was about 3 m lower on the caisson. Their extensometer calibration factor, from field measurements, averaged 6 MN/mm, but with large scatter. Based on the differences between Sakhalin and the Beaufort deployments, a lower value would have been expected from the Beaufort experience.
The IJA team used the results of the Sandwell (1991) FEA to determine a stiffness matrix which allows face and global loads to be determined under biaxial loading conditions; that is using deformations across both face pairs and corner pairs to determine loading. The methodology has been developed successfully, and was applied to four events. Where the load was predominantly normal to one of the faces, face load and global load were very similar. It had the largest affect for the March 7 event where there was loading on two faces. For event 0307B (late afternoon March 7) the matrix method gave a global load of 95 MN, compared to 80 MN on a single face.
Results of MEDOF panel and strain gauge measurements show that ice load is not uniform across the face. For example, on March 25 the distribution was U-shaped with the centre load only ¼ of the loads towards the edges, whereas on May 12 the centre load was 2 to 3 times greater than the load towards the edges. An analytical analysis in Appendix E indicates that such face load distributions can make a difference of ± 30% in the calibration factor for converting extensometer measurements of diametral change of the caisson to a face load.
May 12 Impact Event
The maximum force during the May 12 event was calculated by the IJA team based on the floe deceleration, assuming that an accurate time trace of the relative force can be obtained from the
extensometer readings. The mass and initial velocity of the free-floating floe were determined with reasonable accuracy from a helicopter survey of the extent of the floe and radar tracking of its drift. The caisson ring deformation was measured with extensometers, and can be converted to a global interaction force, knowing the stiffness of the caisson. Observers noted the time of initial impact and the time when the flow came to a halt. The momentum of the floe (mass times velocity) is equal to the impulse (area under the force-time curve from time of initial impact to when the floe stopped). Equating the momentum to the area under the force-time curve, global caisson stiffness was determined to be 2.2 MN/mm, substantially less that the historic value of 6 MN/mm used in previous analysis. The maximum force based on floe deceleration and ring deformation (global stiffness 2.2 MN/mm) was 105 MN, compared to 267 MN in previous analysis of extensometer data. Floe deceleration analysis for the May 12 event is presented in Section 11.12.
Local Ice Pressure Comparison
Another means of verifying the performance of the MEDOF panels is to compare the local ice pressures determined from the MEDOF panels with local ice pressures from other measurement sources such as the STRICE project in the northern Baltic. A rigorous basis for comparison of local pressures from several sources, covering a broad range of ice thicknesses is presented in the IJA report (Appendix B, Chapter 6), from the Ph.D. thesis of Rocky Taylor. This analysis takes into account the statistics of local pressures during an event, a weighting relating to the duration of the event, and the ice thickness. In this analysis, and other work, a trend of decreasing pressure with increasing ice thickness has been identified, a trend analogous to the familiar one of local pressure decreasing with increasing area. Mean local ice pressures from Molikpaq (MEDOF panel) and STRICE data are plotted below for a range of ice thicknesses and a power relation fit to each data set. The data sets do not overlap in thickness, but the trend lines demonstrate that the MEDOF panels over-predict local ice pressures by at least a factor of two.
0 0.2 0.4 0.6 0.8 1 1.2 0.3 0.4 0.5 0.6 0.7 0.8 Ice Thickness (m) M e an Ic e Pre s s u re (MPa) Molikpaq Data STRICE Data
Power (Molikpaq Data) Power (STRICE Data)
Geotechnical Response
The geotechnical evaluation conducted by K.J Hewitt & Associates Ltd. included a review of: • The initial design which emphasized the importance of the core sand properties. • The as-placed (in situ) state of the core sand at Amauligak.
• Performance predictions based on various models, both geotechnical and structural. • Measured displacements.
As a result, ice load estimates were made for several events. The largest load estimated by these means was during the event on the morning of April 12, 1986. It was concluded that since the global displacements were relatively small and that the sand core was in a loose state that this load was about 200 MN. However because of the inherent uncertainties in the evaluation of the properties of the composite unit combined with the uncertainties in determining displacements, it is believed that the actual load could differ from this estimate. Therefore it was concluded that the load could have been as high as 250 MN or as low as 150MN.
Klohn Crippen Berger Report and other Geotechnical input
ConocoPhillips Canada commissioned Klohn Crippen Berger to review select elements of the 1986 Molikpaq JIP work to provide a broader understanding of the geotechnical performance of the Molikpaq, as well as ice-structure interaction issues. The results of this review were presented to a meeting of Participants’ geotechnical experts on February 25. The presentation and subsequent report covered an assessment of the core density, assessment of ice load and platform resistance for the April 12 event, methods and calibration used to estimate ice loads, and a treatment of ice crushing. The conclusion of the report was that, using previously published model calibrations for the Molikpaq core sand, the NorSand computed global load versus caisson ovalling was a good match to the central trend of the measured data for the March 25 and May 12 events. The inference from this match is that the MEDOF panel calibrations were as stated by GCRL, and that the MEDOF panels did not deteriorate during the first two deployments in the Canadian Beaufort Sea. Geotechnical experts from the three Participants, who attended the February 25 presentation,
agreed with the KCB report conclusion that the sand core was dilative. Professor K.T. Law of
Carleton University carried out an independent geotechnical review of K.J. Hewitt & Associates’ 2008 and 2009 reports, as well as the Klohn Crippen Berger report. His reports are in Appendix J. He explained the different understandings of the core sand behaviour in the KCB report and by Hewitt. While acknowledging the core could be mildly dilative, he questioned some of the analysis in the KCB report, particularly the absence of an explanation of the high ice loads compared to the small measured horizontal movements.
Response to the Klohn Crippen Berger Report and other Geotechnical input
From a geotechnical perspective there was nothing in the KCB report that changed the opinions presented in the report by K.J. Hewitt & Associates Ltd. The main theme in the KCB report is that there have been significant advances in interpretation and modelling capabilities in the past twenty years and these advances verify GCRL’s initial assessment of the as-placed condition and subsequent performance of the Molikpaq at I-65. However they did not directly address the issue of the ‘stress level bias’ which accounts for the difference between GCRL’s initial assessment and our assessments which show the core sand to be contractive. The report also fails to make any mention that the performance of the Molikpaq at I-65 was exactly as anticipated in the initial design in 1982, if the unit was deployed with a loose sand core and subjected to relatively low ice loading. Likewise the Sandwell extensometer calibration study is dismissed as it did not match the MEDOF panel based load estimates. The KCB report also contained a review of the ice-structure interaction results and understanding of ice mechanics up to the time of the 1986 JIP. Understanding of ice mechanics has advanced since then.
Professor K.T. Law offers two opposing opinions regarding the state of the core sand. Based on his review of the KCB report he concludes that the core sand was dilative and not liquefiable. In contrast he states that 'Based on general evidence, the liquefaction potential of the core sand was high.' He acknowledges that this statement is consistent with the Hewitt report which concludes that the core sand was contractive and liquefiable. He does not offer an explanation for this discrepancy. He does however make the important observation that because of the small horizontal displacements, the estimated ice loads using various models are generally about half those proposed in the KCB report. “Historical Case”
This JIP has established that geotechnical limitations on sand core behaviour and softening of the panels under normal service loading bring into question the use of original MEDOF calibration values to determine ice loads. Before establishing our “Best Estimate” of ice load and pressures, factors for relating extensometer, strain gauge and MEDOF panel results to each other are necessary. All previous analysis of ice loading on the Molikpaq has started with the MEDOF panels, since they directly measured ice forces on the outer faces of the caisson. MEDOF-based ice loads were subsequently used to calibrate strain response of bulkheads and deformation response of the caisson ring measured by extensometers, to ice loading. In spite of uncertainty of absolute values, MEDOF panel results do provide a basis for establishing relative values for calibrating the strain gauges and extensometers. In analysing and presenting results in this report we have presented two cases, one a “Historical Case” based on the original MEDOF calibration and relative values from strain gauge and extensometer measurements, and the other, a “Best Estimate” case, in which all results are adjusted to our best estimate of the load-caisson deformation relation from extensometer measurements. For the “Historical Case”, a factor of 6 MN/mm was used to convert diametral change measured with the extensometers to a face load. The extensometer factor was determined from 20 calibration measurements, and has a coefficient of variation of 0.27. Strain gauge output was converted to a local ice load using an average factor of 24 kN/μs for a width of 2.44 m. This strain calibration factor was adjusted to take into account ice thickness and position on the caisson, and the factor was refined to take values from Table 2 of this report. The strain factor was determined from 39 measurements and had a coefficient of variation of 0.34. The “Historical Case” also provides a basis for comparing results from previously published work with those of this JIP.
“Historical Case” Ice Loads and Pressures
For this report, twenty-one time periods of interest where multi-year or second-year ice was present were investigated. Thirteen of these time periods have been broken down further into a number of events and Sub-events, and analysed in detail. Loads from each of the MEDOF panel, strain gauge and extensometer results have been calculated and presented separately. See Appendix K for time series plots of each event. Each Event or Sub-event includes a time series record of load related to periods when the size, thickness and shape of multi-year ice features are relatively uniform or defined; e.g. a hummock. Selected video records were viewed to verify documented failure behaviour. An event could be anywhere from a few minutes to 10s of minutes. Loading from the south and west, where there were no MEDOF panels, was analysed using strain gauge and/or extensometer data. The characterization of ice thickness was an important part of this task. Information from visual estimates and limited on-ice surveys was compiled from various sources and cross-checked, wherever possible. Global pressures from the “Historical Case” approach are plotted as a function of ice thickness and compared to predictions of equation [A.8-22] of the ISO DIS 19906 Arctic offshore structures standard for a 58 m wide structure in Beaufort Sea conditions.
0.0 0.2 0.4 0.6 0.8 1.0 1.2 1.4 1.6 1.8 2.0 0.0 1.0 2.0 3.0 4.0 5.0 6.0 7.0 8.0 Ice thickness (m) Gl ob a l Pr essur e ( M P a ) MEDOF peak
EXT peak (N+S or E+W) SG peak ISO 19906, w = 58 m May 12, 1986 Event 0512A (North face) April 12, 1986 Event 0412A (Hummock on East face)
Global pressure “Historical Case” values compared with ISO DIS 19906 Eqn. [A.8-22]
“Best Estimate” Ice Loads and Pressures
The basis for establishing our “Best Estimate” of ice loads, as previously described, included the results of the local ice pressure comparison, geotechnical limitations of sand core response, May 12 floe impact analysis and a MEDOF panel softening mechanism. Our “Best Estimate” of the extensometer calibration used for ice load calculations was 3 MN/mm, 50% of the “Historical Case” value. This factor is likely at the upper end of the range of extensometer factors, but has been selected at this level to err on the side of caution. As a general rule all ice loads, whether determined from extensometers, strain gauges or recalibrated MEDOF panels should be treated as having a coefficient of variation of 1/4 to 1/3. Another method of dealing with this is through estimates of the statistical parameters in a probabilistic model. This is discussed briefly in the IJA report.
The “Best Estimate” face loads determined for the 19 events from the 13 time periods are presented below. Instances where only one or two strain gauges were available for measurement, are marked with an * or **. Note that after April 12 there were three active strain gauges on each face.
0 20 40 60 80 100 120 140 160 180 200 0307 A (N ) 0307 A (W ) 0307B ( N) 0308 A (N ) 0308 B (N ) 0308C (N)0308 D (N ) 0325 A (N ) 0325 B (N ) 0412 A (E ) 0412A ( S) 0412B ( E) 0412C (E)0412 C (S) 0412 D (E) 0412D (S)0412E ( E) 0412 E (S) 0512 A (N ) 0522A ( E) 0522 A (N ) 0522B ( E) 0522 B (N ) 0602 A (E) 0602B ( E) 0625 A (W )
Event Number and Face
F
ace Lo
ad
(MN)
MEDOF peak
EXT peak (N+S or E+W) SG peak * * * * * * * * **
* SG face load extrapolated from SG N2 and N3 (gauge N1 unavailable) ** SG face load extrapolated from SG E2 (gauges E1 and E3 unavailable)
Face loads calculated using “Best Estimate” approach
Using ice thickness determined from visual estimates and limited on-ice surveys, maximum global pressures were determined from maximum loads on the 58 m long face for each event and plotted in the following figure.
The maximum global pressures from the 19 events, for our “Best Estimate” case of global pressures for each measurement system, have been plotted as a function of ice thickness in the figure below. For comparison purposes, global pressure as a function of ice thickness for a 58 m wide structure in Beaufort Sea conditions has been calculated using equation [A.8-22] from the ISO DIS 19906 Arctic offshore structures standard. All global pressure values fall below the prediction line. Any recommendation for change to the ISO standard is outside the scope of this project.
0.0 0.1 0.2 0.3 0.4 0.5 0.6 0.7 0.8 0.9 1.0 0307 A (N) 0307A (W ) 0307 B (N ) 0308 A (N) 030 8B (N) 0308 C (N ) 0308 D (N) 0325 A (N ) 0325 B (N ) 0412A (E) 0412A (S) 0412B (E) 0412 C (E ) 0412 C (S ) 0412 D (E ) 0412 D (S ) 0412 E (E ) 0412E (S) 0512 A (N) 0522 A (E ) 052 2A (N) 0522B (E) 0522 B (N ) 0602A (E) 0602B ( E) 0625 A (W )
Event Number and Face
G lob al Pr essure (M Pa) MEDOF peak
EXT peak (N+S or E+W) SG peak
Global face pressures (for width of 58 m) calculated using “Best Estimate” approach
0.0 0.2 0.4 0.6 0.8 1.0 1.2 1.4 1.6 0.0 1.0 2.0 3.0 4.0 5.0 6.0 7.0 8.0 Ice thickness (m) Gl o b al P res su re (MPa) MEDOF peak
EXT peak (N+S or E+W) SG peak ISO 19906, w = 58 m May 12, 1986 Event April 12, 1986 Event 0412A (Hummock on East face)
Probabilistic Averaging
The MEDOF panels and strain gauges only cover about 10% of the east and north faces. With random loading on each of the instruments, a linear averaging of the individual group pressures to get a face load may over-predict the load. A method of analysing the MEDOF panel and strain gauge data using probabilistic averaging has been applied and it results in lower face loads than linear averaging. The approach is described in detail in the IJA report (Chapter 5 of Appendix B). The results of this analysis are summarized in the Table below for a number of events. Two cases are presented, one using a linear averaging method for the MEDOF panel loads and the other using probabilistic averaging. In the “No Bottom” case the lower MEDOF panels were ignored and in the “Uniform” case they were included in the load calculation. For creep failure there was no reduction, however for crushing failure, where there was little or no correlation between panel group loads, the load reduction was between 15 and 20%. Note that the ice loads in the Table below are calculated using the “Historical Case” (extensometer calibration factor of 6 MN/mm). “Best estimate” ice load values would be 50% lower.
Maximum face loads (MN) with linear averaging (LA) and probabilistic averaging (PA)
LA LA PA PA
No Bottom Uniform No Bottom Uniform
Mar-25-N-1 Creep 103 103 102 102 Apr-12-E-1 Crushing 169 169 139 139 Apr-12-E-2 Crushing 188 375 158 320 Apr-12-E-3 Crushing 84 92 73 82 May-12-N-1 Crushing 168 344 141 296 May-22-N-1 Creep 108 140 107 139 May-22-N-2 Crushing 123 214 103 180 Jun-02-E-1 Crushing 128 129 114 116 Jun-02-E-2 Creep 86 87 85 86
Maximum Nominal Load Maximum Nominal Load
Failure Mode Event
Phase Lock
The issue of phase lock has been examined. It is most clearly exemplified on May 12 when strain gauge results on the north face showed the simultaneous response of the three main bulkheads. This is clear in the EVENT files which were recorded at 50 Hz. Examining a few cases where phase lock was occurring, demonstrated that the peak loads were 20 to 30% greater than for times immediately before or after, when the loading across the face was random. Maximum loads on March 7 and 8, April 12, May 12, June 2 and June 25 were affected by phase lock. For structures not likely to have similar response to the Molikpaq (stiffer ones), measured loads could be reduced by 20 to 30%. Phase lock is discussed in Section 12 of this report.
TABLE OF CONTENTS
Executive Summary ... i
Extended Abstract ... iii
1. Introduction ... 1
1.1 Project task descriptions ... 1
1.2 Overview of previous work on Molikpaq ice loads... 3
2. Selected Events for Detailed Analysis... 5
2.1 Event selection... 5
2.2 Winter 1985/86 ice season... 5
3. Instrumentation and Data Sources ... 7
3.1 MEDOF panels ... 8
3.2 Strain gauges ... 9
3.3 Extensometers... 10
3.4 Tiltmeters... 10
3.5 Accelerometers ... 10
3.6 Pore pressure cells and total pressure cells... 11
3.7 In-place inclinometers and manual inclinometers ... 11
3.8 Electric piezometers and manual piezometers... 11
3.9 Data acquisition ... 11
3.10 Global response of Molikpaq to ice loading... 12
4. Calculation of Face Loads ... 15
4.1 MEDOF panels ... 15
4.2 Strain gauges ... 17
4.3 Extensometers... 18
5. Medof Panel, Strain Gauge and Extensometer Relation ... 20
5.1 MEDOF panels ... 20
5.1.1 Softening of polyurethane material in MEDOF panels (IJA Team)... 22
5.1.2 MEDOF Panel and strain gauge calibration trends ... 22
5.2 Strain gauges ... 24
5.2.1 Strain gauge calibration experience at Sakhalin... 25
5.3 Extensometers... 25
5.3.1 Extensometer calibration experience at Sakhalin ... 26
6. Ice Loads from Geotechnical Analysis and Response (K.J Hewitt & Associates Ltd.) ... 27
6.1 Summary... 27
6.2 Conclusions ... 29
7. Other Geotechnical Inputs to the JIP ... 31
8. Probabilistic Averaging (Ian Jordaan and Associates Team) ... 32
8.1 Introduction ... 32
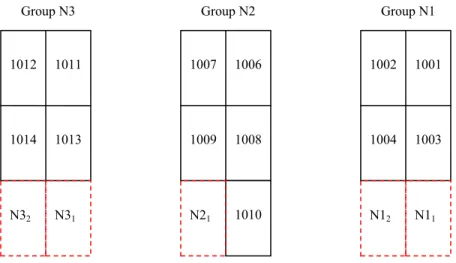
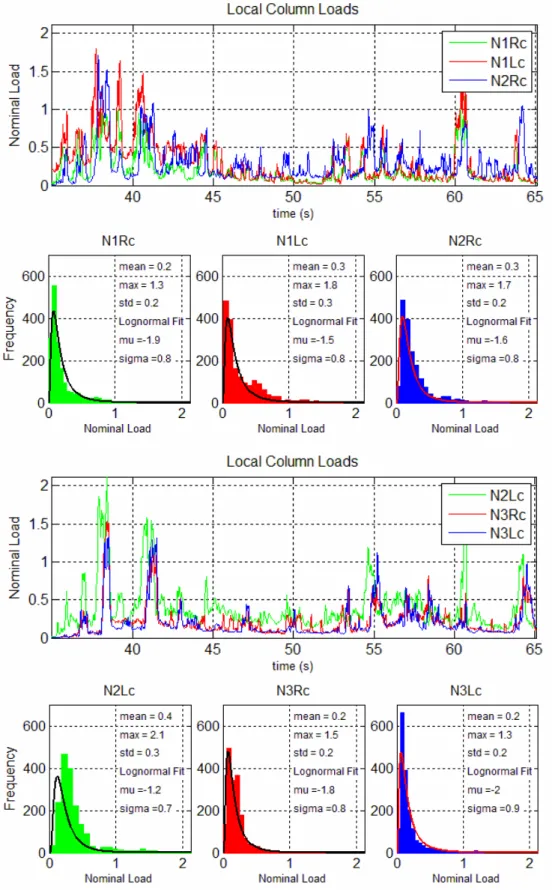
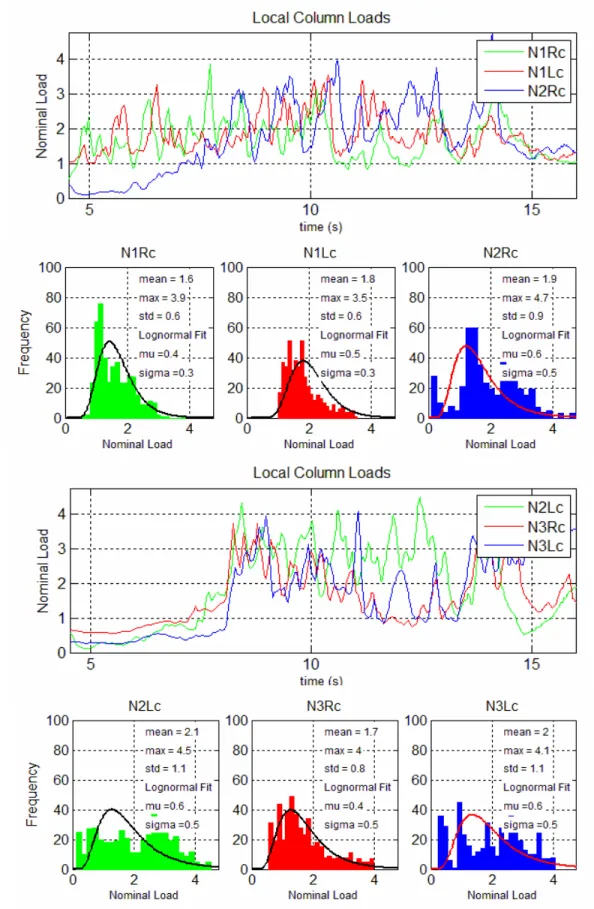
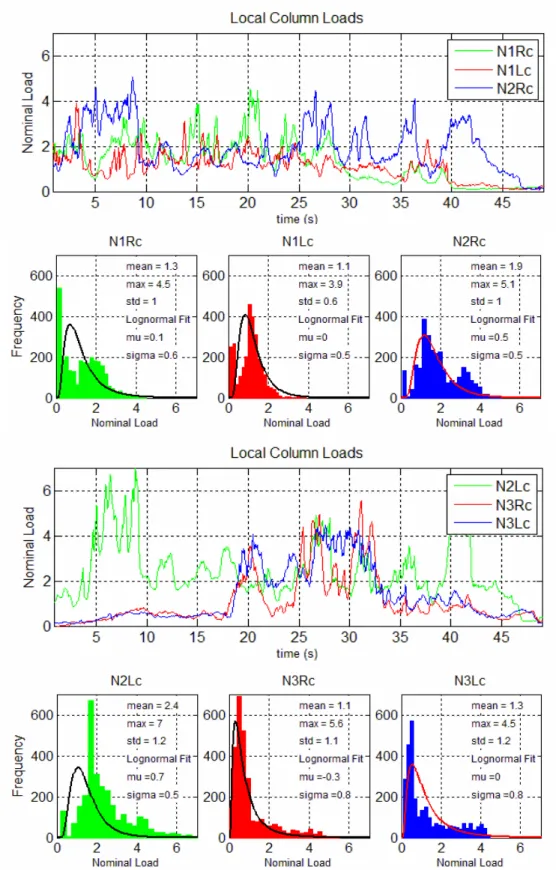
8.2 Histograms for Individual MEDOF Columns ... 33
8.3 Autoregressive Method... 39
8.4 Direct Method... 40
8.5 New Method for Project using Bi-functional Correlation Relationships ... 41
8.6 Determination of Model Parameters and Calibration ... 42
8.7 Development of Correlation Functions ... 45
8.7.1 Comments on Load Distributions... 45
8.7.2 Correlation between Columns based on Middle and Top Panel Loads... 46
8.7.3 Development of Bi-functional Correlation Functions for Creep and Crushing... 47
8.8 Linear vs. Probabilistic Estimation of North and East Face Loads based on Nominal MEDOF Loads ... 49
8.8.1 Treatment of Bottom Panel Loads for Thick Ice ... 49
8.8.3 Results for Linear and Pressure Averaging ... 51
8.9 Other Failure Modes and Factors ... 52
9. Ice Information and Conditions ... 56
9.1 Multi-year ice thickness from March 1986 survey... 58
9.2 Multi-year ice thickness from Nares Strait ... 60
9.3 Amount of multi-year ice interaction with Molikpaq... 61
10. Video Analysis by Brian Wright ... 63
10.1 Time Lapse Video Cameras ... 63
10.2 Analysis of Video Records ... 66
10.2.1 General ... 66
10.2.2 Time Markers ... 66
10.2.2.1 March 7, 1986 ... 66
10.2.2.2 May 22, 1986 ... 67
10.2.3 Ice Failure Modes... 68
10.3 Key Results... 71
11. Description of Ice Loading Events ... 72
11.1 November 10, 1985 ... 72
11.1.1 Description of ice conditions and loading events... 72
11.1.2 Event analysis ... 73
11.2 November 19, 1985 ... 73
11.2.1 Description of ice conditions and loading events... 73
11.2.2 Event analysis ... 74
11.3 November 27, 1985 ... 74
11.3.1 Description of ice conditions and loading events... 74
11.3.2 Event analysis ... 75
11.4 December 16, 1985... 75
11.4.1 Description of ice conditions and loading events... 75
11.4.2 Event analysis ... 75
11.5 March 7, 1986... 75
11.5.1 Description of ice conditions and loading events... 75
11.5.2 Event analysis ... 77
11.6 March 8, 1986... 82
11.6.1 Description of ice conditions and loading events... 82
11.6.2 Event analysis ... 83
11.7 March 22-24, 1986 ... 87
11.7.1 Description of ice conditions and loading events... 87
11.7.2 Event analysis ... 88
11.8 March 25, 1986... 88
11.8.1 Description of ice conditions and loading events... 88
11.8.2 Event analysis ... 89
11.9 March 27, 1986... 92
11.9.1 Description of ice conditions and loading events... 92
11.9.2 Event analysis ... 92
11.10 April 6-7, 1986 ... 93
11.10.1 Description of ice conditions and loading events... 93
11.10.2 Event analysis ... 93
11.11 April 12, 1986... 94
11.11.1 Description of ice conditions and loading events... 94
11.11.2 Event analysis ... 98
11.12 May 12, 1986... 108
11.12.2 Event analysis ... 111
11.12.3 Maximum Force Based on Floe Deceleration and Ring Deformation (IJA team)... 113
11.13 May 22, 1986... 117
11.13.1 Description of ice conditions and loading events... 117
11.13.2 Event analysis ... 118
11.14 June 2, 1986... 123
11.14.1 Description of ice conditions and loading events... 123
11.14.2 Event analysis ... 124
11.15 June 25, 1986... 127
11.15.1 Description of ice conditions and loading events... 127
11.15.2 Event analysis ... 128
12. Effect of Phase Lock on Ice loads ... 129
12.1 Example of phase lock events on May 12 ... 129
12.2 Periods of phase lock... 133
12.3 Events where peak loads coincided with phase lock ... 135
13. Ice Load estimates ... 137
13.1 “Historical Case” ice loads and global pressures ... 137
13.2 “Best Estimate” ice loads ... 141
14. Summary... 144
15. Acknowledgements ... 147
16. References ... 147
APPENDICES
Appendix A List of Time Periods with SY or MY Ice
Appendix B Molikpaq Analysis Report (by Ian Jordaan & Associates) Appendix C MEDOF Panel Performance Assessment
Appendix D Extensometer Sign Convention
Appendix E Background to Strain Gauge and Extensometer Calibrations
Appendix F Strain Gauge and Extensometer Calibration Factors from MEDOF Panels Appendix G Video Analysis (by Brian Wright & Associates)
Appendix H Ice Thickness Documentation
Appendix I Geotechnical Analysis (by Kevin Hewitt & Associates)
Appendix J Review of Molikpaq Geotechnical Material (by Dr. Tim Law of Carleton University) Appendix K Event Summary Table and Face Load Plots
LIST OF FIGURES
Figure 1 Placement of MEDOF panels, strain gauges, extensometers and tiltmeter on the
Molikpaq ... 8
Figure 2 MEDOF panels on the North, Northeast and East faces of the Molikpaq... 9
Figure 3 Ice load distribution into caisson and core (from IJA report, Appendix B) ... 13
Figure 4 Relative deformation of the caisson from extensometer measurements under no-load condition (left), and with loading mainly on the east face (right). Extensometers are shown as red stars in the centre of each face. The deformation is scaled up by a factor of 667:1. ... 14
Figure 5 Plan and section views of caisson deformation ... 14
Figure 6 Panel groups on north face with pseudopanels shown in red ... 16
Figure 7 Example of calibration of a MEDOF Panel (Gulf Canada Ltd., 1987b) ... 21
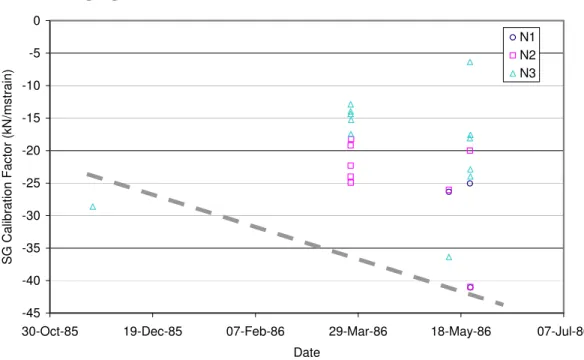
Figure 8 Strain gauge-MEDOF calibration factors for the east face over the 1985-86 season. ... 23
Figure 9 Strain gauge-MEDOF calibration factors for the north face over the 1985-86 season. ... 23
Figure 10 Pressure Averaging for Crushing Failure Model... 33
Figure 11 Histograms of nominal loads of columns for the North face during event 01 ... 35
Figure 12 Histograms of nominal loads of columns for the North face during event 23 ... 36
Figure 13 Histograms of nominal loads of columns for the North face during event 58 ... 37
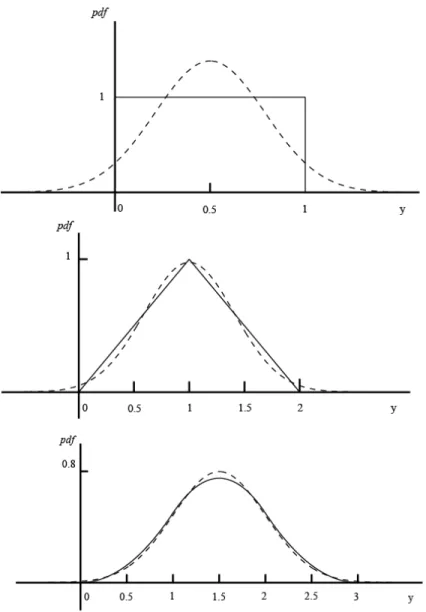
Figure 14 Addition of uniformly distributed random quantities; dotted line is normal distribution (Jordaan, 2005)... 38
Figure 15 Illustration of exponential correlation function... 40
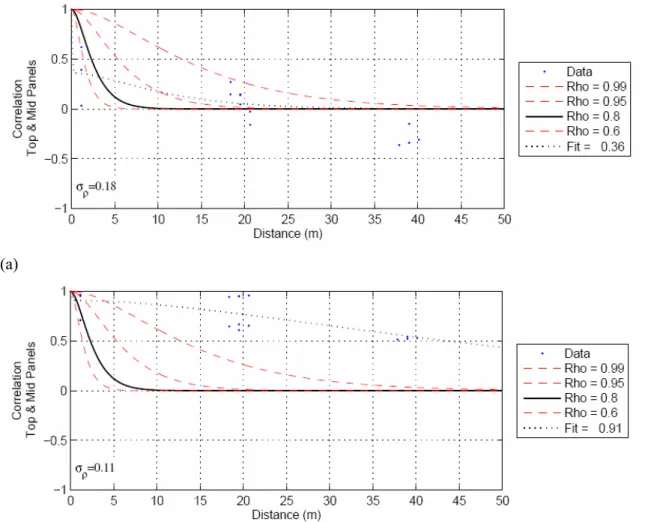
Figure 16 Examples of correlation coefficients as a function of separation for a) crushing and b) creep ... 47
Figure 17 Bi-functional correlation models chosen for a) crushing type events and b) creep type events... 48
Figure 18 “Nominal” Contact Area for Columns given Uniform Thick Ice ... 49
Figure 19 Illustration of effect of bottom areas with no panels ... 50
Figure 20 Example Crushing Event... 53
Figure 21 Example Creep Event... 53
Figure 22 Example Flexure Event ... 54
Figure 23 Variation in Contact Thickness ... 54
Figure 24 Variation in Contact Width ... 54
Figure 25 “Caisson/ice interaction” report for April 12 morning, 1986... 57
Figure 26 “Rubble map” from March 7, 1986... 58
Figure 27 Survey of ice thicknesses surrounding the Molikpaq, March 1986 ... 59
Figure 28 Probability distribution of second-year and multi-year ice around the Molikpaq in March – April 1986. ... 60
Figure 29 Plot of ice thickness variation ... 61
Figure 30 Schematic illustration of the primary and secondary locations of the three time lapse video cameras that were placed on the Molikpaq. ... 63
Figure 31 A view of a first-year ridge interaction on the west side of the caisson, taken from the derrick top camera on March 3, 1986. The ice deflector is in the foreground. ... 64
Figure 32 A joint view of the east (left) and north (right) faces of the caisson taken from the two cameras mounted on the NE flare boom. The ice was crushing against the caisson’s north face, with remnant debris sliding along its east face at the time... 64
Figure 33 A similar view of the north and east faces of the caisson during darkness hours. In this case, the ice was failing against the east face in mixed modes, with broken ice debris sliding westwards along the caisson’s north face... 65
Figure 34 An example of the correspondence in time markers seen on the video records and on north face ice load group plots, in this case, on March 7, 1986. ... 67
Figure 35 An example of the correspondence in time markers seen on the video records and on the ice load group plots, in this case, on May 22, 1986... 68 Figure 36 Survey of ice conditions surrounding the Molikpaq for March – April 1986. The
wake or track of the ice past the structure on March 7 - 8, 1986 is outlined in red... 76 Figure 37 March 7 – West face loading, Event 0307A... 79 Figure 38 March 7 - North face loading, Event 0307A ... 80 Figure 39 March 7 - East face loading, Event 0307B... 81 Figure 40 March 7 - North face loading, Event 0307B ... 82 Figure 41 March 8 - North face loading, Event 0308A ... 84 Figure 42 March 8 - North face loading, Event 0308B ... 85 Figure 43 March 8 - North face loading, Event 0308C ... 86 Figure 44 March 8 - North face loading, Event 0308D ... 87 Figure 45 Loads on North face and Northeast corner, March 22-24 ... 88 Figure 46 March 25 - North face loading, Event 0325A ... 90 Figure 47 March 25 - North face loading, Event 0325B ... 91 Figure 48 Comparison of caisson face movement and tilt on March 25 ... 92 Figure 49 April 4-8, North face load ... 94 Figure 50 Survey of ice conditions surrounding the Molikpaq for March – April 1986. The track
of the ice past the structure on April 12, 1986 is outlined in red... 95 Figure 51 April 12 - East face loading, Event 0412A... 100 Figure 52 April 12 - South face loading, Event 0412A ... 101 Figure 53 April 12 - East face loading, Event 0412B... 102 Figure 54 April 12 - East face loading, Event 0412C... 103 Figure 55 April 12 - South face loading, Event 0412C ... 104 Figure 56 April 12 - East face loading, Event 0412D... 105 Figure 57 April 12 - South face loading, Event 0412D ... 106 Figure 58 April 12 - East face loading, Event 0412E ... 107 Figure 59 April 12 - South face loading, Event 0412E... 108 Figure 60 Description of floe impact Molikpaq on May 12 ... 109 Figure 61 Sketch of the floe edge impact with Molikpaq... 110 Figure 62 May 12 Event 0512A – North face loading... 112 Figure 63 May 12 Event 0512A – North face loading with expanded time scale ... 113 Figure 64 Combined Day File and Fast File Information for May 12th Impact... 115 Figure 65 (a) North-South distortion, corrected for initial extensometer offsets; (b)
corresponding load trace required to stop the floe in 27 minutes... 116 Figure 66 (a) North-South distortion, adjusted such that 12 minute segment with low loading is
removed; (b) corresponding load trace required to stop the floe in 15 minutes. ... 117 Figure 67 May 22 East Face loading, Event 0522A ... 119 Figure 68 May 22 North Face loading, Event 0522A... 120 Figure 69 May 22 East Face loading, Event 0522B ... 121 Figure 70 May 22 North Face loading, Event 0522B... 122 Figure 71 May 22 East Face moving load (time expansion of Event 0522B) ... 123 Figure 72 June 2 - East face load for Event 0602A ... 126 Figure 73 June 2 - East face load for Event 0602B ... 127 Figure 74 June 25 - West Face loading, Event 0625A ... 128 Figure 75 Time series record of North face strains for EVENT File E605120320 ... 130 Figure 76 Expansion of time series of strain for phase lock event around 03:19:12 ... 130 Figure 77 North-south accelerations of an accelerometer in the North face for EVENT File
E605120320 ... 131 Figure 78 North face loads determined using strain gauge and extensometer data ... 132 Figure 79 Ratio of peak load to one-minute average load ... 132
Figure 80 Comparison of May 12 loads and acceleration for phase lock... 133 Figure 81 “Historical Case” peak face loads ... 138 Figure 82 “Historical Case” peak global ice pressures on 58 m face width ... 139 Figure 83 “Historical Case” pressures based on MEDOF panel loads, categorized by failure
mode ... 140 Figure 84 “Historical Case” pressures based on extensometer results, categorized by failure
mode ... 140 Figure 85 “Historical Case” pressures based on strain gauge results, categorized by failure mode.. 141 Figure 86 “Best Estimate” peak face loads... 142 Figure 87 “Best Estimate” peak global face pressures on 58 m width ... 143 Figure 88 Comparison of “Historical Case” global pressures with global pressure curve from
ISO/DIS 19906 for a structure of the same face width as the Molikpaq, 58 m... 145 Figure 89 Comparison of “Best Estimate” global face pressures with global pressure curve from
ISO/DIS 19906 for a structure of face width 58 m ... 146
LIST OF TABLES
Table 1 Contact factors for MEDOF panel groups (Rogers, Spencer and Hardy, 1991) ... 17 Table 2 Strain gauge calibration factors determined for this project (kN/µstrain for width of
2.44 m) ... 24 Table 3 Extensometer calibration factors for face loads (MN/mm) ... 26 Table 4 Upperbound loads based on less extreme deflection scenarios. ... 28 Table 5 Predicted ice loads based on extensometer readings. ... 29 Table 6 Events selected for analysis of column load distributions; h1 and h2 are lower and
upper estimates, respectively, for ice thickness... 34 Table 7 Events considered for calibrations ... 43 Table 8 Sub-events Events Considered for Calibrations ... 44 Table 9 Variation in Nominal Panel Load with Location on Face ... 46 Table 10 Coefficients for bi-functional correlation models ... 48 Table 11 Linear and pressure averaging loads ... 51 Table 12 Extensometer calibration results based on nominal MEDOF loads. ... 52 Table 13 Amount of multi-year ice drift directly impinging on the Molikpaq ... 62 Table 14 Summary of ice loading on November 10, 1985... 73 Table 15 Summary of ice loading on November 19, 1985... 74 Table 16 Summary of ice loading on November 27, 1985... 74 Table 17 Summary of ice loading on December 16, 1985 ... 75 Table 18 Summary of ice loading on March 7, 1986 ... 77 Table 19 Description of events and sub-events for March 7 ... 78 Table 20 Summary of ice loading on March 8, 1986 ... 83 Table 21 Description of events for March 8... 84 Table 22 Summary of ice loading on March 22-24, 1986... 87 Table 23 Summary of ice loading on March 25, 1986 ... 89 Table 24 Description of events for March 25... 89 Table 25 Summary of ice loading on March 27, 1986 ... 92 Table 26 Summary of ice loading on April 6-7, 1986... 93 Table 27 Summary of ice loading on April 11-12, 1986... 95 Table 28 Description of events and sub-events for April 12 ... 99 Table 29 Summary of ice loading on May 12, 1986 ... 111 Table 30 Description of event and sub-events for May 12... 112
Table 31 Summary of ice loading on May 22, 1986 ... 118 Table 32 Description of events and sub-events for May 22 ... 118 Table 33 Summary of ice loading on June 2, 1986 ... 124 Table 34 Description of events and sub-events for June 2 ... 125 Table 35 Summary of ice loading on June 25, 1986 ... 127 Table 36 Description of event for June 25 ... 128 Table 37 EVENT files showing evidence of phase lock ... 134 Table 38 FAST files and time intervals with accelerations greater than 0.5%g... 135 Table 39 Peak loads coinciding with phase lock... 136
FINAL REPORT
1. INTRODUCTION
The presence of ice in the Arctic regions of Canada, USA, Greenland, Svalbard and Russia presents a unique set of obstacles to the safe and economic production of offshore oil and gas. Ice interaction with structures raises design, operational and regulatory issues, and if not understood properly, can lead to exceedingly expensive design and operational costs for offshore production. Global ice loads are needed for overall stability considerations of gravity based structures, caisson structures and floating production systems. Research on ice loads over the past several years has lead to significant understanding of these loads especially for level ice conditions. Recently, Timco and Croasdale (2006) invited twenty international ice mechanics specialists to predict loads for different full-scale scenarios. The results show general agreement in predicted loads generated by level first-year ice on a vertical-sided structure. However, predictions of loads for multi-year ice ranged over a factor of seven. Clearly this large uncertainty would lead to conservative assumptions regarding ice loads and significantly higher construction and operational costs in regions where year is present. A better understanding of multi-year ice loads, and the factors that affect ice loads is the key to reducing this uncertainty.
The Molikpaq, which was designed and built in the early 1980s as an exploration structure, was extensively instrumented to measure its response to ice loading. This, combined with a program to obtain detailed ice information provided a unique data set for the study of ice loading. The data from measurements at Amauligak I-65 (70° 04’ 40” N – 133° 48’ 16” W ) in 1985-86 were used in a Joint Industry Project conducted by Gulf Canada Resources Ltd. to analyse ice loads, and were reported in a series of confidential reports produced over the period 1987-81. ConocoPhillips Canada, now the owner of the still proprietary Molikpaq data, made the data available for this project, which focused on multi-year ice loading on the Molikpaq at Amauligak I-65. A study of the April 12, 1986 loading event on the Molikpaq (Frederking and Sudom, 2006) in which face loads and global loads were determined is a model of the detailed load analysis carried out in this project.
Previous analysis of ice loading on the Molikpaq has always started with the MEDOF panels, since they directly measured ice forces on the outer faces of the caisson. MEDOF-based ice loads were subsequently used to calibrate strain response of bulkheads and deformation of the caisson ring to ice loading. This JIP has established that geotechnical limitations on sand core behaviour and softening of the panels under normal service loading bring into question using the original MEDOF calibration values to determine ice loads. Nevertheless, MEDOF panel results provide a basis for establishing relative values for calibrating the strain gauges and extensometers. In analysing and presenting results in this report we will present two cases, one a “Historical Case” based on the original MEDOF calibration and relative values from strain gauge and extensometer measurements, and the other, a “Best Estimate” case, in which all results are adjusted to our best estimate of the load-caisson deformation relation from extensometer measurements.
1.1 Project task descriptions
The work for this project was divided into a number of tasks. The following six tasks comprised the initial scope of work for the JIP:
Task 1 – Selecting Appropriate Data: Hourly Ice Observer records, video logs, and daily event reports were reviewed to identify periods when multi-year ice was present, its concentration and floe size, its drift direction and drift rate, and whether it was interacting with the structure. From these records, periods of
multi-year ice loading were identified. Corresponding ice conditions were documented. Ice thicknesses were usually estimated visually or from video records, so a measure of their uncertainty is given.
Task 2 – Review of Instrumentation: All documentation on manufacture, selection and calibration of instrumentation was reviewed. Particular attention was paid to the MEDOF panels, the primary means of direct measurement of ice loads. Calibration of Molikpaq MEDOF panels and other MEDOF panels were checked for consistency and stability. Calibration of strain gauges and extensometers with respect to the MEDOF panels were established to allow relative determination of ice loads from them. Independent means of calibrating strain gauges and extensometers to produce ice loads were sought.
Task 3 – Detailed Analysis: Time series records from the MEDOF panels, strain gauges and extensometers were examined during the time periods of multi-year ice interaction with the structure. From these records, face loads were determined. Loads from MEDOF panel, strain gauge and extensometer results are calculated and presented separately. This has been done on an “Event” or “Sub-event” basis. Each Event, includes a time series record of load related to periods when the size, thickness and shape of multi-year ice features are relatively uniform or defined. An Event or Sub-event can be anywhere from a few 10s of seconds to 10s of minutes. Failure mode during the event was also described. MEDOF panels were on the north, northeast and east sides of the Molikpaq, so they were only used for loading from those directions. Loading from the south and west, where there were no MEDOF panels, were determined using strain gauge and extensometer data. Depending on the instrument, maximum face load or load on part of a face was combined with ice thickness to determine a maximum global pressure for each Event or Sub-event.
Task 4 – Video Analysis: Selected video records were reviewed with the assistance of Brian Wright, together with time series records of MEDOF panel group loads to identify ice failure modes and help divide Events into Sub-events of relatively consistent failure mode and/or ice thickness. Annotated descriptions of failure mode were prepared.
Task 5 – Probabilistic Averaging: The probabilistic averaging technique was applied by Ian Jordaan and colleagues to analyse the MEDOF panel results and calculate global loads. This involved examining the correlation structure of loads for each Event or Sub-event, which differs depending upon failure mode. The events and Sub-events were analysed for relevant statistics, and used as inputs into analyses of probabilistic averaging. Face loads predicted using probabilistic averaging were compared with loads determined from linear averaging.
Task 6 – Geotechnical Analysis: Kevin Hewitt analysed results from the geotechnical instrumentation and the properties of the sand core to estimate limits on ice loading. An assessment of uncertainty in estimating the ice load was made.
With additional Participants joining the JIP, Tasks 2 and 3 were enhanced by expanded MEDOF panel performance assessment and use of DAY files to verify “zero” values. The following three tasks were added:
Task 7 – Third Party Geotechnical Analysis and Review: ConocoPhillips Canada contracted Mike Jefferies to do a review of the original Amauligak geotechnical testing and analysis, and apply recent analysis methods which have become available, to address the issue of the state of the sand core. A presentation of the material was made to Participants. (ConocoPhillips Canada has made separate arrangements concerning access to this report by Participants) Professor K. T. Law of Carleton University was sub-contracted by CHC to make an assessment of the state of the sand core based on available information.
Task 8 – Identification of Phase Lock: Time periods when phase lock occurred were identified, ice thickness and drift speed associated with it noted, and increase in load quantified. In the summary of results, maximum global peak pressures that were associated with phase lock will be identified.
Task 9 – Local Ice Pressure Comparison: STRICE and Molikpaq local pressures were compared to help quantify the degree of MEDOF panel softening. Data from first-year ice loading on the Molikpaq with ice thicknesses similar to those of the STRICE project were used in the comparison.
1.2 Overview of previous work on Molikpaq ice loads
In the period 1986 to 1991 Gulf Canada Resources Ltd. conducted a Joint Industry Project to analyse ice loading on the Molikpaq. The project was carried out in three phases, Phase 1A, Phase 1B, and Phase 2 and documented in the following three sets of reports:
Dynamic Horizontal Ice Loading on and Offshore Structure Phase 1A: Molikpaq Performance at Amauligak I-65
Frontier Development Division, Gulf Canada Resources Ltd., mid-July 1987
The report comprised 10 volumes covering as-deployed conditions, instrumentation and data acquisition, validation of ice force measurements, first-year ice event data, on-ice investigations, multi-year ice event data, geotechnical data, environmental monitoring, operational records, and a supplementary volume with reports from sub-contractors on MEDOF calibrations, FE analysis of strain gauge response, review of ice load measurement techniques, and re-analysis of ice loads.
Ice Loading on an Offshore Structure Phase 1B: Dynamic Ice/Structure Interaction
Gulf Canada Resources Ltd., Summary Report; M.G. Jefferies and P.A Spencer, September 1989
The focus in this phase was characterization of ice/structure response data and the development of mathematical models to predict the nature of the interaction. The report comprised 2 volumes of the main report, followed by 8 volumes of appendices which addressed calibration issues, finite element modelling of the structure for dynamics, experiments on and discrete element modelling of crushed ice, and a dynamics model. The work in the appendices was done by Gulf personnel and contractors
Dynamic Ice/Structure Interaction with the Molikpaq at Amauligak I-65
Phase 2: Vol. 1: Main Report, Characterization of Sand Core Behaviour on April 12, 1986 and Development of Analysis Methodology, April 1991
Gulf Canada Resources Ltd., B.T. Rogers and C.A. Graham Golder Associates, K. Been
Klohn Leonoff, M.G. Jefferies
This report characterized the core and berm sand properties and led to the development of a methodology to accurately describe the ice/structure/soil interaction occurring with Arctic gravity platforms.
Vol. 2: Ice Load Measurement on the Molikpaq at Amauligak I-65, April 1991 Gulf Canada Resources Ltd., B.T. Rogers, P.A. Spencer and M.D. Hardy
This report reviews the three methods (MEDOF panels, strain gauges and extensometers) used to measure ice loads, analysis techniques and presents some test cases of load calculation.
In addition to the first two volumes of the main report, there were seven more volumes of contracted out work covering geotechnical analysis, centrifuge testing, laboratory testing, and geotechnical assessment. In the late 1980s a number of papers on the sand core properties and response of the core were published by the geotechnical community. The first of these (Sladen, 1989, Sladen and Hewitt, 1989) focused on problems in interpreting sand core properties from field tests, and the influence of placement method on in situ density of hydraulically placed sand. They pointed out that hydraulic placement of sand by
pipeline results in low relative density and loose state of the sand core. The first paper to present ice load results was Jefferies and Wright (1988). It mainly focused on ice loading dynamics, but presented maximum global loads of 230 MN, 320 MN, >500 MN and 250 MN for the March 7, March 8, April 12 and May 12 events, respectively. Brown et al (1992) presented a paper on dynamic ice interactions with the Molikpaq. It developed a finite element model of the structure and verified it against measured deformation of the caisson. For May 12 the model predicted an ice load of 160 MN which was amplified to 200 MN on the foundation. Hewitt (1994) published a conference paper stating the sand core was loose because it was placed by a hydraulic fill method and that “the ultimate resistance of the structure under dynamic loading was only 200 MN.”
With funding support from the Canadian Government Program on Energy Research and Development, in 1995-96 Klohn-Crippen was contracted to archive Molikpaq data. This was done through preparation of a report and a CD with data from selected events from the deployment at Amauligak I-65. The report, DynaMAC: Molikpaq Ice Loading Experience (Klohn-Crippen, 1998) is publicly available and can be down loaded from the CHC website (http://www.nrc-cnrc.gc.ca/eng/ibp/chc/reports/beaufort.html). The distribution of the data CD is restricted. Table 5.4 and Figure 5.10 of the report provide maximum ice load estimates for the four main loading events at Amauligak I-65. The load values are face loads, but adjusting for structure width, are the same as those of Jefferies and Wright (1988). A compilation of time series records of Molikpaq loads derived from the DynaMAC CD was a component of the NRC Ice Load Catalogue (Timco et al, 1999), but remains a controlled distribution report. The original data tapes, from which the CD was prepared, were subsequently transferred to NRC-CHC for custodianship. The data tapes have been converted to ASCII format by CHC to facilitate analysis and long-term data preservation. Because of the availability of the DynaMAC data, several journal and conference papers were published on results of analysed Molikpaq data. Note that the loads in the DynaMAC report and the following papers all are based on assuming the original MEDOF calibration factors are correct. Wright and Timco (2001) examined first-year ridge interaction with the Molikpaq and characterized failure modes from examining video records and found typical load levels ranged from 30 to 100 MN for first-year ridges with sail heights up to 2.5 m. Timco and Johnston (2003) presented detailed information on 188 ice loading events on the Molikpaq from both first-year and multi-year ice for different ice conditions including level ice, ridges, hummock ice and isolated floes. A consistent trend of increasing line load with ice thickness up to 7.8 MN/m for 7 m thick ice was presented in 8 summarizing figures. Timco and Johnston (2004) combined Molikpaq data with ice load results from four other offshore structures in the Beaufort Sea, showing consistent results of load as a function of ice thickness. Maximum global pressure was 1.9 MPa for 0.7 m thick ice and decreased to 1.1 MPa for 7 m thick ice. Timco et al (2005) looked at the May 12 impact event and presented a detailed description of the event, confirming the original estimate of a maximum impact force of 250 MN. Frederking and Sudom (2006) studied the April 12, 1986 event and determined a maximum global load of no more than 420 MN and most likely 380 MN. This was based on a re-analysis of extensometer and strain gauge data. Global ice pressures for the 8 to 12 m thick multi-year hummock crushing on the 58 m long east face was estimated to be not greater than 0.8 MPa. Jefferies et al (2008) returned to his earlier work on dynamic amplification of ice loads on the Molikpaq and determined a maximum east face load approaching 400 MN for a phase-locked event. The loads from all previous analysis are generally consistent, since they all start from the same point of using the original calibration of the MEDOF panels.