READ THESE TERMS AND CONDITIONS CAREFULLY BEFORE USING THIS WEBSITE. https://nrc-publications.canada.ca/eng/copyright
Vous avez des questions? Nous pouvons vous aider. Pour communiquer directement avec un auteur, consultez la première page de la revue dans laquelle son article a été publié afin de trouver ses coordonnées. Si vous n’arrivez pas à les repérer, communiquez avec nous à PublicationsArchive-ArchivesPublications@nrc-cnrc.gc.ca.
Questions? Contact the NRC Publications Archive team at
PublicationsArchive-ArchivesPublications@nrc-cnrc.gc.ca. If you wish to email the authors directly, please see the first page of the publication for their contact information.
NRC Publications Archive
Archives des publications du CNRC
This publication could be one of several versions: author’s original, accepted manuscript or the publisher’s version. / La version de cette publication peut être l’une des suivantes : la version prépublication de l’auteur, la version acceptée du manuscrit ou la version de l’éditeur.
Access and use of this website and the material on it are subject to the Terms and Conditions set forth at
The Effect of mechanical ventilation on RN, NO2 and CH2O
concentrations in low-leakage houses and a simple remedial measure
for reducing RN concentration
Dumont, R. S.
https://publications-cnrc.canada.ca/fra/droits
L’accès à ce site Web et l’utilisation de son contenu sont assujettis aux conditions présentées dans le site LISEZ CES CONDITIONS ATTENTIVEMENT AVANT D’UTILISER CE SITE WEB.
NRC Publications Record / Notice d'Archives des publications de CNRC: https://nrc-publications.canada.ca/eng/view/object/?id=f6b071be-fdf7-4010-ac59-db7d207d17af https://publications-cnrc.canada.ca/fra/voir/objet/?id=f6b071be-fdf7-4010-ac59-db7d207d17af
-
Ser T H l
N21d i National Research Conseil national
1383
1
+
Coundl Canada de recherche= Canada c. 2BLDO
Institute for lnstitut de-- --- Research in recherche en
Construction construction
The Effect of Mechanical Ventilation on
Rn,
NO2 and
CH20 Concentrations in
Low-Leakage Houses and a Simple
Remedial Measure for Reducing Rn
Concentration
by R.S. Dumont
Reprinted from
Transactions, Indoor Air Quality in Cold Climates: Hazards and Abatement Measures
APCA Specialty Conference Ottawa, Ontario, April 1985 p. 90-104
(IRC Paper No. 1383)
Price $3.00 NRCC 25994
Ce document prdsente les rCsultats d'une dvaluation de la qualit6 de l'air dans un groupe de maisons relativement dtanches situees 3 Saskatoon, en Saskatchewan. On y a mesurd les niveaux de formaldshyde, de dioxyde d'azote, de radon et d'humidit6.
Le niveau m6dian de formaldehyde dtait de 0.09 ppm, soit un peu moins que la norme, qui est de 0,l ppm. Des concentrations dlev6es de formald6hyde (>0,1 ppm) ont 6t6 relevees dans 18 des 46 maisons. Le niveau median de radon dtait de 3 picocuries/litre, soit l6gSrement moing que la norme, fixge B 4 pCi/L. Des concentrations dlevdes de radon (>4 pCi/L) ont 6tk relevees dans 12 maisons su j 44. Le niveau median de dioxyde d'azote 6tait d z 4,6 ppm , soit beaucoup moins que la norme, qui est de 50 ppm
.
Dans ascune maison n'a-t-on releved
de concentrations dlevies de dioxyde d'azote (50 ppm ). Les maisons sans ventilation mecanique presentaient beaucoup plus souvent que les autres des concentrations 6lev6es de formald6hyde.
THE EFFECT OF MECHANICAL VENTILATION ON Rn, NO2 AND CH20 CONCENTRATIONS IN LOW-LEAKAGE HOUSES AND A SIMPLE REMEDIAL MEASURE FOR REDUCING Rn
CONCENTRATION
R.S. Dumont,
Prairie Regional Station, Division of Building Research, National Research Council Canada, Saskatoon, Saskatchewan
Results of air quality measurements are presented for a group of low-leakage houses located in Saskatoon, Saskatchewan. Houses were tested for
formaldehyde, nitrogen dioxide, radon, and humidity levels.
The median level of formaldehyde was 0.09 ppm, slightly lower than the
guideline of 0.1 ppm. Elevated levels of formaldehyde (20.1 ppm) were found in 18 of 46 houses. The median level of radon was 3.0 picocuries/litre, slightly lower than the guideline of 4 pCi/L. Elevated levels of radon
( 2 4 pCi/L) were found in 12 out of 44 houses. The median level of nitrogen dioxide was 4.6 ppb, considerably lower than the guideline of 50 ppb. No houses were found with elevated nitrogen dioxide levels 0 5 0 ppb). Those houses lacking a mechanical ventilation system had considerably higher incidences of elevated formaldehyde concentrations than those incorporating mechanical ventilation.
Reprinted from the transactions Indoor Air Quality in Cold Climates: Hazards and Abatement Measures, published in 1986 by the Air Pollution Control
THE EFFECT OF MECHANICAL VENTILATION ON Rn, NOg AND CH20 CONCENTRATIONS IN LOW-LEAKAGE HOUSES AND A SIMPLE REMEDIAL MEASURE FOR REDUCING Rn
CONCENTRATION
Introduction
In recent years, a large number of houses have been constructed in the Canadian prairie region that have been sealed to a considerably higher
degree than conventional housing. A 1981 report by Dumont and Orrl includes pressure test values for a group of 40 houses that were specially sealed. On average, these houses had equivalent leakage area values that were 53% of those in conventional houses. (See Table I).
As part of an ongoing research project, testing was done on the levels of selected pollutants in a group of these low-leakage houses. None of these were insulated with urea formaldehyde foam insulation (UFFI).
A number of guidelines exist for air pollutant levels. A frequently quoted standard is the document "Ventilation for Acceptable Air Quality" produced by the American Society of Heating, Refrigerating, and Air
Conditioning Engineers (ASHRAE). Values for f ormaldehye
,
radon daughters, and nitrogen dioxide are presented in Table 11.In 1982 a preliminary air quality survey of 51 houses in the Saskatoon area was undertaken to determine levels of formaldehyde and radon daughters. The survey included houses of varying ages and airtightness levels.
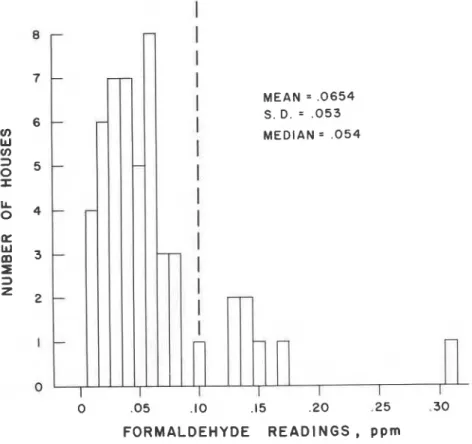
As shown in Figure 1, a number of the houses exhibited higher levels of formaldehyde gas. Using the ASHRAE criterion of 0.1 ppm, 8 of the 51
Saskatoon houses had elevated formaldehyde gas levels. Of particular interest in this initial survey was the relationship between formaldehyde levels and the airtightness of the structure. Figure 2 presents the
relationship between formaldehyde levels and the pressure test reading for each house. It shows that those houses with higher formaldehyde readings were generally among the more airtight of the sample. (It should be noted that the airtightness of the structure is not a direct measure of the air change rate, as many of the more airtight houses have controlled ventilation systems. These systems can substantially increase the amount of ventilation compared to natural ventilation from stack and wind effects.)
In the 1982 survey, radon daughter levels were also measured using the Terradex Track-Etch Detector. The results are presented in Figure 3. Using the ASHRAE level of 0.01 working levels as a cut off, 17 of 43 houses* had elevated radon daughter levels. A plot of the radon daughter levels as a function of the pressure test readings for the houses is presented in Figure 4.
1983 Study of Saskatoon Houses
As a follow-up to the 1982 study, a survey of formaldehyde, nitrogen dioxide and radon gas levels was conducted in 1983 in a sample of 46 houses in Saskatoon. The houses had all been built since 1978, and were chosen because they had a pressure test reading of less than 2.5 air changes per
--
*Due to equipment failure, not all of the tests were successfully completed. In this case, although 46 tests were conducted, only 43 were successful. '
hour (ac/h) at 50 Pa. The average pressure test reading for the 46 houses was 1.33 ac/h at 50 Pa. This is considerably tighter than the value of
3.6 ac/h at 50 Pa which was reported1 as an average for conventional houses built during the period 1960-1980 in Saskatoon. The houses were of
wood-frame construction and the majority had concrete cast-in-place basements.
For steady state conditions, the concentration of a pollutant within a well-mixed space may be expressed as:
where Cs = concentration of pollutant within the space (mass/volume)
Co = concentration of pollutant at the source of the ventilation air, i.e., outside air (mass/volume)
N = net pollutant generation rate within the space (massltime)
V = volume rate of air exchange (volume/time).
A high concentration of pollutant within the space may occur under any or all of three conditions:
high outdoor concentration (Co)
B high pollution generation rate (N)
.
B low ventilation rate (V).Test Procedure for Air Quality Measurements in the 1983 Study Formaldehyde
Formaldehyde tests were made in the houses using Dupont Pro-tek passive badges. Two badges, each of which was exposed for a one-week period, were placed in the living areas (generally the dining or living rooms) of each house. The badges were analyzed in a laboratory in Toronto. The
measurements were taken from January 3 to January 21, 1983. During this time, the average outdoor temperature was -ll°C, and the average wind speed was 13 km/h. A table presenting the test results in detail is contained in an earlier paper by Dumont.
Radon Gas Tests
Radon gas level tests in the houses were made using Terradex Track-Etch passive detectors. The particular detector chosen has a filter which
minimizes the contact of dust particles with the detector; hence only the radon gas and not the radon daughter concentration is measured.
Measurements were made from January to April 1983.
Appendix A presents a discussion on the consistency of the formaldehyde and radon sensor readings.
Nitrogen Dioxide Tests
Nitrogen dioxide tests, one per house, were made during a week in early January using a passive detector. The test badges were processed by Health and Welfare Canada. In addition to these three tests, data were gathered for each house, as follows:
1. Pressure test result at a pressure difference of 50 Pa 2. Type of heating system
3. Type of ventilation system used a. None
b. Fresh air duct into plenum c. Air-to-air heat exchanger 4. Type of air-to-air heat exchanger
5. Number of occupants during day and night periods
6. Inside temperature and relative humidity during formaldehyde tests
7. Area of particle board
8. Number of wood heating appliances (wood stoves or fireplaces) 9. Number of cigarette or cigar smokers.
Test Results
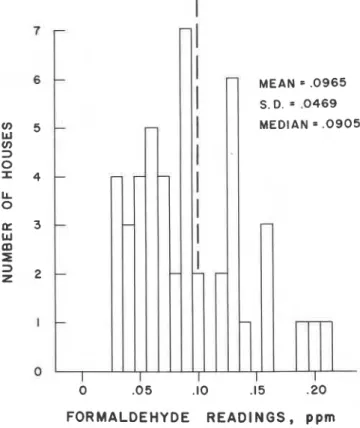
The formaldehyde levels for each house are presented in Figure 5. The values shown are the average of the two readings taker,. The median value for the 46 house sample was 0.09 ppm, with 18 houses having values greater than 0.1 ppm. A plot of formaldehyde levels as a function of indoor
relative humidity is shown in Figure 6. A plot of the formaldehyde levels as a function of the amount of particle board in each house is shown in Figure 7.
The results of the radon gas tests are shown in Figure 8. Of the 44 houses successfully tested, 12 houses had radon gas levels that exceeded 4 picocuries per litre, which is the USEPA remedial criterion. The median value for these 44 houses was 3.0 picocuries per litre.
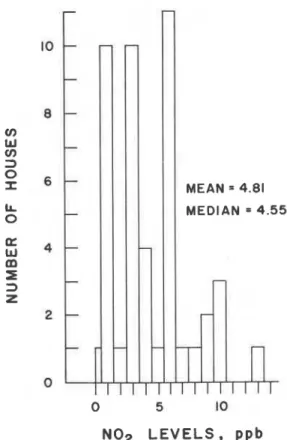
The results of the nitrogen dioxide tests are shown in Figure 9. The median level for the 46 houses was 4.6 ppb. The houses were divided into four categories, depending on the presence or absence of wood appliances and smokers. The results were as follows:
Category N02 Number
(PP~) of Houses
No wood appliances, no smokers 3.5 12 No wood appliances, smokers 5.3 4 Wood appliances, no smokers 5.1 2 1 Wood appliances, smokers 5.6 9
Discussion
Formaldehyde
The median formaldehyde level was 0.09 ppm, with values ranging between 0.033 and 0.24 ppm. The houses with higher formaldehyde readings tended to have higher relative humidities. Of the 8 houses with relative humidity (RH) values less than 30%, none had formaldehyde readings greater than 0.1 ppm. Of the 6 houses with RH values greater than 40%, 2 had formaldehyde readings greater than 0.1 ppm. A plot of the relationship between formaldehyde and interior relative humidity is shown in Figure 6. Assuming constant moisture generation rates in the various houses (on an equivalent volume basis), low relative humidity values are a result of higher air change rates. Thus the relationship between formaldehyde and
relative humidity is not unexpected. There is a secondary effect, since the formaldehyde offgassing rate is known to increase with higher
humidities.
Higher formaldehyde readings were also associated with the houses that did not have a mechanical ventilation system. Fifty percent of the houses with no mechanical ventilation system showed formaldehyde levels greater
than 0.1 ppm. Only 27% of those that had mechanical ventilation showed levels greater than 0.1 ppm.
As part of the survey, measurements were made of the area of particle board contained within each house. The range of particle board areas varied from 0 to 311 m2. In addition, there were other formaldehyde-emitting
sources within the houses (some carpets, permanent press fabrics, hardwood
plywoods) that were not quantified. As shown in Figure 7, there was weak
positive correlation (correlation coefficient = 0.36) between the
formaldehyde level and the amount of particle board in the houses.
Observations or measurements were not made on other factors, such as the age and brand of the particle board, the type of covering on the particle board, tobacco smoke and other sources of formaldehyde.
A house can have a low formaldehyde reading by having either a low
volume of formaldehyde-emitting sources or a high air change rate. Due to unavailability of equipment, air change measurements were not made during the period the formaldehyde readings were taken. It is possible to estimate the air change rate of those houses that did not have forced ventilation systems by using the pressure test data. shaw4 presented a correlation between the air change rate and the pressure test data, wind speed and outside air temperature. The correlation equation when the wind speed is
greater than 3.5 m/s and the temperature difference is greater than 25 K, is
as follows:
where I = air change rate (h'l)
C = constant from pressure test (L/ (s-pan))
V = volume of house (m3).
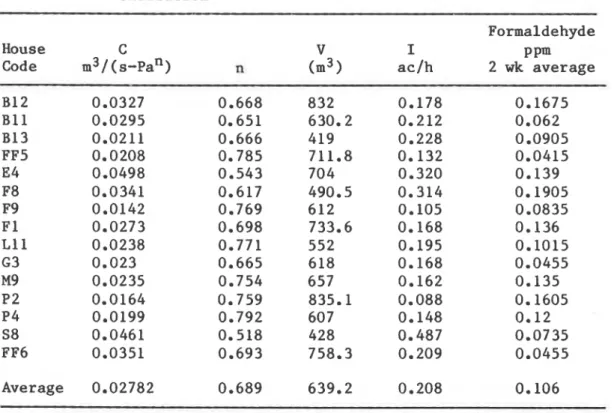
Values for C, V, and I for the houses in the survey lacking forced
ventilation systems are presented in Table 111. As may be seen from the
table, the calculated average infiltration rate for these houses was 0.21 air changeslh, and the corresponding average formaldehyde level was 0.106 ppm.
Radon
The median radon level-for the houses was 3.0 picocuries per litre, with the values ranging between 0.82 and 9.44 pCi/L. The readings were all taken in the lowest levels of the houses, which were generally not
occupied.
A number of houses in the study (12 out of 43) had radon gas
concentrations exceeding 4 picocuries per litre. A possible source of the
radon was the soil underlying the concrete floor. Work was carried out to determine the radon concentration in the floor drains, which are connected directly to the weeping tile in these houses. In addition, the effect of blocking the floor drain to limit radon gas entry into the basement was investigated.
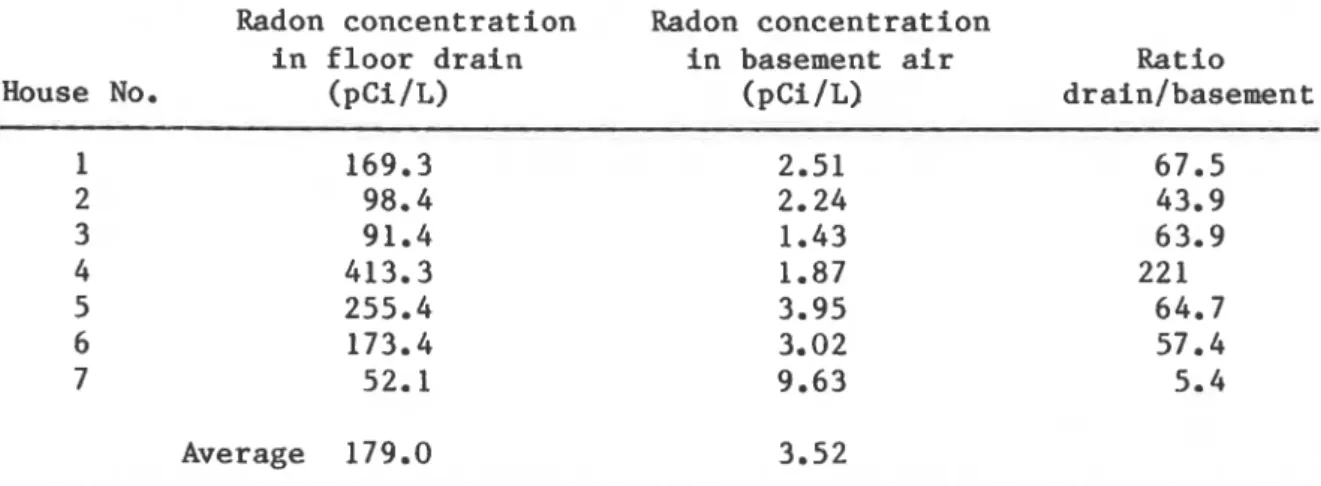
The results of measurements of the radon concentration in the floor
drain and in the basement air are presented in Table IV for a group of 7
houses. The radon gas measurements were taken using the Terradex Track-Etch detectors.
As may be seen from the table, the radon concentrations in the floor drains were very high, ranging from 52.1 to 413.3 pCi/L, with an average of
179 pCi/L. In each of the houses tested, the weeping tile was connected directly to the floor drain. Consequently the radon can migrate freely from the soil through the weeping tile and into it. If the floor drain is capped to prevent air flow from the floor drain into the basement, a substantial reduction in radon concentrations in the basement air would be expected. To determine if this reduction would in fact occur, tests were performed on 10 houses. The results of this remedial measure are presented in Table V.
As may be seen from Table V, in 8 of the 10 houses, the radon
concentrations dropped. There was on average a reduction of 46% in the radon concentrations in the basement air after the floor drains had been sealed.
One major difference between the two sets of measurements was that the 1983 measurements were taken in the period from January to April, and the 1984 measurements were taken in the period from June to August. As the houses all had controlled ventilation systems which were intermittently operated, it is difficult to make firm conclusions as to whether the air change rates in the houses had increased or decreased from the first period to the second. In ,houses lacking forced ventilation systems, the air change rate in the summer is usually smaller, assuming that the windows are closed. This reduced air change occurs because the stack effect due to temperature difference between inside and outside is lower.
A followup study would be of interest to confirm that the perforated floor drain cap is a major radon entry path in those basements with the weeping tile connected directly to the floor drain.
Nitrogen Dioxide
The median value for the NO2 readings was 4.6 ppb, with values ranging
between 0.7 and 13.3 ppb, well below the ASHRAE guideline of 50 ppb. Three
of the four houses with readings above lOppb had either wood stoves or fireplaces. The fourth house, with a reading above 10 ppb, had 2 smokers with cigarette consumption levels of 1 pack (20 cigarettes) each per day. The houses with no wood appliances and no smokers averaged 3.5 ppb, and those with both wood appliances and smokers averaged 5.6 ppb.
Ventilation Systems
In this study three types of ventilation systems were used in the
houses :
X No. of houses
a. no mechanical ventilation 10.9 5
b. fresh air duct into return air 23.9 11
plenum of forced air furnace
As mentioned earlier in the paper, those houses lacking an air-to-air heat exchanger system had a considerably higher incidence of elevated formaldehyde readings than those houses with an air-to-air heat exchanger. Based on these data, it would appear that continuous mechanical ventilation would help to reduce air pollution levels.
Recommendations
The results of this study indicate a number of areas for further work:
1. Future studies of this type should include direct measurements of the air change rates in the houses using tracer gas or other appropriate means.
2. Remedial work on those houses exhibiting levels of pollutants higher than the standards should be undertaken.
3. Investigations should be undertaken to determine the source of the radon gas. An area that is likely to be a strong source is the floor drain, through which radon can leak into the house from the soil via the weeping tile system, particularly when it is connected to the drain above the trap.
4. Further work should be done on identifying formaldehyde sources in houses and in determining their strength.
Appendix A Consistency of the Radon and Formaldehyde Sensors
During the air quality measurements, a number of cross-checks were made with the radon and formaldehyde sensors, primarily to ensure that the
companies supplying the sensors and doing the analyses were providing consistent readings.
Radon
During the course of the experiment, groups of 5 sensors were placed side-by-side in two locations. The first location for the side-by-side check was in a crawl space area that was known to have elevated radon levels. The results for the five sensors, all of which were placed side by side, were as follows, when read at the 1.0 pCi/L-month sensitivity level.
Sensor No. Radon reading (pCi/L)
D9 1 5.48 D92 5.73 D9 3 6.43 D94 4.90 D9 5 5.40
-
average = 5.59 standard deviation = 0.56A second check, again using 5 sensors placed side by side, was
performed in a well-ventilated laboratory. The results for this comparison are shown below:
Sensor No. Radon r e a d i n g (pCi/L) D9 6 0.27 D9 7 0.14 D98 0.22 D9 9 0.12 Dl00 0.17
-
a v e r a g e = 0.18 s t a n d a r d d e v i a t i o n = 0.06 FormaldehydeA side-by-side check was performed on t h e DuPont s e n s o r s . A t o t a l of 4 s e n s o r s were p l a c e d s i d e by s i d e i n one house f o r a one week p e r i o d . The r e a d i n g s were a s f o l l o w s :
Sensor No. Formaldehyde l e v e l (ppm)
a v e r a g e = 0.078 s t a n d a r d d e v i a t i o n = 0.007
R e f e r e n c e s
1. Dumont, R.S. and Orr, H.W., " A i r t i g h t n e s s Measurements of Detached Houses i n t h e Saskatoon Area," N a t i o n a l Research Council Canada, D i v i s i o n of B u i l d i n g Research, B u i l d i n g Research Note 178, Ottawa,
1981.
2. ASHRAE, " V e n t i l a t i o n f o r Acceptable Indoor Air Q u a l i t y " S t a n d a r d 62-1981, 1791 T u l l i e C i r c l e N.E., A t l a n t a , Georgia, 30329, U.S.A., 1981.
3. Dumont, R.S., "Air Q u a l i t y Measurements i n Low-Leakage Houses," N a t i o n a l Research Council Canada, D i v i s i o n of B u i l d i n g Research, B u i l d i n g
Research Note 218, O t t a w a , 1984.
4. Shaw, C.Y., "A C o r r e l a t i o n between Air I n f i l t r a t i o n and Air T i g h t n e s s f o r Houses i n a Developed R e s i d e n t i a l Area," ASHRAE T r a n s a c t i o n s , Vol. 87, P t . 2, 1981.
Table I. Comparison of air leakage characteristics for groups of Saskatoon houses
Leakage
area ac/h Number
Type m2 at 50 Pa of houses Pre-1945 0.1078 10.35 19 1946-1960 0.0709 4.55 20 196 1-1980 0.0621 3.57 9 7 Special air- tight houses (1977-1980) 0.0330 1.49 40
Table 11. Guidelines for generally acceptable levels of
selected air contaminants
Contaminant Level Reference
Formaldehyde 0.12 mg/m3 ASHRAE 62-1981
0.1 ppm at 25OC, 101.3 kPa
Radon 4 pCi/L USEPA
Radon daughters 0.01 working levels ASHRAE 62-1981
Nitrogen dioxide 100 ug/m3 USEPA
50 ppb at 25OC, 101.3 kPa
Table 111. Calculated air change rates for houses lacking forced
ventilation
Formaldehyde
House C V I PPm
Code m3 / ( ,-pan) n (m3
>
ac/h 2 wk averageB12 B11 B13 FF5 E4 F8 F9 F 1 L11 G3 M9 P 2 P4 S8 FF6 Average
Table IV. Radon gas measurements in the floor drains and in the basement
air of 7 houses
House No.
Radon concentration Radon concentration
in floor drain in basement air Ratio
(pCi/L) (pCi/L) drainlbasemen t
169.3 2.51 67.5 98.4 2.24 43.9 91.4 1.43 63.9 413.3 1.87 22 1 255.4 3.95 64.7 173.4 3.02 57.4 52.1 9.63 5.4 Average 179.0 3.52
Table V. Pre- and post-retrofit measurements of radon gas
concentrations in Saskatoon houses
Pre-retrofit Post-retrofit
1983 1984 Ratio
House code (pCi/L) (pCi/L) 198411983
0 . 0 5 . I 0 .I5 .20 . 2 5 . 3 0 F O R M A L D E H Y D E R E A D I N G S , p p m 8 7 6 5 4 3 2 L O
Figure 1. Formaldehyde readings, 1982 study.
HEATING TYPE A El 8 ELECTRICITY A 0 NATURAL GAS
-
- MEAN = , 0 6 5 4 - S . D. = , 0 5 3 MEDIAN = , 0 5 4 - - AGE OF HOUSE A PRE 1945 1946 - 1960 0 1961 - 1980AIR TIGHTNESS nS0
.
AIR CHANGES / HR. AT 5 0 Pa-
Figure 2. Formaldehyde readings as a function of air tightness, 1982
study.
I 1 I I I I I
MEAN = ,0106 S. D. = . 0 0 8 6 3 MEDIAN = , 0 0 7 8
0 .005 .01 .015 . 0 2 .025 . 0 3 .035 . 0 4 ,045
R A D O N W O R K I N G L E V E L S , WL
Figure 3. Radon readings, 1982 study.
HEATING TYPE A 8 0 ELECTRICITY A 0 NATURAL GAS
I
AGE O F HOUSE A PRE 1945 1946 - 1960 0 1961-
1980AIR TIGHTNESS nsO
.
AIR CHANGES/ HR. AT 5 0 PaMEAN = . 0 9 6 5 S. D. = , 0 4 6 9 MEDIAN = . 0 9 0 5 1 I I 0 . 0 5 . I 0 .I5 .20 FORMALDEHYDE READINGS, ppm
Figure 5. Formaldehyde readings, 1983 study.
RELATIVE H U M I D I T Y , O/o
Figure 6. Formaldehyde readings as a function of indoor relative humidity,
Figure 7. Formaldehyde readings a s , a function of the amount of particle board, 1983 study.
f-
I-
-
M E A N = 3.56 S.D. = 2.14-
MEDIAN = 3 . 0 1-
-
--
-
-
I I 0 2 . 5 5 . 0 7.5 R A D O N , p i c o c u r i e s l i t r e0 5 10
NO2 L E V E L S , ppb
T h i s paper i s being d i s t r i b u t e d i n r e p r i n t form by t h e I n s t i t u t e f o r Research i n C o n s t r u c t i o n . A l i s t of b u i l d i n g p r a c t i c e and r e s e a r c h p u b l i c a t i o n s a v a i l a b l e from t h e I n s t i t u t e may be o b t a i n e d by w r i t i n g t o t h e P u b l i c a t i o n s S e c t i o n , I n s t i t u t e f o r R e s e a r c h i n C o n s t r u c t i o n , N a t i o n a l Research C o u n c i l of C a n a d a , O t t a w a , O n t a r i o , KlA 0R6. Ce document e s t d i s t r i b u 6 s o u s forme de t i & - a - p a r t p a r 1' I n s t i t u t de r e c h e r c h e e n c o n s t r u c t i o n . On p e u t o b t e n i r une l i s t e d e s p u b l i c a t i o n s de 1 ' I n s t i t u t p o r t a n t s u r les t e c h n i q u e s ou les r e c h e r c h e s e n matisre
d e b a t i m e n t e n B c r i v a n t 3 l a S e c t i o n d e s p u b l i c a t i o n s , I n s t i t u t de r e c h e r c h e en c o n s t r u c t i o n , C o n s e i l n a t i o n a l d e r e c h e r c h e s du Canada, Ottawa ( O n t a r i o ) ,