Publisher’s version / Version de l'éditeur:
Vous avez des questions? Nous pouvons vous aider. Pour communiquer directement avec un auteur, consultez la
première page de la revue dans laquelle son article a été publié afin de trouver ses coordonnées. Si vous n’arrivez pas à les repérer, communiquez avec nous à PublicationsArchive-ArchivesPublications@nrc-cnrc.gc.ca.
Questions? Contact the NRC Publications Archive team at
PublicationsArchive-ArchivesPublications@nrc-cnrc.gc.ca. If you wish to email the authors directly, please see the first page of the publication for their contact information.
https://publications-cnrc.canada.ca/fra/droits
L’accès à ce site Web et l’utilisation de son contenu sont assujettis aux conditions présentées dans le site LISEZ CES CONDITIONS ATTENTIVEMENT AVANT D’UTILISER CE SITE WEB.
10DBMC International Conference on Durability of Building Materials and
Components [Proceedings], pp. 1-9, 2005-04-01
READ THESE TERMS AND CONDITIONS CAREFULLY BEFORE USING THIS WEBSITE.
https://nrc-publications.canada.ca/eng/copyright
NRC Publications Archive Record / Notice des Archives des publications du CNRC :
https://nrc-publications.canada.ca/eng/view/object/?id=cdd44da7-4dde-45cc-918f-8e162b332c87 https://publications-cnrc.canada.ca/fra/voir/objet/?id=cdd44da7-4dde-45cc-918f-8e162b332c87
NRC Publications Archive
Archives des publications du CNRC
This publication could be one of several versions: author’s original, accepted manuscript or the publisher’s version. / La version de cette publication peut être l’une des suivantes : la version prépublication de l’auteur, la version acceptée du manuscrit ou la version de l’éditeur.
Access and use of this website and the material on it are subject to the Terms and Conditions set forth at
Water entry at penetrations in a hardboard siding-clad wood stud wall
when subjected to simulated driving rain
http://irc.nrc-cnrc.gc.ca
N a t i o n a l R e s e a r c h C o u n c i l C a n a d a
Wat e r e nt r y at pe ne t rat ions in a
ha rdboa rd siding-cla d w ood st ud
w a ll w he n subje c t e d t o
sim ulat e d driving ra in
N R C C - 4 7 6 8 7
S a h a l , N . ; L a c a s s e , M . A .
A version of this document is published in / Une version de ce
document se trouve dans:
10DBMC International Conference on Durability of Building
Materials and Components, Lyon, France, April 17-20, 2005,
pp. 1-9
10DBMC International Conference On Durability of Building Materials and Components LYON [France] 17-20 April 2005
Water Entry at Penetrations in a Hardboard Siding-Clad Wood
Stud Wall When Subjected to Simulated Driving Rain
N. Sahal
1, M. A. Lacasse
21
Istanbul Technical University
Faculty of Architecture,
Taskisla, 34437 Taksim, Istanbul, Turkey
sahal@itu.edu.tr2
Institute for Research in Construction
National Research Council Canada, Montreal Road, Building
M20
,Ottawa, Ontario K1A 0R6 Canada
TT2-56
ABSTRACT
Driving rain is one of the significant agents of premature deterioration of wall assemblies. Driving rain deposited on the cladding may penetrate through imperfectly designed, defectively installed and inadequately maintained interface details at wall penetrations under the driving force of coincident wind pressure. Some examples of rainwater-induced damage include the decay of wood based materials, corrosion of metals and failure of finishes. Hence, assessing the degree to which driving rain may penetrate wall assemblies permits determining the risk of damage under given climate conditions and this in turn may provide the basis for estimating the useful life of the assemblies. Previous experimental work undertaken at the Institute for Research in Construction on water entry focused on determining the quantity of water entry through deficiencies incorporated in the cladding of 17 different wood stud wall assemblies when exposed to simulated driving rain loads. The assemblies were comprised of four cladding types including stucco, brick veneer, hardboard and vinyl siding, and EIFS. This paper reports on a follow-up experimental work in which only the hardboard siding-clad wood stud wall was subjected to repeated water entry trials and incorporated additional levels of spray rate and pressure difference as compared to the previous work. Trials were also conducted to determine whether cascading or spraying water to simulate deposition of driving rain on the surface of the cladding affected the quantity of water entry into the wall assembly. This wall assembly included a drainage cavity and specific deficiencies such as a missing length of sealant at the interface between the cladding and the penetrating components, i.e. window, ventilation duct and electrical outlet. In a typical test, water was sprayed continuously on the wall specimen while subjecting it to a specified air pressure differential. Water entering the deficiencies was collected at troughs located in the drainage cavity behind the cladding and in the stud cavity directly below the penetrating component over a known period.
Experimental results on water entry of hardboard siding-clad wood stud wall provided information on water entry rates in troughs as functions of simulated driving rain loads. Results indicated that cascading water on the cladding surface resulted in higher rates of water entry into the wall assembly than spraying water on the cladding surface for the same nominal average rate per unit area of deposition. As well, significant quantities of water were collected in the drainage cavity behind the cladding as compared to that collected in the stud cavity over a given period. This further highlights the importance of a drainage cavity to reduce the likelihood of water entry to the stud cavity from the incidental water that enters deficiencies in the cladding.
KEYWORDS
10DBMC International Conference on Durability of Building Materials and Components LYON [France] 17-20 April 2005
TT2-56, Water Entry at Penetrations in a Hardboard Siding-Clad Wood Stud Wall When Subjected to Simulated Driving Rain; N. Sahal and M. A. Lacasse
1 INTRODUCTION
Driving rain is one of the significant agents of premature deterioration of wall assemblies [Carll 2001]. Driving rain deposited on the surface of the cladding may enter through the imperfectly designed, defectively installed and inadequately maintained interface details at through wall penetrations under the driving force of coincident wind pressure. Interface details at wall-window, wall-electrical outlet and wall-ventilation duct are the primary points for rainwater ingress [Morrison Hershfield Limited 1996]. Some examples of rainwater-induced damage include decay of wood-based materials, corrosion of metals, degradation of thermal performance of insulations, and failure of finishes [RDH Building Engineering Limited 2001]. Hence, assessing the degree of water entry into wood stud wall assembly permits determining the risk of damage incurred by moisture sensitive components of the assembly under given climatic conditions and this in return may provide the basis for estimating the useful life of the assembly.
Laboratory testing of full-scale test specimens permits relating the likelihood of driving rain exposure to in-service conditions [Lacasse 2003] and hence provides insightful information on water penetration and entry performance of wall assemblies. Previously conducted experimental work [Ritchie and Plewes 1956; Ritchie and Plewes 1961; Roberts 1980; Newman and Whiteside 1981; Rathbone 1982] have provided substantial information on water penetration performance of various claddings under simulated driving rain loads, however, the quantity of water that may enter through the specific deficiencies at penetrations in the cladding, the path of water flow and the location of the water accumulation within the assembly in relation to simulated driving rain loads were not studied. Recently, experimental work [Lacasse et al. 2003] conducted for a study entitled MEWS (Moisture Management of Exterior Wall Systems), focused on determining the quantity of water entry through deficiencies incorporated in the cladding of 17 different wood stud assemblies when exposed to simulated driving rain loads, i.e. spray rates and pressure differences across the assembly. The assemblies were comprised of four cladding types including stucco, brick veneer, hardboard and vinyl siding, and EIFS.
This paper reports on a follow-up experimental work [Sahal and Lacasse 2004] in which only the hardboard siding clad wall specimen that included specific deficiencies was subjected to simulated driving rain loads in order to quantitatively assess the water entry of the assembly. In the MEWS study, the driving rain loads were simulated by different levels of spray rate and pressure difference consistent with driving rain intensities that may occur in extreme climatic events in North America. The subsequent work incorporated additional levels of spray rate and pressure difference as compared to previous work in order to simulate a broad range of possible service conditions that might prevail across North America. Tests were also conducted to determine whether cascading or spraying water to simulate deposition of driving rain on the surface of the cladding affected the quantity of water entry into the wall assembly.
The present experimental study followed a test protocol, previously described in Lacasse et al. [2003], that measured the air leakage, pressure response and water entry of the test specimen. The test protocol was initiated by characterizing the air leakage of the assembly in order to determine the effect of air leakage of the wall assembly to driving pressures across the assembly that may bring about water entry. Pressure response was measured to provide a measure of pressure differences across the wall assembly that in return established the driving pressures across the wall assembly. Quantifying the water entry through the specimen permitted evaluating the degree of water entry of the specimen and deriving the rates of entry in relation to simulated driving rain loads.
10DBMC International Conference on Durability of Building Materials and Components LYON [France] 17-20 April 2005
TT2-56, Water Entry at Penetrations in a Hardboard Siding-Clad Wood Stud Wall When Subjected to Simulated Driving Rain; N. Sahal and M. A. Lacasse
The primary components of the cladding assembly included hardboard lap siding affixed to 19-mm vertical pressure-treated wood strapping that provided a drainage cavity between the siding and sheathing membrane. The remainder of the wall assembly consisted of two (2) layers of 30-min. building paper applied as sheathing membrane onto a 12-mm glass mat gypsum sheathing board. The sheathing board was installed on 38-mm by 89-mm wood studs. An acrylic sheet was installed onto the outer side of the wood studs to provide an air barrier system. The test specimen nominally measured 2.44-m by 2.44-m.
Typical North American wood-frame wall components such as a vinyl flanged window, a ventilation duct and an electrical outlet were incorporated in the wall assembly. Each of these components penetrated the siding (1st line of defence), sheathing membrane (2nd line of defence) and the sheathing board.
Deficiencies, which simulated either imperfect installation or inadequate maintenance in the field, were introduced in the 1st (siding outer surface) and 2nd (sheathing membrane outer surface) lines of defence in order to provide water entry points in the wall assembly. At the 1st line of defence, the deficiency introduced at the wall-electrical outlet interface was a 50-mm of missing sealant length between the top of the cover plate and the cladding. The wall-ventilation duct interface incorporated the same kind of deficiency as the wall-electrical outlet at the 1st line of defence. At the wall-window interface, a 90-mm length of sealant was missing at the bottom centre of the windowsill, along one edge of the sill and at the bottom of the adjacent jamb. At the 2nd line of defence, the wall-electrical outlet interface incorporated a 6-mm gap between the edge of the sheathing board and the sheathing membrane, and a 50-mm of missing sealant length between the sheathing board and the bottom of the duct. The wall-vent duct incorporated the same kind of deficiencies as the wall-vent duct at the second line of defence. At the wall-window interface, a 6-mm gap between the window flange and the sheathing membrane was incorporated to the assembly. As well, a reverse lap between the rough sill protection and the sheathing membrane was introduced on the sheathing board.
Water collection troughs were located in the 19-mm cavity and in the stud space, specifically in proximity to the specified deficiencies, to facilitate the collection of any water entering deficiencies and passing through either the cladding or sheathing board. Locations of each trough are illustrated in Fig. 1. Troughs D, V, and TW were located in the 19-mm cavity, beneath the respective penetrations, i.e. electrical outlet (D), vent duct (V) and window (TW). As well, troughs T1 to T5 were located at the base of the wall in the cavity behind the cladding. Troughs T1 to T5 collected water that might penetrate the cladding and be deposited in the drainage cavity. These troughs were limited nominally to the breath of a stud space. Additionally, three troughs were situated in the stud cavity beneath the electrical outlet (E), vent duct (L) and window (W).
Pressure taps were located in the 19-mm cavity between the siding and the sheathing board, and in the stud cavity to obtain the pressure differences that may affect the likelihood of water entry past the cladding and the sheathing board.
An acrylic board situated on the outer surface of the wood studs served as the air barrier system. A series of three 6-mm diameter holes were introduced in the acrylic board about the centre of each stud space. Opening or closing the appropriate number of holes in the air barrier system could regulate the nominal rate of air leakage through the assembly.
3 DESCRIPTION OF TEST PROTOCOL
The test protocol was established to characterize the air leakage, pressure response and water entry of the test specimen, a detailed description of which is provided in [Lacasse et al. 2003]. The air leakage characterization of the specimen was achieved by measuring the air leakage rates through the specimen at different levels of static pressure difference and various equivalent leakage areas.
10DBMC International Conference on Durability of Building Materials and Components LYON [France] 17-20 April 2005
TT2-56, Water Entry at Penetrations in a Hardboard Siding-Clad Wood Stud Wall When Subjected to Simulated Driving Rain; N. Sahal and M. A. Lacasse
Different levels of equivalent leakage area were obtained by opening or closing an appropriate number of holes in the air barrier system. The required value of less than 0.6 L/s-m2, and the maximum value of air leakage rate were selected at a pressure difference of 75 Pa.
L E CH9 CH6 V D CH8 CH5 T5 T4 T3 T2 T1 TW CH17 CH14 W CH16 CH13
Figure 1. Location of water collection troughs and pressure taps [Lacasse et al. 2003]
At each degree of air barrier system leakage (ABSL), differential pressure transducers were used to measure the pressure drop in both the 19-mm drainage cavity and stud cavity, over a period of 10 minutes, at static pressure differences of 40, 75, 150, 300 and 600 Pa. The driving pressure ratios across the width of the wall at the electrical outlet, the ventilation duct and the window were determined. The driving pressure ratio is the ratio of driving pressure, i.e. pressure drop, across the cavity in relation to the static pressure difference across the specimen. The higher the value, the greater the potential driving pressure across the cavity.
The water entry characteristics of the specimen were determined by subjecting the specimen to varying spray rates and static pressure differences at each degree of ABSL. A spray rate of 3.4 L/min-m2 was applied to the exterior wall surface through a series of nozzles perpendicular to the surface of the cladding at increasing pressure steps of 0, 40, 75, 150, 300 and 600 Pa. Spray rates of 1.0, 2.0, 3.0 and 5.0 L/min-m2 were cascaded on the cladding surface from a cascade bar located at the top end of the cladding for the same increasing pressure steps. The intent was to determine the effect of simulated deposition of driving rain on the surface of the cladding to water entry rates. Water entry through the specified deficiencies to the stud cavity was observed. Water entering past the cladding and the sheathing board was collected in troughs over the given time period. Water entry rates were determined at each trough servicing the deficiencies at the electrical outlet, the ventilation duct and the window, in relation to spray rates and static pressure differences.
4 EXPERIMENTAL RESULTS 4.1 Air leakage characterization
An ABSL of 0.3 L/s-m2 was achieved when all the holes in the air barrier system were closed. Twenty-one holes of the same diameter - three openings in each stud cavity - represented an equivalent leakage area of 508-mm2 and provided a nominal ABSL of 0.6 L/s-m2 at a pressure difference of 75 Pa.
10DBMC International Conference on Durability of Building Materials and Components LYON [France] 17-20 April 2005
TT2-56, Water Entry at Penetrations in a Hardboard Siding-Clad Wood Stud Wall When Subjected to Simulated Driving Rain; N. Sahal and M. A. Lacasse
4.2 Pressure response characterization
Pressure taps of interest across the width of the wall at the electrical outlet were CH5 and CH6, which were located in proximity to water collection troughs D and E, as given in Fig. 1. When the assembly provided an ABSL of 0.3 L/s-m2, the driving pressure ratio within the drainage cavity and stud cavity ranged from 0.0 to 0.1 for the given pressure range. Similar results were obtained when the ABSL was 0.6 L/s-m2. The results indicated that the acrylic sheet provided the greatest resistance to air leakage throughout the test.
The pressure tap locations considered across the width of the wall at the vent duct were CH8 and CH9, which were located at the drainage and stud cavity, respectively. The driving pressure ratio in both cavities and each pressure step ranged from 0.0 to 0.1 for both ABSL levels. The results implied that pressure moderation occurred in the cavities, which in turn decreased the driving pressures across the cladding.
The pressure tap locations considered across the width of the wall at the window were CH13, CH14, CH16 and CH17. Pressure taps CH13 and CH16 were located immediately beneath the wall-window interface deficiency at the right and left drainage cavities when facing the inside of the wall, respectively. Pressure taps CH14 and CH17 were situated at the right and left stud cavities when facing the inside of the wall, respectively. When the ABSL was 0.3 L/s-m2, the driving pressure ratio at the drainage cavity (CH13 and CH16) for each pressure step ranged from 0.0 to 0.1. The driving pressure ratio at the stud cavity (CH14 and CH16) ranged from 0.1 to 0.2. However, when the specimen was evaluated with an ABSL of 0.6 L/s-m2, the driving pressure ratio at the drainage cavity increased, i.e. the ratio varied between 0.4 to 0.5 for the given range of pressures. The driving pressure ratio at the stud cavity varied between 0.85 to 0.98, when the ABSL was 0.6 L/s-m2. The results indicated that when the specimen ABSL increases, the proportion of pressure available to drive water through the openings likewise increases. This further suggest that there is greater likelihood of water entry through the specific deficiency at the given assembly having an ABSL of 0.6 L/s-m2 as compared to 0.3 L/s-m2.
4.3 Water entry assessment
When water was sprayed on the cladding at specified rates and pressure differences across the specimen, water entering the deficiency above the electrical outlet was collected at trough D, and some instances at trough E. No water was collected at trough T1. In other words, under the given simulated driving rain loads, water that passed the cladding through the specific deficiency was mostly drained into the drainage cavity. It should be noted that water ingress to the stud cavity was only observed in a few instances.
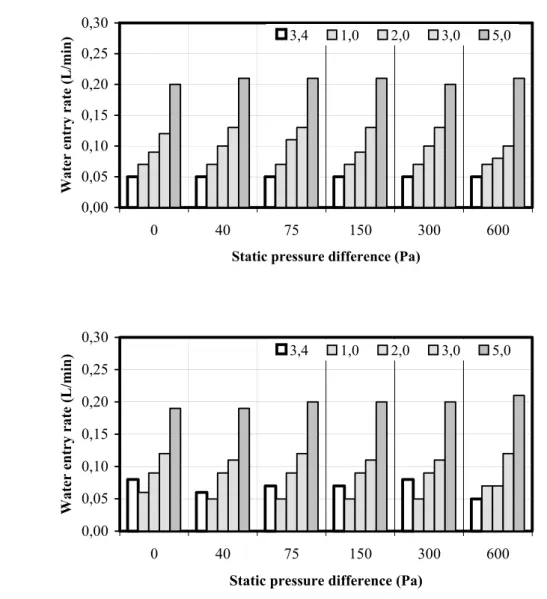
Water entry rates in trough D at a given pressure level as a function of spray rates and ABSL is given in Figs. 2a and b. A comparison of the range of values of entry rates in relation to changes in spray rates at a given pressure step to the range of values of entry rates in relation to changes in pressure level at a given spray rate suggest that water entry rates are primarily dependent on the spray rate and not the pressure difference across the assembly.
Water entering the deficiency above the ventilation duct was collected at troughs V and T2, and in some instances at trough L. Small amounts of water were collected intermittently at trough V.
Water entry rates in trough T2 as a function of spray rate and given pressure level when the assembly provided an ABSL of 3.0 L/s-m2 is given in Fig. 3a. Increases in spray rate tended to slightly increase the water entry rate in this trough at each given pressure level. However, the increase in entry rates was evident for spray rates of 3.0 and 5.0 L/min-m2 at pressure difference of 600 Pa.
10DBMC International Conference on Durability of Building Materials and Components LYON [France] 17-20 April 2005
TT2-56, Water Entry at Penetrations in a Hardboard Siding-Clad Wood Stud Wall When Subjected to Simulated Driving Rain; N. Sahal and M. A. Lacasse
0,00 0,05 0,10 0,15 0,20 0,25 0,30 0 40 75 150 300 600
Static pressure difference (Pa)
Water entry rate (L/min)
3,4 1,0 2,0 3,0 5,0 (b) 0,00 0,05 0,10 0,15 0,20 0,25 0,30 0 40 75 150 300 600
Static pressure difference (Pa)
Water entry rate (L/min)
3,4 1,0 2,0 3,0 5,0
Figure 2. Water entry rates through the deficiency above the electrical outlet collected at trough D, for test conditions (a) ABSL 0.3 L/s m2, (b) ABSL 0.6 L/s m2
Water entry rates for the ABSL of 0.6 L/s-m2 is provided in Fig. 3b. The same pattern occurred at the given ABSL. As well, water entry rates at spray rates 3.0 and 0.5 L/min-m2 and static pressure difference of 600 Pa increased when ABSL increased.
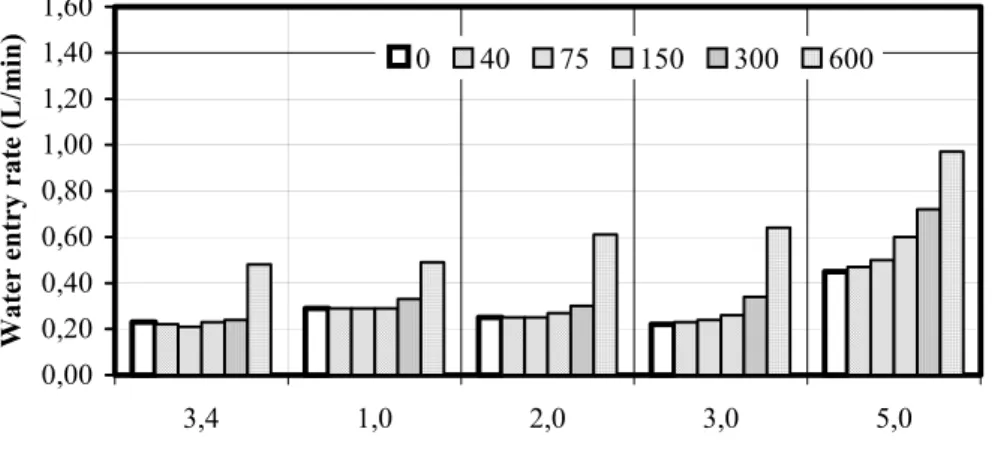
Water deposited on the cladding found its way through the deficiency beneath the window-wall interface and it was collected at troughs TW and T5. No water was collected at trough W. Fig. 4a illustrates the entry rates as a function of pressure differences across the specimen at given levels of spray rate when the assembly provided an ABSL of 3.0 L/s-m2. At the spray rates of 3.4, 1.0, 2.0 and 3.0 L/min-m2, the pressure applied on the cladding was increased at steps from 40 Pa to 300 Pa and the water entry rate tended to slightly increase at each pressure step. However, at the given spray rates of 3.4, 1.0, 2.0 and 3.0 L/min-m2, water entry rates increased significantly at the pressure difference of 600 Pa. Increases in rates of water entry in relation to corresponding increases in pressure difference across the assembly were evident at the spray rate of 5.0 L/min-m2.
10DBMC International Conference on Durability of Building Materials and Components LYON [France] 17-20 April 2005
TT2-56, Water Entry at Penetrations in a Hardboard Siding-Clad Wood Stud Wall When Subjected to Simulated Driving Rain; N. Sahal and M. A. Lacasse
0,00 0,10 0,20 0,30 0,40 0,50 0,60 0 40 75 150 300 600
Static pressure difference (Pa)
Water entry rate (L/min
) 3,4 1,0 2,0 3,0 5,0 (b) 0,00 0,10 0,20 0,30 0,40 0,50 0,60 0 40 75 150 300 600
Static pressure difference (Pa)
Water entry rate (L/min
) 3,4 1,0 2,0 3,0 5,0
Figure 3. Water entry rates through the deficiency above the ventilation duct that was collected at trough T2, (a) ABSL 0.3 L/s m2, (b) ABSL 0.6 L/s m2
Fig. 4b demonstrates that the same pattern had occurred when the system provided an ABSL of 0.6 L/s-m2. At the spray rate of 5.0 L/min-m2, water entry rates ranged from 0.44 to 1.5 L/min with corresponding pressure differences of 0 Pa to 600 Pa. Hence, increase in the air barrier system leakage resulted in an increase in water entry rates.
In all water entry tests, water entry through the deficiency at the electrical outlet, vent duct and window occurred even when there was no pressure difference across the specimen, i.e. when there was no driving pressure across the cladding. Hence, water leakage through the deficiency was attributed to gravity.
Figs. 2 to 4 demonstrate that cascading water rates on the cladding surface resulted in higher rates of water entry as compared to uniformly spraying water on the cladding surface. For example, in Fig. 2a, the rate of water entry obtained was 0.05 L/min, when a rate of 3.4 L/min-m2 was sprayed on the surface of the cladding and the pressure difference across the wall assembly was maintained at 40 Pa. At the same pressure step, water entry rates obtained were 0.07, 0.10, 0.13, and 0.21 L/min for corresponding rates of 1.0, 2.0, 3.0 and 5 L/min-m2 cascaded on the surface of the cladding.
10DBMC International Conference on Durability of Building Materials and Components LYON [France] 17-20 April 2005
TT2-56, Water Entry at Penetrations in a Hardboard Siding-Clad Wood Stud Wall When Subjected to Simulated Driving Rain; N. Sahal and M. A. Lacasse
0,00 0,20 0,40 0,60 0,80 1,00 1,20 1,40 1,60 3,4 1,0 2,0 3,0 5,0
Spray rates (L/min m2)
Water entry rate (L/min)
0 40 75 150 300 600 (b) 0,00 0,20 0,40 0,60 0,80 1,00 1,20 1,40 1,60 3,4 1,0 2,0 3,0 5,0
Spray rates (L/min m2)
Water entry rate (L/min
)
0 40 75 150 300 600
Figure 4. Water entry rates through the deficiency above the ventilation duct collected at trough TW and T5, for test conditions: (a) ABSL 0.3 L/s m2, (b) ABSL 0.6 L/s m2
5 CONCLUSIONS
The results of the tests indicated that water entry rates at the electrical outlet were primarily dependent on the amount of water deposited on the cladding. Increased rates of entry were evident for corresponding increases in rates of water sprayed onto the cladding surface.
Rates of entry for the specified deficiency at the ventilation duct at spray rates of 3.4, 1.0, and 2.0 L/min-m2 were loosely dependent on the amount of water deposited on the wall. However, water entry rates at spray rates of 3.0 and 5.0 L/min-m2 were dependent on pressure differences, particularly at 600 Pa.
Values for water entry rate at the window were more than those obtained from the electrical outlet or ventilation duct. Water entry through the deficiency at the window was dependent on pressure differences across the assembly; entry rates increased with increasing pressure levels.
Substantial amounts of water entered into deficiencies under gravity alone, i.e. when there was no pressure difference across the cladding. Increases in the entry rate were dependent on the increases in spray rate.
The simulation of water deposition, i.e. spraying water directly onto the surface of the cladding through arrays of nozzles or cascading the same rate of water from the top of the cladding surface had
10DBMC International Conference on Durability of Building Materials and Components LYON [France] 17-20 April 2005
TT2-56, Water Entry at Penetrations in a Hardboard Siding-Clad Wood Stud Wall When Subjected to Simulated Driving Rain; N. Sahal and M. A. Lacasse
a direct effect on the water entry rates. Cascading water at rates of 1.0, 2.0, 3.0 and 5.0 L/min-m2 on the cladding surface resulted in substantial increases in rates of water entry as compared to those obtained when spraying water at a rate of 3.4 L/min-m2 on the cladding.
As might be expected, significant more water was collected in the drainage cavity behind the cladding as compared to that in the stud cavity over a given period. This further highlights the importance of a drainage cavity as a useful means of reducing the likelihood of water entry to the stud cavity from incidental water entry through deficiencies in the cladding.
ACKNOWLEDGEMENT
Dr. Sahal gratefully acknowledges support from the Istanbul Technical University, as well as the Institute for Research in Construction over her work term at the National Research Council Canada. As well, the authors are indebted to Mr. Stacey Nunes, Technical Officer, for having completed the air leakage and water penetration tests.
REFERENCES
Carll, C., 2001, “Rainwater intrusion in light-frame building walls”, 2nd Annual Conference on Durability and Disaster Mitigation in Wood-Frame Housing, Forest Products Society, Madison, WI, USA, pp. 33-40.
Lacasse, M.A. (2003), "Durability and performance of building envelopes," BSI 2003 Proceedings (15 Cities across Canada, 10/7/2003), pp. 1-6, October 01, 2003 (Aussi disponible en français: Durabilité et performance des enveloppes de bâtiment) (NRCC-46888)
Lacasse, M. A., O’Connor, T. J., Nunes, S. and Beaulieu, P., 2003, Report from Task 6 of MEWS
Project Experimental Assessment of Water Penetration and Entry into Wood-frame Wall Specimens, Final Report, Research Report 133, Institute for Research in Construction, National
Research Council Canada, 133, (IRC-RR-133).
Morrison Hershfield Limited, 1996, Survey of Building Envelope Failures in the Coastal Climate of
British Columbia, Canada Mortgage and Housing Corporation.
Newman, A. J. and Whiteside, D., 1981, “Water and air penetration through brick walls-A theoretical and experimental study”, Transactions Journal of the British Ceramics Society, 80: 17-26.
Rathbone, A. J., 1982, Rain and Air Penetration Performance of Concrete Blockwork, Technical Report 553, Cement and Concrete Association.
RDH Building Engineering Limited, 2001, Study of High-rise Envelope Performance in the Coastal
Climate of British Columbia, Canada Mortgage and Housing Corporation.
Ritchie, T. and Plewes, W. G, 1956, Preliminary Tests of the Rain Resistance of Brickwork Panels, Internal Report, No. 108, Division of Building Research, National Research Council Canada, (DBR-RP-108).
Ritchie, T. and Plewes, W. G, 1961, Moisture Penetration of Brick Masonry Panels, Research paper no. 118, Division of Building Research, National Research Council Canada, (DBR-RP-118). Roberts, J. J., 1980, “Rain penetration problems with concrete blockwork”, Chemistry and Industry;
194-197.
Sahal, A. N. and Lacasse M. A., 2004, Water Penetration of Claddings-Overview of Physical
Parameters, Related Test Standards and Test and Research Facilities, Internal Report, Institute
for Research in Construction, National Research Council Canada; 863, (IRC-IR-863).
Sahal, A. N. and Lacasse M. A., 2004, Experimental assessment of water penetration and entry into
siding-clad wall specimen, Internal Report, Institute for Research in Construction, National
![Figure 1. Location of water collection troughs and pressure taps [Lacasse et al. 2003]](https://thumb-eu.123doks.com/thumbv2/123doknet/14184577.476885/6.892.254.636.178.542/figure-location-water-collection-troughs-pressure-taps-lacasse.webp)