arXiv:1103.1816v2 [hep-ex] 23 Mar 2011
(will be inserted by the editor)
Measurements of underlying-event properties using neutral
and charged particles in pp collisions at
√
s = 900 GeV
and
√
s = 7 TeV
with the ATLAS detector at the LHC
The ATLAS Collaboration
the date of receipt and acceptance should be inserted later
Abstract. We present first measurements of charged and neutral particle-flow correlations in pp colli-sions using the ATLAS calorimeters. Data were collected in 2009 and 2010 at centre-of-mass energies of 900 GeV and 7 TeV . Events were selected using a minimum-bias trigger which required a charged particle in scintillation counters on either side of the interaction point. Particle flows, sensitive to the underlying event, are measured using clusters of energy in the ATLAS calorimeters, taking advantage of their fine granularity. No Monte Carlo generator used in this analysis can accurately describe the measurements. The results are independent of those based on charged particles measured by the ATLAS tracking systems and can be used to constrain the parameters of Monte Carlo generators.
PACS. 12.38.Qk Experimental tests – 12.38.Aw General properties of QCD
1 Introduction
All hard parton-parton interactions in pp collisions are ac-companied by additional processes which collectively con-tribute additional particles to those from the hard scat-ter and which are scat-termed the underlying event (UE). It is impossible to uniquely separate the UE from the hard scattering process on an event-by-event basis. However, observables can be measured which are sensitive to prop-erties of the UE. In order to make high-precision measure-ments, the UE must be modelled using phenomenological models in Monte Carlo generators [1]. Such models must be tuned to experimental data. In the past, such studies have only been performed using tracks [2–5].
Many physics processes to be studied with the AT-LAS detector [6] require precision measurements of jets and missing transverse energy obtained principally from the calorimeter system. Therefore, it is important that the UE measurements are performed using the same instru-mental environment and reconstructed objects as those for the calorimeter-based measurements. The fine granu-larity of the ATLAS calorimeter allows the definition of three-dimensional clusters of energy which are closely as-sociated with individual particles [7, 8].
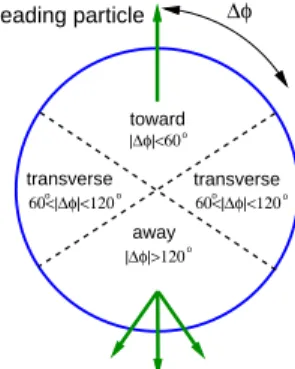
A study of the UE using charged-track densities was recently performed by ATLAS [5]. The present paper ex-tends this measurement by reconstructing particle densi-ties using calorimeter clusters in the region which is most sensitive to the soft QCD processes responsible for the UE; the “transverse” region as shown in Fig. 1. The az-imuthal angular distance between a leading particle in transverse momentum (pT) and other particles is given by
∆φ 60<|∆φ|<120 60<|∆φ|<120 transverse transverse away |∆φ|>120 toward o o o o o |∆φ|<60o leading particle
Fig. 1.A schematic representation of regions in the azimuthal angle φ with respect to the leading particle (shown with the arrow). In this analysis, the leading particle corresponds to the cluster with the largest transverse momentum.
∆φ = φ − φlead, where φ is the azimuthal angle of a parti-cle and φleadis the azimuthal angle of the leading particle. The transverse region, defined as 60◦
< |∆φ| < 120◦ , is most sensitive to the UE since it is perpendicular to the axis of hardest scattering, approximated by the direction of the leading particle. As is the case for charged particles, the number density of the clusters and their transverse en-ergy density in this region are sensitive, discriminating ob-servables for UE studies. These distributions are corrected for detector effects to give a measure of the particle ac-tivity in the UE and to provide new characteristics which can be used to tune models included in Monte Carlo gen-erators.
The analysis using calorimeter clusters has several im-portant features. Firstly, its results are sensitive to the en-tire hadronic final state, including neutral particles, which constitute about 40% of all produced particles. Secondly, the analysis based only on calorimeter clusters has com-pletely independent experimental uncertainties compared to the corresponding analysis [5] using charged particles. Finally, as discussed earlier, since jet reconstruction is based almost entirely on energy deposition in the calorime-ter, the results of this UE analysis can be used directly to estimate the effect of the underlying event on any jet-based measurement.
2 The ATLAS Detector
The ATLAS detector [6] at the Large Hadron Collider was designed to study a wide range of physics. It covers almost the entire solid angle around the collision point with layers of tracking detectors, calorimeters and muon chambers.
Charged tracks and vertices are reconstructed with the inner detector which consists of a silicon pixel detector, a silicon strip detector and a transition radiation tracker, all immersed in a 2 tesla magnetic field provided by a super-conducting solenoid. For the measurements presented in this paper, the high-granularity calorimeter systems are of particular importance. The ATLAS calorimeter system provides fine-grained measurements of shower energy de-positions over a large range in pseudorapidity1. Electro-magnetic calorimetry in the range |η| < 3.2 is provided by liquid argon (LAr) sampling calorimeters. This calorime-ter system provides measurements of the shower energy in up to four depth segments and with transverse gran-ularity that ranges from 0.003 × 0.10 to 0.05 × 0.025 in δη × δφ, depending on depth segment and rapidity. The hadronic calorimetry in the range |η| < 1.7 is provided by a steel/scintillator-tile sampling calorimeter. This system provides measurements of the shower energy deposition in three depth segments at a transverse granularity of typi-cally 0.1 × 0.1. In the end-caps (|η| > 1.5), LAr technol-ogy is used for the hadronic calorimeters that match the outer η limits of the end-cap electromagnetic calorimeters. This system provides four measurements in depth of the shower energy deposition at a transverse granularity of ei-ther 0.1×0.1 (1.5 < |η| < 2.5) or 0.2×0.2 (2.5 < |η| < 3.2). The LAr forward calorimeters provide both electromag-netic and hadronic energy measurements and extend the calorimeter coverage from |η| = 3.2 to |η| = 4.9. To mea-sure the energy of photons and electrons, all calorimeter
1
The ATLAS reference system is a Cartesian right-handed co-ordinate system, with the nominal collision point at the ori-gin. The anti-clockwise beam direction defines the positive z-axis, while the positive x-axis is defined as pointing from the collision point to the centre of the LHC ring and the posi-tive y-axis points upwards. The azimuthal angle φ is measured around the beam axis, and the polar angle θ is the angle mea-sured with respect to the z-axis. The pseudorapidity is given by η = − ln tan(θ/2). Transverse momentum is defined relative to the beam axis.
cells are initially calibrated to the electromagnetic energy scale using test-beam data [9–14].
This analysis is based on the properties of topological clusters in the calorimeter, which represent an attempt to reconstruct three-dimensional energy depositions as-sociated with individual particles [7, 8]. The topological-cluster algorithm proceeds through the following steps. Nearest neighbours are collected around seed cells, which are cells with an absolute signal greater than 4σ above the noise level [9–14]. Then, neighbouring cells are collected into the cluster if the absolute value of their signal sig-nificance is above a secondary seed threshold of 2σ. All surrounding cells are iteratively added to the cluster until no further secondary seeds are among the direct neigh-bours. A final analysis of the resulting cluster looks for multiple local signal maxima; in the case of more than one maximum in a given cluster, it is split into smaller clusters along the signal valleys between the maxima.
The analysis presented in this paper uses calibrated topological clusters [8]. The clusters are classified as re-lated to electromagnetic or hadronic energy deposits, us-ing detailed information on the cluster topology. Then, the reconstructed cluster energy is corrected for the non-compensating nature of the ATLAS calorimeter and for inactive material.
3 Data selection
The data taken at √s = 900 GeV were collected during 6–15 December 2009. During this running period, there were approximately 3% non-functional channels in the tile hadronic calorimeter and approximately 1% non-functional channels in the LAr calorimeters [13, 14]. For an inte-grated luminosity of 7 µb−1, a total of 455 thousand events were collected from colliding proton bunches in which a minimum-bias trigger recorded one or more hits in the scintillators on either side of the detector.
The events to be analysed were selected using a pro-cedure identical to that described in Refs. [5, 15]. Events were required to have a primary vertex which is recon-structed using at least two tracks with transverse mo-menta pT> 100 MeV and a transverse distance of closest approach with respect to the beam-spot position [16] of less than 4 mm.
This analysis uses topological clusters with pT > 0.5 GeV and |η| < 2.5 in order to have the same kinematic range2 as for the previous UE study based on tracks [5]. Additional selection criteria were applied to select good-quality clusters: 1) to reject the cosmic and noise back-ground, the leading cell energy of the cluster is required to be less than 90% of the cluster energy; 2) the energy sampling maximum must be in a calorimeter region with good calibration; 3) the fraction of energy in the cluster associated with problematic cells (or dead cells where the
2
The topological clusters are treated as massless particles, and we choose to refer to both clusters and stable particles in terms of pT. The same symbol pTis also used to represent the track transverse momentum.
energy contribution is obtained by interpolation from ad-jacent cells) should be less than 50%.
Data at√s = 7 TeV were collected between 30 March and 27 April 2010. Only a fraction of the 7 TeV data, cor-responding to an integrated luminosity of about 230 µb−1, was used. In total, about 7.7 million events were analysed. Event selection was similar to that for the 900 GeV data, but included the additional requirement of a single pri-mary vertex [5,15] to remove events containing more than one pp interaction.
4 Monte Carlo simulation
The QCD predictions for the hadronic final state in in-elastic pp collisions are based on several Monte Carlo gen-erators. The PYTHIA 6.4 Monte Carlo generator [17] is used as the primary generator for comparisons with the data. The MC09 tune [18] of this model was performed by ATLAS. It uses the pT-ordered parton shower with the MRST LO∗parton-density function [19], followed by frag-mentation into final-state particles using the Lund string model [20]. The parameters of this generator were adjusted to describe charged-particle multiplicity distributions in minimum-bias events measured at √s = 630 GeV and √
s = 1.8 TeV in p¯p collisions [21]. Diffractive processes are not included in the simulation for the main samples, but were used for systematic checks (Sect. 7). In addition to the MC09 tune, the following two PYTHIA parame-ter sets are also used: (1) the Perugia0 set [22] in which the soft-QCD part is tuned using only minimum-bias data from the Tevatron and CERN p¯p colliders; (2) the DW [23] PYTHIA tune, which uses virtuality-ordered showers and was derived to describe the CDF Run II underlying event and Drell-Yan data.
The data are also compared to the PHOJET Monte Carlo generator [24], which includes a simulation of the diffractive component. This generator is based on the two-component Dual Parton Model which includes soft hadronic processes described by Pomeron exchange and semi-hard processes described by perturbative parton scattering. The description of the fragmentation is the same as in the PYTHIA generator.
In addition, the HERWIG Monte Carlo generator [25, 26] was used for comparisons with the data. This gener-ator has similar matrix-element calculations as PYTHIA, but uses the cluster fragmentation model to hadronise par-tons into hadrons. HERWIG is interfaced with the JIMMY model [27] in order to describe multiple parton interac-tions.
Monte Carlo events were processed through the AT-LAS detector simulation program [28], which is based on Geant4 [29]. They were reconstructed using the same trigger and event selection as for the data. The size and po-sition of the collision beam-spot and the detailed descrip-tion of detector condidescrip-tions during the data-taking runs were included in the simulation.
Monte Carlo events after the detector simulation pro-gram were used for correcting the data to the stable-particle level defined as follows. The PYTHIA MC09 is
used to generate the primary samples for unfolding the effects of the detector. Monte Carlo stable particles are selected if their mean lifetimes are larger than 3 · 10−11 seconds. Neutrinos are excluded from consideration. Ac-cording to this definition, K0
S, Λ and Σ ±
are among those treated as stable particles. This definition allows a direct comparison between the results of previous track-based studies [5] and the present measurement.
5 Properties of calorimeter clusters
Figures 2 and 3 show the distributions of pT and η for topological clusters in data and simulated PYTHIA MC09 events at √s = 900 GeV and √s = 7 TeV , respectively. The distributions in each case are normalised to the num-ber of entries. In addition, the ratio plots show the ratio of simulation to data in the transverse region alone. The figures show overall good agreement between the data and the PYTHIA MC09 tune, with 20% discrepancies in some phase-space regions. While not shown in these figures, the Perugia0 tune agrees with the data to a similar extent. The contribution of the discrepancy in the high-pT tail is expected to be small on particle densities measured at pT > 0.5 GeV , and it was taken into account using re-weighting as described below. The observed differences between the data and the PYTHIA MC09 event sample for the η distributions are addressed in the studies of sys-tematic uncertainties.
Figures 4(a) and 5(a) show the multiplicity of topolog-ical clusters, with pT> 0.5 GeV and |η| < 2.5, versus the number of stable particles (charged and neutral) in simu-lated events for√s = 900 GeV and√s = 7 TeV . A strong correlation is observed between the number of topological clusters and the number of stable particles, indicating that clusters are a good representation of the particle activity in inelastic pp events.
Figures 4(b) and 5(b) show the correlation between the number of topological clusters and the number of pri-mary tracks selected in the same way as in the track-based studies [5, 15]. These figures also show a strong correla-tion. The Monte Carlo simulation shown in Fig. 4(c) and 5(c) reproduces these distributions well: the means and the root-mean-square deviations of one-dimensional pro-jections of these distributions agree with the Monte Carlo simulation within less than one percent for N (tracks) > 4. For events with a lower number of tracks, the data show a smaller mean value of the projection onto the x-axis than seen in the PYTHIA MC09 simulation. This is attributed to the absence of diffraction in the generated samples.
A Monte Carlo simulation study based on PYTHIA MC09 indicates that the probability that a second parti-cle lies within pδη2+ δφ2< 0.2 of a first in the selected inelastic pp events is below 1%. This simplifies the present analysis since there is negligible potential bias due to clus-ter overlap.
For the UE studies based on topological clusters, a good position measurement is required. The quality of the position reconstruction of the clusters was studied by
com-0.5 1 1.5 2 2.5 3 3.5 4 0.05 0.1 0.15 0.2 0.25 0.3 0.35 0.4 0.45
0.5 1 1.5 2 2.5 3 3.5 4
Entries/total 0.1 0.2 0.3 0.4 Data 2009 PYTHIA ATLAS MC09 ATLAS = 900 GeV s 0.5 1 1.5 2 2.5 3 3.5 4 0.8 0.9 1 1.1 1.2 [GeV] T p 0.5 1 1.5 2 2.5 3 3.5 4 0.8 1 1.2 [GeV] T p 0.5 1 1.5 2 2.5 3 3.5 4 0.8 1 1.2 all regions transverse region MC/Data [GeV] T p 0.5 1 1.5 2 2.5 3 3.5 4 0.8 1 1.2 Entries/total 0.005 0.01 0.015 0.02 0.025 0.03 0.035 0.04 0.045 0.05 2009 Data PYTHIA ATLAS MC09 ATLAS = 900 GeV s -3 -2 -1 0 1 2 3 0.8 0.9 1 1.1 1.2 η -3 -2 -1 0 1 2 3 0.8 1 1.2 η -3 -2 -1 0 1 2 3 0.8 11.2 all regionstransverse region
MC/Data η -3 -2 -1 0 1 2 3 0.8 1 1.2 (a) (b)
Fig. 2. A comparison between uncorrected data and the Monte Carlo simulation for topological cluster pT(a) and η (b) for pp collisions at√s = 900 GeV . The ratio plots show the inclusive sample (solid lines) and the transverse region (dashed lines).
0.5 1 1.5 2 2.5 3 3.5 4 0.05 0.1 0.15 0.2 0.25 0.3 0.35 0.4 0.45
0.5 1 1.5 2 2.5 3 3.5 4
Entries/total 0.1 0.2 0.3 0.4 Data 2010 PYTHIA ATLAS MC09 ATLAS = 7 TeV s 0.5 1 1.5 2 2.5 3 3.5 4 0.8 0.9 1 1.1 1.2 [GeV] T p 0.5 1 1.5 2 2.5 3 3.5 4 0.8 1 1.2 [GeV] T p 0.5 1 1.5 2 2.5 3 3.5 4 0.8 1 1.2 all regions transverse region MC/Data [GeV] T p 0.5 1 1.5 2 2.5 3 3.5 4 0.8 1 1.2 Entries/total 0.005 0.01 0.015 0.02 0.025 0.03 0.035 0.04 0.045 0.05 2010 Data PYTHIA ATLAS MC09 ATLAS = 7 TeV s -3 -2 -1 0 1 2 3 0.8 0.9 1 1.1 1.2 η -3 -2 -1 0 1 2 3 0.8 1 1.2 η -3 -2 -1 0 1 2 3 0.8 11.2 all regionstransverse region
MC/Data η -3 -2 -1 0 1 2 3 0.8 1 1.2 (a) (b)
Fig. 3. A comparison between uncorrected data and the Monte Carlo simulation for topological cluster pT(a) and η (b) for pp collisions at√s = 7 TeV . The ratio plots show the inclusive sample (solid lines) and the transverse region (dashed lines).
paring the impact point of charged particles with the as-sociated cluster position in the calorimeter. Charged par-ticles are deflected in the magnetic field of the solenoid. Their trajectories are extrapolated to the calorimeter us-ing a Monte Carlo simulation which includes a detailed field map as well as the effect of the material in front of the calorimeter. The Monte Carlo simulation describes the topological-cluster positions relative to the positions of the extrapolated tracks on the surface of the LAr calorimeter
within the granularity of its second layer (0.025 × 0.025 in δη × δφ).
As the correction for detector effects is based on the Monte Carlo simulation, an essential issue is the accu-racy with which the simulation reproduces the energy re-construction in the calorimeter. For charged particles, the energy scale was studied [30, 31] using isolated tracks by extrapolating tracks to the calorimeter surface and match-ing them to topological clusters. The average value of the ratio E/p was reconstructed, where E is the cluster energy
0 0.005 0.01 0.015 0.02 0.025 N(truth) 0 5 10 15 20 25 30 35 40 N(clusters) 0 5 10 15 20 25 30 35 40 PYTHIA ATLAS MC09 ATLAS = 900 GeV s 0 0.005 0.01 0.015 0.02 0.025 N(tracks) 0 5 10 15 20 25 30 35 40 N(clusters) 0 5 10 15 20 25 30 35 40 Data 2009 ATLAS = 900 GeV s 0 0.005 0.01 0.015 0.02 0.025 N(tracks) 0 5 10 15 20 25 30 35 40 N(clusters) 0 5 10 15 20 25 30 35 40 PYTHIA ATLAS MC09 ATLAS = 900 GeV s (a) (b) (c)
Fig. 4. ATLAS data at√s = 900 GeV : The correlations between the multiplicities of, (a) topological clusters (N (clusters)) and stable particles (N (truth)) from simulated pp interactions, (b) topological clusters and primary reconstructed tracks (N (tracks)) from pp interactions, and (c) topological clusters and primary reconstructed tracks from simulated pp interactions. Inelastic events generated by PYTHIA MC09 (without diffraction) passed through the selection were used to produce the plots (a) and (c). 0 0.005 0.01 0.015 0.02 0.025 N(truth) 0 10 20 30 40 50 N(clusters) 0 10 20 30 40 50 PYTHIA ATLAS MC09 ATLAS = 7 TeV s 0 0.005 0.01 0.015 0.02 0.025 N(tracks) 0 10 20 30 40 50 N(clusters) 0 10 20 30 40 50 Data 2010 ATLAS = 7 TeV s 0 0.005 0.01 0.015 0.02 0.025 N(tracks) 0 10 20 30 40 50 N(clusters) 0 10 20 30 40 50 PYTHIA ATLAS MC09 ATLAS = 7 TeV s (a) (b) (c)
Fig. 5. ATLAS data at√s = 7 TeV : The correlations between the multiplicities of, (a) topological clusters (N (clusters)) and stable particles (N (truth)) from simulated pp interactions, (b) topological clusters and primary reconstructed tracks (N (tracks)) from pp interactions, and (c) topological clusters and primary reconstructed tracks from simulated pp interactions. Inelastic events generated by PYTHIA MC09 (without diffraction) passed through the selection were used to produce the plots (a) and (c).
in the calorimeter and p is the track momentum. Figure 6 shows the average response hE/pi for calibrated topologi-cal clusters as a function of η for tracks with p > 0.5 GeV . The data and PYTHIA MC09 agree within 5% in most η regions, while discrepancies increase in the transition re-gion (1.5 < |η| < 1.8) between barrel and end-cap.
To estimate the relative energy-scale uncertainty, the double ratio hE/piM C/hE/pi was calculated, where the ratio hE/piM Cwas determined from the Monte Carlo sim-ulation. The double ratio as a function of η is shown in Fig. 6 (bottom). The double-ratio distributions were mea-sured for a wide range of track momenta and η as de-scribed in Refs. [30, 31].
The comparison between data and Monte Carlo pre-dictions for the shapes of the E/p distribution is shown in Fig. 7. The peak at zero corresponds to isolated tracks that have no associated cluster in the calorimeter. These are predominantly due to hadronic interactions in the ma-terial in front of the calorimeter [31]. The contribution of the discrepancies observed for E/p = 0 between the data and PYTHIA MC09 to uncertainties on the reconstruc-tion efficiencies of topological clusters is below 1%. This effect was taken into account as described in Sect. 7. More details on the energy scale of topological clusters can be found in Refs. [30, 32].
The energy scale for electromagnetic clusters was es-timated using the π0 peak reconstructed in inelastic pp
-2 -1.5 -1 -0.5 0 0.5 1 1.5 2 <E/p> 0.45 0.5 0.55 0.6 0.65 0.7 0.75 0.8 0.85 p > 0.5 GeV Data 2010 PYTHIA ATLAS MC09 ATLAS = 7 TeV s η -2 -1.5 -1 -0.5 0 0.5 1 1.5 2 M C /D A T A 1 1.1
Fig. 6.The average E/p in different η bins for isolated topolog-ical clusters matched to charged tracks in inelastic pp events at √s = 7 TeV for track momentum p larger than 0.5 GeV . A ilar level of agreement between data and the Monte Carlo sim-ulation was obtained for the√s = 900 GeV data (not shown).
events. The selection criteria for calibrated topological clusters were the same as for the present analysis. The π0 peak positions for data and PYTHIA MC09 agree within 3% for all η regions.
Correction of the observed distributions to the parti-cle level requires a reliable description of the cluster mul-tiplicity distribution by the simulated event sample. This was studied by examining cluster multiplicities in bins of track multiplicity using projections of the two-dimensional distributions shown in Figs. 4 and 5. The observed differ-ences are propagated into the systematic uncertainties as discussed in Sect. 7.
For the UE studies, the so-called “leading” clusters, i.e. clusters with the largest transverse momenta, plead
T , are used to define an event orientation. Such clusters are typically inside the most energetic jets. To verify this, jets were reconstructed with the anti-ktalgorithm [33] with a distance parameter of 0.4, a minimum pT requirement of 5 GeV and |η| < 2.5. Then, the distance in η–φ between the leading topological cluster and the centre of the leading jet was calculated. It was shown that, in the vast majority of cases, the leading cluster is inside a leading jet with only a small fraction (≃ 10%) of clusters opposite the leading jet in φ. This feature is well reproduced by the Monte Carlo simulation.
To verify the Monte Carlo performance for plead T , the ratio of plead
T of topological clusters to pleadT of primary tracks was reconstructed. The agreement between the data and the PYTHIA MC09 tune for such distributions was found to be within ±5% in most regions, while discrep-ancies at the level of 20% were found for the tails of the ratio distributions. The impact of such discrepancies in the simulation of the plead
T resolution on the final measurement has been estimated as discussed in Sect. 7.
Monte Carlo studies show that the rate of events in which a low-pTparticle is reconstructed as a high-pT clus-ter is not negligible. This results in a low purity for topo-logical clusters at high plead
T . Therefore, the analysis was performed for leading topological clusters with transverse momenta less than 8 GeV (14 GeV ) for the√s = 900 GeV (7 TeV ) data in order to limit this effect and to ensure that the reconstruction purity even at the highest transverse momenta considered is larger than 50%.
6 Measured observables and correction
procedure
Following earlier track-based analyses [5], particle densi-ties are studied as a function of the distance ∆φ in the azimuthal angle between the leading cluster and all other clusters in an event, and as a function of pTof the leading cluster in the event. The scalar pTsum for stable particles per unit area in η–φ in the transverse region is also pre-sented. This provides complementary information to that which can be obtained from the particle densities.
The particles and clusters are required to have pT > 0.5 GeV and |η| < 2.5. Clusters are selected if they pass the criteria described in Sect. 3. The measured observables at the particle and detector levels are:
– plead
T - Transverse momentum of the stable particle with maximum pTin the event. At the detector level, this corresponds to the transverse momentum of the selected topological cluster with maximum pT in the event.
– dhNi/d∆φ - The average number of particles as a func-tion of the azimuthal-angle difference between the ing particle and other particles in an event. The lead-ing particle at ∆φ = 0 is excluded from this distri-bution. At the detector level, it corresponds to the mean number of selected topological clusters as a func-tion of the azimuthal-angle distance between the lead-ing topological cluster and other clusters in an event. This density [5] is defined per unit of pseudorapidity as N/(Nev· (ηmax− ηmin)), where N is the number of entries in ∆φ bins, ηmax− ηmin= 5 represents the full pseudorapidity range, and Nevis the number of events selected by requiring a particle with plead
T above the specified value.
– hd2N/dηdφi - Mean number of stable particles per unit area in η–φ. At the detector level, this corresponds to the mean number of selected topological clusters per unit area in η–φ. This density is measured as a function of plead
-0.5 0 0.5 1 1.5 2 2.5 3 E ntr ies /T o tal -4 10 -3 10 -2 10 -1 10 0.5<p [GeV]<1.2 Data 2010 PYTHIA ATLAS MC09 ATLAS = 7 TeV s E/p -0.5 0 0.5 1 1.5 2 2.5 3 M C /D A T A 0.8 1 1.2 -0.5 0 0.5 1 1.5 2 2.5 3 E ntr ies /T o tal -4 10 -3 10 -2 10 -1 10 1.2<p [GeV]<2.2 ATLAS = 7 TeV s E/p -0.5 0 0.5 1 1.5 2 2.5 3 M C /D A T A 0.8 1 1.2 -0.5 0 0.5 1 1.5 2 2.5 3 E ntr ies /T o tal -4 10 -3 10 -2 10 -1 10 2.2<p [GeV]<10 ATLAS = 7 TeV s E/p -0.5 0 0.5 1 1.5 2 2.5 3 M C /D A T A 0.8 1 1.2 (a) (b) (c)
Fig. 7. E/p distributions at √s = 7 TeV for topological clusters matched to tracks in several bins of track momentum: (a) 0.5 < p < 1.2 GeV , (b) 1.2 < p < 2.2 GeV and (c) 2.2 < p < 10 GeV . The peak at zero corresponds to the events without a good match between a topological cluster and a track. A similar level of agreement between data and Monte Carlo was obtained for the√s = 900 GeV data (not shown).
– hd2P pT/dηdφi - Mean scalar pT sum for stable par-ticles per unit area in η–φ. At the detector level, this corresponds to the mean scalar pT sum for selected topological clusters per unit area in η–φ. This quantity is defined following the convention used in the previous ATLAS publication [5].
A bin-by-bin correction procedure is used to correct the observed distributions to the stable-particle level. The correction factors
C = A gen Adet,
are evaluated separately for each observable. In the above expression, Agen is calculated at the stable-particle level of PYTHIA MC09 and Adetis calculated after full detec-tor simulation and reconstruction. The corrected value for an observable is found by multiplying its measured value by the relevant correction factor C. These factors correct the data to the stable-particle level and include the effects of event selection, reconstruction efficiency, bin migrations and smearing, including the case when the leading parti-cle is mis-identified and a cluster corresponding to a sub-leading particle is used to define the event orientation and plead
T .
The bin-by-bin correction depends on the choice of the Monte Carlo event generator. This affects the efficiency correction (mainly due to variations in particle types) and the purity (different stable-particle level distributions have different fractions of poorly reconstructed objects in each bin as well as different bin migrations). To reduce the model dependence of the correction procedure, bin-by-bin migrations were minimised by using bin-by-bin sizes larger than the reconstruction resolutions for the distributions
presented. In addition, the analysis was restricted to the plead
T ranges where the purity of leading clusters is above 50% (see Sect. 5).
The bin-by-bin correction factors for the particle densi-ties typically have values of around 1.3 and do not exceed 1.4. The largest single contributor is the reconstruction inefficiency of topological clusters, which leads to a bin-by-bin correction factor of approximately 1.2 on average and has a maximum value of 1.3 at low pT. The other significant contributor is the event reorientation which re-sults from inefficiency of the reconstruction of the leading topological cluster in an event. This causes bin migrations, which were studied by replacing the leading cluster plead
T by the leading track plead
T (track), for which the efficiency is known to be high [5]. The bin-by-bin corrections for the average scalar pT sum have a maximum value of 1.5 for low plead
T and decrease to 1.3 for pleadT > 6 GeV .
To study the contribution from diffractive events, the PYTHIA [17] and PHOJET [24] Monte Carlo generators were used. Non-diffractive inelastic pp events were mixed with single and double diffractive events in accordance with the corresponding generator cross-sections for such processes. The diffractive contribution was found to be below 1% for the dhNi/d∆φ densities at plead
T > 1 GeV in PYTHIA, and almost entirely concentrated at low multi-plicities (fewer than four topological clusters). The contri-bution of diffractive events is larger for hd2N/dηdφi and hd2P pT/dηdφi measured at plead
T < 3 GeV , but becomes negligible for plead
T > 3 GeV . Diffractive contributions are higher for PHOJET, but their contribution was found to be smaller than the systematic uncertainties on the final
measurements. No attempt to subtract diffractive events from the final measurements was made.
7 Systematic uncertainties
The systematic uncertainties on the measured distribu-tions were determined by changing the selection or the analysis procedure and repeating the analysis. The largest uncertainties are described below:
• The following procedure was used to estimate the ef-fect of the relative energy-scale uncertainty on the final measurements. The double ratio hE/piM C/hE/pi was calculated for isolated single particles as described in Sect. 5. The effect of the energy-scale uncertainty on the measured densities was found by decreasing and increasing the pT of topological clusters in the Monte Carlo simulation, keeping the same cluster pT in the data. The magnitude of the variation was set by the value of the double ratio calculated in a grid defined in η and p. To simplify the calculation of the sys-tematic uncertainties, a common variation was used for all topological clusters independent of their ori-gin (hadronic or electromagnetic). The effect of the energy-scale uncertainty is significantly larger than that due to the event selection (including trigger) [15]. • The dependence of the bin-by-bin corrections on the
detector material description was estimated by recal-culating the corrections using two further samples: one with an extra 10% of material in the tracking system, and the other with ∼ 15% additional material in the region |η| > 2.
• The physics-model dependence of the bin-by-bin cor-rections was estimated using the Perugia0 tune [22] instead of PYTHIA MC09. This uncertainty was sym-metrised.
• A comparison of multiplicities of topological clusters in bins of track multiplicities indicated some discrepancy between data and Monte Carlo for events with low track multiplicities (see Sect. 5). To estimate a system-atic uncertainty to account for this discrepancy, the bin-by-bin acceptance corrections were calculated af-ter re-weighting the PYTHIA MC09 detector-level dis-tributions. For this, cluster multiplicity distributions were measured in bins of track multiplicity and re-weighting factors were calculated by taking the ratio of the above distribution in data and PYTHIA MC09. The re-weighting procedure also addresses the uncer-tainties on the noise description used in the Monte Carlo simulation and other effects related to the cluster-reconstruction efficiencies.
• A systematic uncertainty was estimated to account for differences in the pT resolution of leading topo-logical clusters in data compared to the Monte Carlo expectation. Discrepancies in the tails of the distribu-tions of plead
T (clusters)/pleadT (tracks) were used to ex-tract weighting factors, which were then used to recal-culate the acceptance corrections.
Table 1 shows the values of the systematic uncertain-ties discussed above as a percentage of the measured val-ues. Only the largest values are shown for the bins with the most significant effect from the selection variations or change in the experimental procedure.
In addition to these uncertainties, the following sys-tematic variations were also included: 1) in order to re-duce the contribution from diffractive events, the mea-surement was repeated after removing events with fewer than four clusters; 2) the positions of cluster centres in η and φ were shifted by the size of one cell; 3) an alternative model (FTFP-Bertini) for the hadronic-shower simulation in Geant4 was used to extract the correction factors; 4) the calorimeter transition region of 0.94 < |η| < 1.06, which is not well described by the Monte Carlo simulation was removed in the data and in the simulated PYTHIA MC09 sample. These variations each give systematic un-certainties below 2%, with the exception of that for diffrac-tive events which indicate a 7 − 10% systematic uncer-tainty for the hd2N/dηdφi and hd2P pT/dηdφi densities measured at plead
T < 3 GeV . As an additional systematic check, the measurement was also repeated using topolog-ical clusters at the electromagnetic energy scale and simi-lar differences between data and Monte Carlo simulations were observed.
The overall systematic uncertainty was determined by adding the above uncertainties in quadrature.
8 Results
Figure 8 shows the density distribution dhNi/d∆φ of stable-particles as a function of the distance in azimuthal an-gle between the leading particle and other particles in an event for√s = 900 GeV . This density, defined in Sect. 6, is calculated for events selected by requiring a particle with plead
T above the values indicated on the figure. The detec-tor correction for this density is discussed in Sect. 6. The total uncertainty, computed from the addition of statisti-cal and systematic uncertainties in quadrature, is shown as a shaded band on all measurements.
The angular distribution shown in Fig. 8 has a peak at ∆φ ≃ 0 which reflects the particle activity from the hard interaction. The peak narrows as plead
T increases. The shape of this distribution is similar to that observed in the recent track-based publications [2–5], and also similar to the transverse-momentum flow around jets observed at a lower p¯p collision energy [34]. The particle densities measured using topological clusters are higher than the charged-particle densities measured using tracks [5], which is expected from the neutral-particle contribution.
Figure 9 shows the ∆φ density distributions for√s = 7 TeV . The distributions show narrower peaks, for a given plead
T threshold, than for the √
s = 900 GeV data.
The data are compared to the PYTHIA Monte Carlo generator with the MC09, Perugia0 and DW tunes, PHO-JET and HERWIG+JIMMY. The Monte Carlo genera-tors reproduce the general features of the data, but fail to describe the detailed behaviour, as can be seen in the fig-ures. The MC09 and Perugia0 PYTHIA tunes are closest
Check dhNi/d∆φ hd2 N/dηdφi hd2PpT /dηdφi Energy scale ±4.3% ±4% ±5.6% Additional material +3.5% +3% +3.6% Model dependence ±3.5% ±5% ±4.5% Multiplicity reweighting ±4.5% ±10% ±11% Resolution reweighting ±0.4% ±6% ±6%
Table 1. A summary of the most important systematic uncertainties. The table lists the values of contributions from different groups of systematic checks. Only the largest values are shown, taken from the bins with the largest effect when the systematic variation was applied.
[rad] φ ∆ -3 -2 -1 0 1 2 3 φ∆ d<N> / d 0.2 0.3 0.4 0.5 0.6 0.7 0.8 0.9 1 1.1 1.2 -3 -2 -1 0 1 2 3 0.2 0.3 0.4 0.5 0.6 0.7 0.8 0.9 1 1.1 1.2 Data 2009 PYTHIA ATLAS MC09 PYTHIA Perugia0 PYTHIA DW HERWIG+JIMMY PHOJET |<2.5 η >0.5 GeV | T charged+neutral particles p >1 GeV lead T p ATLAS = 900 GeV s [rad] φ ∆ -3 -2 -1 0 1 2 3 φ∆ d<N> / d 0.2 0.3 0.4 0.5 0.6 0.7 0.8 0.9 1 1.1 1.2 [rad] φ ∆ -3 -2 -1 0 1 2 3 φ∆ d<N> / d 0.2 0.3 0.4 0.5 0.6 0.7 0.8 0.9 1 1.1 1.2 |<2.5 η >0.5 GeV | T charged+neutral particles p >2 GeV lead T p ATLAS = 900 GeV s -3 -2 -1 0 1 2 3 0.2 0.3 0.4 0.5 0.6 0.7 0.8 0.9 1 1.1 1.2 [rad] φ ∆ -3 -2 -1 0 1 2 3 φ∆ d<N> / d 0.2 0.3 0.4 0.5 0.6 0.7 0.8 0.9 1 1.1 1.2 [rad] φ ∆ -3 -2 -1 0 1 2 3 φ∆ d<N> / d 0.2 0.3 0.4 0.5 0.6 0.7 0.8 0.9 1 1.1 1.2 ATLAS = 900 GeV s >3 GeV lead T p |<2.5 η >0.5 GeV | T charged+neutral particles p (a) (b) (c)
Fig. 8.The average number of particles per unit of pseudorapidity as a function of the azimuthal separation between the leading particle and other particles in inelastic pp collisions at√s = 900 GeV . The shaded band shows the statistical and systematic uncertainties added in quadrature. The densities are shown for (a) plead
T > 1 GeV , (b) p lead T > 2 GeV and (c) p lead T > 3 GeV . [rad] φ ∆ -3 -2 -1 0 1 2 3 φ∆ d<N> / d 0.2 0.4 0.6 0.8 1 1.2 1.4 1.6 1.8 2 2.2 -3 -2 -1 0 1 2 3 0.2 0.4 0.6 0.8 1 1.2 1.4 1.6 1.8 2 2.2 Data 2010 PYTHIA ATLAS MC09 PYTHIA Perugia0 PYTHIA DW HERWIG+JIMMY PHOJET |<2.5 η >0.5 GeV | T charged+neutral particles p >1 GeV lead T p ATLAS = 7 TeV s [rad] φ ∆ -3 -2 -1 0 1 2 3 φ∆ d<N> / d 0.2 0.4 0.6 0.8 1 1.2 1.4 1.6 1.8 2 2.2 [rad] φ ∆ -3 -2 -1 0 1 2 3 φ∆ d<N> / d 0.2 0.4 0.6 0.8 1 1.2 1.4 1.6 1.8 2 2.2 >2 GeV lead T p ATLAS = 7 TeV s |<2.5 η >0.5 GeV | T charged+neutral particles p -3 -2 -1 0 1 2 3 0.2 0.4 0.6 0.8 1 1.2 1.4 1.6 1.8 2 2.2 [rad] φ ∆ -3 -2 -1 0 1 2 3 φ∆ d<N> / d 0.2 0.4 0.6 0.8 1 1.2 1.4 1.6 1.8 2 2.2 [rad] φ ∆ -3 -2 -1 0 1 2 3 φ∆ d<N> / d 0.2 0.4 0.6 0.8 1 1.2 1.4 1.6 1.8 2 2.2 ATLAS = 7 TeV s pleadT >3 GeV |<2.5 η >0.5 GeV | T charged+neutral particles p (a) (b) (c)
Fig. 9. The average number of particles per unit of pseudorapidity as a function of the azimuthal separation between the leading particle and other particles in inelastic pp collisions at √s = 7 TeV . The shaded band shows the statistical and systematic uncertainties added in quadrature. The densities are shown for (a) plead
T > 1 GeV , (b) p lead
T > 2 GeV and (c) p lead
1 2 3 4 5 6 7 8 0.1 0.2 0.3 0.4 0.5 0.6 0.7 0.8 0.9 1 1 2 3 4 5 6 7 8 > φ d η N/d 2 <d 0.1 0.2 0.3 0.4 0.5 0.6 0.7 0.8 0.9 1 ATLAS = 900 GeV s 1 2 3 4 5 6 7 8 > φ d η N/d 2 <d 0.1 0.2 0.3 0.4 0.5 0.6 0.7 0.8 0.9 1 ATLAS = 900 GeV s Transverse region |<2.5 η >0.5 GeV | T charged+neutral particles p Data 2009 PYTHIA ATLAS MC09 PYTHIA Perugia0 PYTHIA DW HERWIG+JIMMY PHOJET 1 2 3 4 5 6 7 8 0.7 0.8 0.9 1 1.1 [GeV] lead T p 1 2 3 4 5 6 7 8 0.8 1 MC/Data [GeV] lead T p 1 2 3 4 5 6 7 8 0.8 1 2 4 6 8 10 12 14 0.2 0.4 0.6 0.8 1 1.2 1.4 1.6 1.8 2 2.2 2 4 6 8 10 12 14 > φ d η N/d 2 <d 0.2 0.4 0.6 0.8 1 1.2 1.4 1.6 1.8 2 2.2 2 4 6 8 10 12 14 > φ d η N/d 2 <d 0.2 0.4 0.6 0.8 1 1.2 1.4 1.6 1.8 2 2.2 Data 2010 PYTHIA ATLAS MC09 PYTHIA Perugia0 PYTHIA DW HERWIG+JIMMY PHOJET ATLAS = 7 TeV s Transverse region |<2.5 η >0.5 GeV | T charged+neutral particles p 2 4 6 8 10 12 14 0.7 0.8 0.9 1 1.1 [GeV] lead T p 2 4 6 8 10 12 14 0.8 1 [GeV] lead T p 2 4 6 8 10 12 14 0.8 1 MC/Data [GeV] lead T p 2 4 6 8 10 12 14 0.8 1 (a) (b)
Fig. 10. The average number of stable particles per event per unit interval in η–φ, as a function of plead
T , for the transverse region indicated in Fig. 1. The results are shown for (a)√s = 900 GeV and (b) for√s = 7 TeV pp collisions. The shaded band shows the statistical and systematic uncertainties added in quadrature.
to the data. The PHOJET generator significantly under-estimates the particle densities, while the PYTHIA DW and HERWIG overestimate the data at ∆φ ≃0. The data are seen to have a large discriminating power and are thus useful to constrain the parameters of Monte Carlo gener-ators.
Figure 10 shows the mean number of particles per event per unit interval in η and φ as defined in Sect. 6. The density was calculated in the transverse region illustrated in Fig. 1, as a function of plead
T . None of the Monte Carlo predictions describe the data well. The DW tune is the most similar to the observed data. As is seen in the ∆φ distribution, the PHOJET simulation lacks a hard com-ponent for √s = 7 TeV . The particle density increases almost by a factor of two, going from √s = 900 GeV to √s = 7 TeV at a similar plead
T , which is comparable to what is seen in all Monte Carlo generators.
Figure 11 shows the mean scalar pT sum for stable particles in the transverse region as a function of plead
T . As for the particle densities, the mean transverse-momentum sum is measured per unit interval in η and φ (see Sect. 6). Again, the Monte Carlo predictions do not fully describe the data. The largest discrepancy with the data is found for the PHOJET generator.
9 Conclusions
Particle densities sensitive to the underlying event in pp collisions at centre-of-mass energies of 900 GeV and 7 TeV are presented. This is the first such analysis completely based on calorimetric measurement of three-dimensional energy depositions, which is made possible by the fine granularity of the ATLAS calorimeter with transverse and longitudinal samplings.
The particle densities were studied and compared with several Monte Carlo generators tuned to pre-LHC data. None of the Monte Carlo generators describe the mea-surements well. In particular, the Monte Carlo predictions have discrepancies with the data for the particle density as a function of the azimuthal angle between the leading par-ticle and any other parpar-ticle in an event. The Monte Carlo generators typically predict a lower particle density in the transverse region (|∆φ| ≃ π/2), while in the toward re-gion (∆φ ≃ 0), the PYTHIA DW and HERWIG+JIMMY generators both overestimate the densities. PHOJET sig-nificantly fails for the √s = 7 TeV data. For the particle densities as a function of plead
T , all the Monte Carlo gener-ators also fail to describe the data, predicting lower than observed particle activity in the transverse region. A sim-ilar conclusion holds for the total transverse momentum of particles in the transverse region.
The particle densities measured using topological clus-ters are higher than the charged-particle densities
mea-1 2 3 4 5 6 7 8 0.1 0.2 0.3 0.4 0.5 0.6 0.7 0.8 1 2 3 4 5 6 7 8 > [GeV] φ d η /d T p ∑ 2 <d 0.1 0.2 0.3 0.4 0.5 0.6 0.7 0.8 1 2 3 4 5 6 7 8 > [GeV] φ d η /d T p ∑ 2 <d 0.1 0.2 0.3 0.4 0.5 0.6 0.7 0.8 Data 2009 PYTHIA ATLAS MC09 PYTHIA Perugia0 PYTHIA DW HERWIG+JIMMY PHOJET ATLAS = 900 GeV s Transverse region |<2.5 η >0.5 GeV | T charged+neutral particles p 1 2 3 4 5 6 7 8 0.7 0.8 0.9 1 1.1 [GeV] lead T p 1 2 3 4 5 6 7 8 0.8 1 MC/Data [GeV] lead T p 1 2 3 4 5 6 7 8 0.8 1 2 4 6 8 10 12 14 0.2 0.4 0.6 0.8 1 1.2 1.4 1.6 1.8 2 2 4 6 8 10 12 14 > [GeV] φ d η /d T p ∑ 2 <d 0.2 0.4 0.6 0.8 1 1.2 1.4 1.6 1.8 2 Data 2010 PYTHIA ATLAS MC09 PYTHIA Perugia0 PYTHIA DW HERWIG+JIMMY PHOJET ATLAS = 7 TeV s Transverse region |<2.5 η >0.5 GeV | T charged+neutral particles p 2 4 6 8 10 12 14 0.7 0.8 0.9 1 1.1 [GeV] lead T p 2 4 6 8 10 12 14 0.8 1 [GeV] lead T p 2 4 6 8 10 12 14 0.8 1 MC/Data [GeV] lead T p 2 4 6 8 10 12 14 0.8 1 (a) (b)
Fig. 11. The average scalar pT sum for stable particles per unit area in η–φ in the transverse region as a function of p lead T for (a)√s = 900 GeV and (b)√s = 7 TeV data. The shaded band shows the statistical and systematic uncertainties added in quadrature.
sured using tracks [5]. This is expected from the neutral-particle contribution. The discrepancies between the data and Monte Carlo generators agree with those observed for charged particles [5]. These measurements have system-atic uncertainties independent to the track-based studies and provide additional information which may be used to improve the Monte Carlo description of the complete final state produced in pp collisions.
Acknowledgements
We wish to thank CERN for the efficient commissioning and operation of the LHC during this initial high-energy data-taking period as well as the support staff from our institutions without whom ATLAS could not be operated efficiently.
We acknowledge the support of ANPCyT, Argentina; YerPhI, Armenia; ARC, Australia; BMWF, Austria; ANAS, Azerbaijan; SSTC, Belarus; CNPq and FAPESP, Brazil; NSERC, NRC and CFI, Canada; CERN; CONICYT, Chile; CAS, MOST and NSFC, China; COLCIENCIAS, Colom-bia; MSMT CR, MPO CR and VSC CR, Czech Repub-lic; DNRF, DNSRC and Lundbeck Foundation, Denmark; ARTEMIS, European Union; IN2P3-CNRS,
CEA-DSM/IRFU, France; GNAS, Georgia; BMBF, DFG, HGF, MPG and AvH Foundation, Germany; GSRT, Greece; ISF, MINERVA, GIF, DIP and Benoziyo Center, Israel;
INFN, Italy; MEXT and JSPS, Japan; CNRST, Morocco; FOM and NWO, Netherlands; RCN, Norway; MNiSW, Poland; GRICES and FCT, Portugal; MERYS (MECTS), Romania; MES of Russia and ROSATOM, Russian Fed-eration; JINR; MSTD, Serbia; MSSR, Slovakia; ARRS and MVZT, Slovenia; DST/NRF, South Africa; MICINN, Spain; SRC and Wallenberg Foundation, Sweden; SER, SNSF and Cantons of Bern and Geneva, Switzerland; NSC, Taiwan; TAEK, Turkey; STFC, the Royal Society and Leverhulme Trust, United Kingdom; DOE and NSF, United States of America.
The crucial computing support from all WLCG part-ners is acknowledged gratefully, in particular from CERN and the ATLAS Tier-1 facilities at TRIUMF (Canada), NDGF (Denmark, Norway, Sweden), CC-IN2P3 (France), KIT/GridKA (Germany), INFN-CNAF (Italy), NL-T1 (Netherlands), PIC (Spain), ASGC (Taiwan), RAL (UK) and BNL (USA) and in the Tier-2 facilities worldwide.
References
1. R. Field, Acta Phys. Pol. B 36, 167 (2005).
2. The CDF Collaboration, T. Aaltonen, et al., Phys. Rev. D 70, 072002 (2004).
3. The CDF Collaboration, T. Aaltonen, et al., Phys. Rev. D 82, 034001 (2010).
4. The CMS Collaboration, V. Khachatryan, et al.,
5. The ATLAS Collaboration, Phys. Rev. D (in press) (2010). 6. The ATLAS Collaboration, JINST 3, S08003 (2008).
7. The ATLAS Collaboration,
ATLAS-LARG-PUB-2008-002 (2008).
8. The ATLAS Collaboration,
ATLAS-LARG-PUB-2009-001 (2008).
9. B. Andrieu, et al., Nucl. Instrum. Meth.
A 386, 348 (1997).
10. E. Abat, E. Arik, S. Cetin, J. Abdallah, M. Bosman, et al., Nucl. Instrum. Meth. A 607, 372 (2009).
11. P. Adragna, C. Alexa, K. Anderson, A. Antonaki, A. Ara-bidze, et al., Nucl. Instrum. Meth. A 606, 362 (2009). 12. M. Aharrouche, C. Adam-Bourdarios, M. Aleksa, D. Banfi,
D. Benchekroun, et al., Nucl. Instrum. Meth.
A 614, 400 (2010).
13. The ATLAS Collaboration, Eur. Phys. J.
C 70, 723 (2010).
14. The ATLAS Collaboration, Eur. Phys. J.
C 70, 1193 (2010).
15. The ATLAS Collaboration, Phys. Lett. B 688, 21 (2010).
16. The ATLAS Collaboration,
ATLAS-CONF-2010-069 (2010).
17. T. Sjostrand, S. Mrenna, P. Z. Skands, JHEP
05, 026 (2006).
18. The ATLAS Collaboration,
ATLAS-PHYS-PUB-2010-002 (2010).
19. A. Sherstnev, R. S. Thorne, Eur. Phys. J.
C 55, 553 (2008).
20. B. Andersson, G. Gustafson, G. Ingelman, T. Sjostrand, Phys. Rept. 97, 31 (1983).
21. The CDF Collaboration, F. Abe, et al., Phys. Rev. Lett. 61, 1819 (1988).
22. P. Z. Skands (2009). Presented at Multi-Parton Interaction Workshop, Perugia, Italy, 28-31 Oct 2008. Published in Perugia 2008, Multiple Partonic Interactions at the LHC (MPI08) p.284.
23. R. Field, MinBias and the Underlying Event at the Teva-tron and the LHC, A talk presented at the Fermilab mc tuning workshop, Technical Report, FERMILAB, 2002.
24. R. Engel, J. Ranft, Nucl. Phys. Proc. Suppl.
A 75, 272 (1999).
25. G. Corcella, et al., JHEP 01, 010 (2001).
26. G. Corcella, et al., HERWIG 6.5 release note.
ArXiv:0210213, 2002.
27. J. M. Butterworth, J. R. Forshaw, M. H. Seymour, Z. Phys. C 72, 637 (1996).
28. The ATLAS Collaboration, Nucl. Phys. Proc. Suppl.
197, 254 (2009).
29. S. Agostinelli, et al., Nucl. Instr. Meth. A 506, 250 (2003).
30. The ATLAS Collaboration,
ATLAS-CONF-2010-052 (2010).
31. The ATLAS Collaboration,
ATLAS-CONF-2010-017 (2010).
32. The ATLAS Collaboration,
ATLAS-CONF-2010-053 (2010).
33. M. Cacciari, G. P. Salam, G. Soyez, JHEP 04, 063 (2008).
34. UA1 Collaboration, C. Albajar, et al., Nucl. Phys.
B 309, 405 (1988).
The ATLAS Collaboration
G. Aad48, B. Abbott111, J. Abdallah11,A.A. Abdelalim49, A. Abdesselam118, O. Abdinov10, B. Abi112, M. Abolins88, H. Abramowicz153,
H. Abreu115, E. Acerbi89a,89b, B.S. Acharya164a,164b, D.L. Adams24, T.N. Addy56, J. Adelman175,
M. Aderholz99, S. Adomeit98, P. Adragna75, T. Adye129, S. Aefsky22, J.A. Aguilar-Saavedra124b,a,
M. Aharrouche81, S.P. Ahlen21, F. Ahles48, A. Ahmad148, M. Ahsan40, G. Aielli133a,133b, T. Akdogan18a, T.P.A. ˚Akesson79, G. Akimoto155, A.V. Akimov 94, M.S. Alam1, M.A. Alam76, S. Albrand55, M. Aleksa29, I.N. Aleksandrov65, M. Aleppo89a,89b, F. Alessandria89a, C. Alexa25a, G. Alexander153, G. Alexandre49, T. Alexopoulos9, M. Alhroob20, M. Aliev15, G. Alimonti89a, J. Alison120, M. Aliyev10, P.P. Allport73, S.E. Allwood-Spiers53, J. Almond82, A. Aloisio102a,102b, R. Alon171, A. Alonso79, M.G. Alviggi102a,102b, K. Amako66, P. Amaral29, C. Amelung22, V.V. Ammosov128, A. Amorim124a,b, G. Amor´os167, N. Amram153, C. Anastopoulos139, T. Andeen34, C.F. Anders20, K.J. Anderson30, A. Andreazza89a,89b, V. Andrei58a, M-L. Andrieux55, X.S. Anduaga70, A. Angerami34, F. Anghinolfi29, N. Anjos124a, A. Annovi47, A. Antonaki8, M. Antonelli47, S. Antonelli19a,19b, J. Antos144b, F. Anulli132a, S. Aoun83, L. Aperio Bella4, R. Apolle118, G. Arabidze88, I. Aracena143, Y. Arai66, A.T.H. Arce44, J.P. Archambault28, S. Arfaoui29,c, J-F. Arguin14, E. Arik18a,∗, M. Arik18a,
A.J. Armbruster87, O. Arnaez81, C. Arnault115, A. Artamonov95, G. Artoni132a,132b, D. Arutinov20, S. Asai155, R. Asfandiyarov172, S. Ask27,
B. ˚Asman146a,146b, L. Asquith5, K. Assamagan24, A. Astbury169, A. Astvatsatourov52, G. Atoian175, B. Aubert4, B. Auerbach175, E. Auge115, K. Augsten127, M. Aurousseau4, N. Austin73, R. Avramidou9,
D. Axen168, C. Ay54, G. Azuelos93,d, Y. Azuma155, M.A. Baak29, G. Baccaglioni89a, C. Bacci134a,134b, A.M. Bach14, H. Bachacou136, K. Bachas29, G. Bachy29, M. Backes49, M. Backhaus20, E. Badescu25a,
P. Bagnaia132a,132b, S. Bahinipati2, Y. Bai32a, D.C. Bailey158, T. Bain158, J.T. Baines129, O.K. Baker175, M.D. Baker24, S. Baker77, F. Baltasar Dos Santos Pedrosa29, E. Banas38, P. Banerjee93, Sw. Banerjee169, D. Banfi29,
A. Bangert137, V. Bansal169, H.S. Bansil17, L. Barak171, S.P. Baranov94, A. Barashkou65, A. Barbaro Galtieri14, T. Barber27, E.L. Barberio86, D. Barberis50a,50b, M. Barbero20, D.Y. Bardin65, T. Barillari99, M. Barisonzi174, T. Barklow143, N. Barlow27, B.M. Barnett129, R.M. Barnett14, A. Baroncelli134a, A.J. Barr118, F. Barreiro80, J. Barreiro Guimar˜aes da Costa57, P. Barrillon115, R. Bartoldus143, A.E. Barton71, D. Bartsch20, R.L. Bates53, L. Batkova144a,
J.R. Batley27, A. Battaglia16, M. Battistin29, G. Battistoni89a, F. Bauer136, H.S. Bawa143,e, B. Beare158, T. Beau78, P.H. Beauchemin118, R. Beccherle50a, P. Bechtle41, H.P. Beck16,
M. Beckingham48, K.H. Becks174, A.J. Beddall18c, A. Beddall18c, V.A. Bednyakov65, C. Bee83, M. Begel24, S. Behar Harpaz152, P.K. Behera63, M. Beimforde99, C. Belanger-Champagne166, P.J. Bell49, W.H. Bell49, G. Bella153, L. Bellagamba19a, F. Bellina29,
G. Bellomo89a,89b, M. Bellomo119a, A. Belloni57, O. Beloborodova107, K. Belotskiy96, O. Beltramello29, S. Ben Ami152, O. Benary153, D. Benchekroun135a, C. Benchouk83, M. Bendel81, B.H. Benedict163, N. Benekos165, Y. Benhammou153, D.P. Benjamin44, M. Benoit115, J.R. Bensinger22, K. Benslama130, S. Bentvelsen105, D. Berge29, E. Bergeaas Kuutmann41, N. Berger4, F. Berghaus169, E. Berglund49, J. Beringer14, K. Bernardet83, P. Bernat77, R. Bernhard48,
C. Bernius24, T. Berry76, A. Bertin19a,19b,
F. Bertinelli29, F. Bertolucci122a,122b, M.I. Besana89a,89b, N. Besson136, S. Bethke99, W. Bhimji45, R.M. Bianchi29, M. Bianco72a,72b, O. Biebel98, S.P. Bieniek77,
J. Biesiada14, M. Biglietti132a,132b, H. Bilokon47, M. Bindi19a,19b, S. Binet115, A. Bingul18c, C. Bini132a,132b, C. Biscarat177, U. Bitenc48, K.M. Black21, R.E. Blair5, J.-B. Blanchard115,
G. Blanchot29, C. Blocker22, J. Blocki38, A. Blondel49, W. Blum81, U. Blumenschein54, G.J. Bobbink105, V.B. Bobrovnikov107, A. Bocci44, C.R. Boddy118, M. Boehler41, J. Boek174, N. Boelaert35, S. B¨oser77, J.A. Bogaerts29, A. Bogdanchikov107, A. Bogouch90,∗, C. Bohm146a, V. Boisvert76, T. Bold163,f, V. Boldea25a, M. Bona75, V.G. Bondarenko96, M. Boonekamp136, G. Boorman76, C.N. Booth139, P. Booth139,
S. Bordoni78, C. Borer16, A. Borisov128, G. Borissov71, I. Borjanovic12a, S. Borroni132a,132b, K. Bos105, D. Boscherini19a, M. Bosman11, H. Boterenbrood105, D. Botterill129, J. Bouchami93, J. Boudreau123, E.V. Bouhova-Thacker71, C. Boulahouache123,
C. Bourdarios115, N. Bousson83, A. Boveia30, J. Boyd29, I.R. Boyko65, N.I. Bozhko128, I. Bozovic-Jelisavcic12b, J. Bracinik17, A. Braem29, E. Brambilla72a,72b, P. Branchini134a, G.W. Brandenburg57, A. Brandt7, G. Brandt15, O. Brandt54, U. Bratzler156, B. Brau84, J.E. Brau114, H.M. Braun174, B. Brelier158, J. Bremer29, R. Brenner166, S. Bressler152, D. Breton115,
N.D. Brett118, P.G. Bright-Thomas17, D. Britton53, F.M. Brochu27, I. Brock20, R. Brock88, T.J. Brodbeck71, E. Brodet153, F. Broggi89a, C. Bromberg88,
G. Brooijmans34, W.K. Brooks31b, G. Brown82, E. Brubaker30, P.A. Bruckman de Renstrom38, D. Bruncko144b, R. Bruneliere48, S. Brunet61,
A. Bruni19a, G. Bruni19a, M. Bruschi19a, T. Buanes13, F. Bucci49, J. Buchanan118, N.J. Buchanan2,
P. Buchholz141, R.M. Buckingham118, A.G. Buckley45, S.I. Buda25a, I.A. Budagov65, B. Budick108,
V. B¨uscher81, L. Bugge117, D. Buira-Clark118, E.J. Buis105, O. Bulekov96, M. Bunse42, T. Buran117, H. Burckhart29, S. Burdin73, T. Burgess13, S. Burke129, E. Busato33, P. Bussey53, C.P. Buszello166, F. Butin29, B. Butler143, J.M. Butler21, C.M. Buttar53,
J.M. Butterworth77, W. Buttinger27, T. Byatt77,
S. Cabrera Urb´an167, M. Caccia89a,89b, D. Caforio19a,19b,
O. Cakir3a, P. Calafiura14, G. Calderini78, P. Calfayan98, R. Calkins106, L.P. Caloba23a, R. Caloi132a,132b,
D. Calvet33, S. Calvet33, R. Camacho Toro33, A. Camard78, P. Camarri133a,133b,
M. Cambiaghi119a,119b, D. Cameron117, J. Cammin20, S. Campana29, M. Campanelli77, V. Canale102a,102b, F. Canelli30, A. Canepa159a, J. Cantero80,
L. Capasso102a,102b, M.D.M. Capeans Garrido29, I. Caprini25a, M. Caprini25a, D. Capriotti99, M. Capua36a,36b, R. Caputo148, C. Caramarcu25a, R. Cardarelli133a, T. Carli29, G. Carlino102a, L. Carminati89a,89b, B. Caron159a, S. Caron48, C. Carpentieri48, G.D. Carrillo Montoya172, A.A. Carter75, J.R. Carter27, J. Carvalho124a,g, D. Casadei108, M.P. Casado11, M. Cascella122a,122b, C. Caso50a,50b,∗, A.M. Castaneda Hernandez172, E. Castaneda-Miranda172, V. Castillo Gimenez167, N.F. Castro124a, G. Cataldi72a, F. Cataneo29, A. Catinaccio29, J.R. Catmore71, A. Cattai29, G. Cattani133a,133b, S. Caughron88, D. Cauz164a,164c, A. Cavallari132a,132b, P. Cavalleri78, D. Cavalli89a, M. Cavalli-Sforza11, V. Cavasinni122a,122b,
A. Cazzato72a,72b, F. Ceradini134a,134b,
A.S. Cerqueira23a, A. Cerri29, L. Cerrito75, F. Cerutti47, S.A. Cetin18b, F. Cevenini102a,102b, A. Chafaq135a, D. Chakraborty106, K. Chan2, B. Chapleau85, J.D. Chapman27, J.W. Chapman87, E. Chareyre78, D.G. Charlton17, V. Chavda82, S. Cheatham71, S. Chekanov5, S.V. Chekulaev159a, G.A. Chelkov65, H. Chen24, L. Chen2, S. Chen32c, T. Chen32c, X. Chen172, S. Cheng32a, A. Cheplakov65, V.F. Chepurnov65, R. Cherkaoui El Moursli135d, V. Chernyatin24, E. Cheu6, S.L. Cheung158,
L. Chevalier136, F. Chevallier136, G. Chiefari102a,102b, L. Chikovani51, J.T. Childers58a, A. Chilingarov71, G. Chiodini72a, M.V. Chizhov65, G. Choudalakis30, S. Chouridou137, I.A. Christidi77, A. Christov48, D. Chromek-Burckhart29, M.L. Chu151, J. Chudoba125, G. Ciapetti132a,132b, K. Ciba37, A.K. Ciftci3a,
R. Ciftci3a, D. Cinca33, V. Cindro74, M.D. Ciobotaru163, C. Ciocca19a,19b, A. Ciocio14, M. Cirilli87,
M. Ciubancan25a, A. Clark49, P.J. Clark45, W. Cleland123, J.C. Clemens83, B. Clement55, C. Clement146a,146b, R.W. Clifft129, Y. Coadou83, M. Cobal164a,164c, A. Coccaro50a,50b, J. Cochran64, P. Coe118, J.G. Cogan143, J. Coggeshall165, E. Cogneras177, C.D. Cojocaru28, J. Colas4, A.P. Colijn105, C. Collard115, N.J. Collins17, C. Collins-Tooth53, J. Collot55, G. Colon84,
R. Coluccia72a,72b, G. Comune88, P. Conde Mui˜no124a, E. Coniavitis118, M.C. Conidi11, M. Consonni104, S. Constantinescu25a, C. Conta119a,119b,
F. Conventi102a,h, J. Cook29, M. Cooke14, B.D. Cooper77, A.M. Cooper-Sarkar118,
N.J. Cooper-Smith76, K. Copic34, T. Cornelissen50a,50b, M. Corradi19a, F. Corriveau85,i, A. Cortes-Gonzalez165, G. Cortiana99, G. Costa89a, M.J. Costa167,
D. Costanzo139, T. Costin30, D. Cˆot´e29,