HAL Id: hal-02903368
https://hal.archives-ouvertes.fr/hal-02903368
Submitted on 26 Oct 2020
HAL is a multi-disciplinary open access
archive for the deposit and dissemination of
sci-entific research documents, whether they are
pub-lished or not. The documents may come from
teaching and research institutions in France or
abroad, or from public or private research centers.
L’archive ouverte pluridisciplinaire HAL, est
destinée au dépôt et à la diffusion de documents
scientifiques de niveau recherche, publiés ou non,
émanant des établissements d’enseignement et de
recherche français ou étrangers, des laboratoires
publics ou privés.
derived from space-borne burned area products
Pierre Laurent, Florent Mouillot, Chao Yue, Philippe Ciais, M. Vanesa
Moreno, Joana Nogueira
To cite this version:
Pierre Laurent, Florent Mouillot, Chao Yue, Philippe Ciais, M. Vanesa Moreno, et al.. FRY, a global
database of fire patch functional traits derived from space-borne burned area products. Scientific Data
, Nature Publishing Group, 2018, 5 (1), �10.1038/sdata.2018.132�. �hal-02903368�
Data Descriptor:
FRY, a global
database of
fire patch functional
traits derived from space-borne
burned area products
Pierre Laurent1, Florent Mouillot2, Chao Yue1, Philippe Ciais1, M. Vanesa Moreno2 & Joana M. P. Nogueira3
Vegetationfires are intrinsic ecosystem disturbances of the Earth system. Global burned area products have
been delivered from several space-borne instruments, and have recently provided pixel-level information
underpinningfire spread processes. Here we present FRY, a global database of fire patches with
morphology-based functional traits reconstructed from pixel-based burned areas derived from the MODIS
and MERIS imagery using aflood-fill algorithm. Each fire patch is characterized by the geo-location of its
center, area, perimeter, the features of the ellipsefitted over its pixel’s spatial distribution, and different
indices of patch complexity. We obtained a consistent spatial distribution of globalfire patch functional
traits between the MCD64A1 Collection 6 and the MERIS fire_cci v4.1 datasets during their overlap period (2005-2011), confirming the robustness of the applied algorithm and the consistency between both
products. This database is relevant to a broad spectrum offire-related applications such as local to global
functional pyrodiversity,fire emissions quantification, and the benchmarking of fire modules embedded in
dynamic global vegetation models.
Design Type(s) data integration objective • source-based data analysis objective • image analysis objective
Measurement Type(s) landfire Technology Type(s) image analysis Factor Type(s) spatiotemporal_interval Sample Characteristic(s) Earth (Planet)
1Laboratoire des Sciences du Climat et de l'Environnement, CEA-CNRS-UVSQ, UMR8212 Gif-sur-Yvette, France. 2UMR CEFE5175, Centre National de la Recherche Scientifique (CNRS), Université de Montpellier, Université
Paul-Valéry Montpellier, Ecole Pratique des Hautes Etudes (EPHE), Institut de Recherche pour le Développement (IRD), 1919 route de Mende, 34293 Montpellier CEDEX 5, France. 3National Institute for Space Research (INPE) Department of Meteorology, room14 Av. dos Astronautas, 1758, Jardim da Granja São José dos Campos State of São Paulo,12227-010 SP, Brazil. Correspondence and requests for materials should be addressed to P.L. (email: pierre.laurent@lsce.ipsl.fr) or to F.M. (email:florent.mouillot@cefe.cnrs.fr).
OPEN
Received:6 October 2017 Accepted:8 May 2018 Published:10 July 2018
Background & Summary
Vegetation fires play an important role in the Earth system. They affect vegetation dynamics through biomass burning and post-fire recovery1, thus significantly impacting the terrestrial carbon cycle2
. Gaseous and particulate matter emissions from vegetationfires, including CO2, methane, NOx and black carbon3, alter atmospheric radiative forcing and in turn the climate. Fire processes and the associated impacts on vegetation are therefore included in Dynamic Global Vegetation Models (DGVM)4, which are used to predict futurefire activities and vegetation dynamics5. Understandingfire processes at a global scale contributes to properly representing biosphere–atmosphere interactions and reliably predicting future climate change and carbon cycle dynamics. Fires, of course, also have strong local economic and health consequences on the human population6,7.
Global burned area (BA) products, derived from remote sensing and available since the 2000s, are widely used in various applications given their acknowledged spatial and temporal consistency, and global coverage8–10. Remote sensing offers the possibility to mapfire-affected areas across the globe, with moderate resolution sensors and frequent revisit time, like the Medium Resolution Imaging Spectrometer (MERIS), or the Moderate-Resolution Imaging Spectroradiometer (MODIS). The reliability of BA retrieval is affected by the quality of input data (through spatial and spectral resolution, and atmospheric correction of the sensor images), the algorithms processing surface reflectance information, and other background observing conditions such as land cover type and cloudiness. Furthermore, the spatial accuracy of BA is critically limited by the spatial resolution of the sensors. Despite these limitations, global satellite data products allow for continuous, frequent and global coverage of burned areas, and are suitable for a systematic analysis offire dynamics over the globe.
Globalfire patch data derived from pixel-level BA information have recently emerged as an important source of information for climate, vegetation and carbon cycle modeling. They are used to capture the key role of driving factors that influence burn area11
and benchmarkfire module in DGVMs4. Process-based fire modules in DGVMs simulate BA as the product of the number of ignitions multiplied by the simulated mean spreading area of a typical fire patch12–14, and the results of these models can be compared to global BA products. But this is a less rigorous way to calibrate fire models than a direct comparison between observed and simulatedfire patch area, since it is unknown whether a discrepancy between the simulated and observed BA results from differences in the ignition pattern or missing processes in fire propagation. While global or local pyrogeographical analyses could derive significant information from fire patches15–17, only a few modeling studies have tried to benchmark fire-DGVM uponfire size distribution14based on localfire patch datasets. In addition to fire patch size distribution, fire patch complexity is another piece of information needed to capture the spreading conditions during fire events. The resulting complexity of fire boundaries also affects post-fire recovery rate in forested area, since it is found that remaining islands of living vegetation18,19can accelerate the recolonization process after a fire. Fire patch size is closely linked to meteorological, fuel continuity and topographical20 conditions and can modify carbon emissions according to fire observations in Alaskan boreal forests21. Pyrodiversity22, which describes the diversity offire types in a given fire regime, is a promising approach to investigate continental and global spatio-temporal variations infire spreading processes, recurrence or rarity of events and their drivers. This newfield of research in fire science resembles the emerging topic of functional biogeography23, where the functioning of biomes is assessed from the assemblage of continuous functional traits rather than species composition and relies on databases of plant traits24,25. Similarly, global databases of fire patch morphological features (or traits) that reflect the underlying spreading processes could be used to explore functional pyrogeography as an analytical and modeling framework. Fire regimes could be more precisely described and modeled with an assemblage offire traits, rather than simple burned area.
This paper presents FRY, a global database offire patch functional traits that includes patch areas and other morphological features derived from burned areas of the MODIS and MERIS sensors. We first describe the algorithm known asflood-fill26that we use to group individual burned pixels with a burn date intofire patches, defined as groups of adjacent pixels with temporal coincidence parameterized by a temporal cut-off value (section Methods). We extensively compared the functional traits of individualfire patches obtained from the two sensors (section Technical validation), and thoroughly investigated the influence of the cut-off parameter on the measured fire patch functional traits. We concluded that increasing the cut-off value yields larger, longer, and correlatively more complex fire patches without changing the global spatial pattern of the different metrics. Moreover, we showed that the main source of uncertainties onfire patch traits arises from the difference between the two BA products rather than the choice of the cut-off value.
Methods
Original burned area input data
The MCD64A1 Collection 6 BA product27is derived from the MODIS sensors onboard the Aqua and Terra satellites. The Terra satellite has a morning overpass time (10h30am), and the Aqua satellite has an afternoon (1h30pm) overpass time. It provides global coverage of burned area with daily revisit at the equator at a resolution of 463x463m over the period 2000-2017. The MCD64A1 Collection 6 algorithm detects BA from daily changes with a burn-sensitive vegetation index computed from the difference between channels 5 and 7 of the spectrometer (corresponding to infrared light) and combined with
MODIS active fire observations to discriminate unburned from burned pixels. A burn date, with its uncertainty, is then attributed to each detected burned pixel27. The MERISfire_cci v4.1 BA product is delivered by the European Space Agency Climate Change Initiative Fire Disturbance project (ESA Fire CCI, https://www.esa-fire-cci.org/) using the ENVISAT-MERIS sensor with a resolution of 300x300m and a 10am time of overpass, and covers the period 2005-2011 with a 3-day revisit frequency at the equator. The MERISfire_cci v4.1 burned area detection algorithm first combines the difference between the measured reflectance in the near-infrared (band 10) and the reflectance in the red (band 8) from the MERIS sensor with activefire observations from MODIS28. In a second step, the algorithm uses MERIS reflectance information to grow fire patches from the seed pixels identified during the first step. The final product provides global coverage of burned area every three days (at the equator) from 2005 to 2011 (refs 29,30). Both MCD64A1 Collection 6 and MERIS fire_cci v4.1 datasets are available in separated GeoTIFF tiles, providing the burn date of each burned pixel. Using both datasets allows for comparison of fire patch functional traits calculated from BA. The two burned area products have different advantages, namely a finer spatial resolution for MERIS fire_cci v4.1, and a smaller temporal resolution and longer time series for MCD64A1.
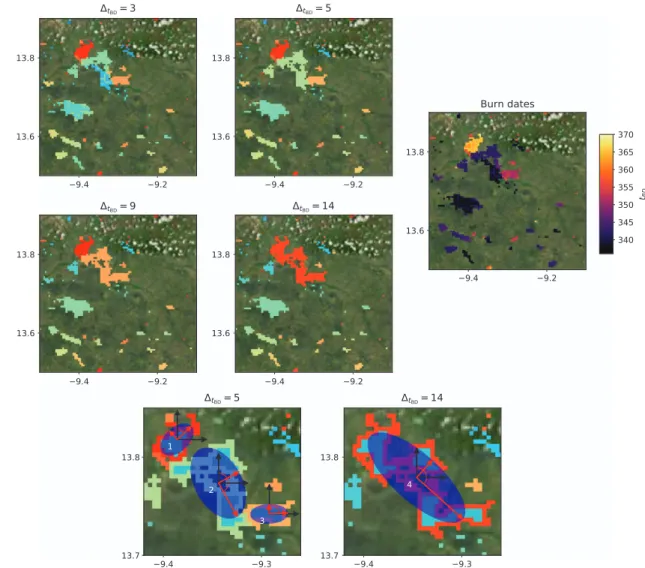
Figure 1. Example offire patch reconstruction. Figures (a) to (d) show the fire patches calculated from individual adjacent burned pixels, with temporal coincidence being defined by a temporal cut-off value of 3, 5, 9 and 14, for the MCD64A1 product in a region of northern hemisphere Africa. Continuous areas with the
same color indicate the samefire patch. Figure (e) shows the burn dates of the pixels (in days). Figures (f) and
(g) show examples of Standard Deviation Ellipses (SDE, dark blue) for threefire patches with cut-off of 5
(zoomed portion of b) and one patch with cut-off of 14 (zoomed portion of d). The half-axes (σXandσy) and
the azimuthal (θ) angle are displayed in red. The so-called core areas (Acore, Table 1), corresponding to the area
of pixels totally surrounded by other burned pixels in a given patch, are displayed in light blue for the four
Construction offire patches by aggregating neighboring/burned pixels
Here,fire patches were constructed using the ‘flood-fill’ algorithm which aggregates neighboring burned pixels with sequential burn dates into individualfire patches. An important parameter of the algorithm is the cut-off value, defined as the maximum burn date difference between two neighboring pixels considered belonging to the samefire event. The value of this cut-off parameter has an influence on the size of the reconstructed patches, which can differ depending on land cover type and cloudiness at satellite overpass31. It is therefore important to test different cut-off values and to analyze their effects on fire patch size distribution and fire morphology. For both MERIS fire_cci v4.1 and MCD64A1 products, fire patches were processed with four different cut-off values of 3, 5, 9 and 14 days. These values were chosen as the possible time lapse between two detected neighboring burned pixels belonging to the same fire event considering uncertainties, so they span the majority of cut-off values used in previous studies17,26,32.
The flood-fill algorithm processing daily global burned area data were implemented using the R CRAN package ‘raster’. To optimize the processing time, we made use of the ‘clump’ function which allows pixels of burned areas to be efficiently combined into clumps, defined here as a group of neighboring pixels (in a so-called queen scheme). Working directly at the clump level was more efficient than working at the pixel level and enabled the use of parallelized features of the ‘raster’ package. The algorithm proceeded as follows.
A burn date tbdwas identified in the BA product, and only the pixels within the time span tbdo t o tbd+Δtcowere selected, whereΔtcois the cut-off parameter. The clump routine from the R-CRAN raster package was applied to these pixels to attribute a unique ID number to each clump, defined as a group of burned pixels totally isolated by unburned pixels during the considered cut-off dependent time span. We performed the same two previous steps for the next burn date (tbd+ 1). When a new clump overlapped with one or more clumps from the previous step, these clumps were considered to belong to the same patch and therefore were merged. For every month, the latitude/longitude coordinates, IDs and burn dates of pixels belonging to a detectedfire patch were saved. This information was saved on a monthly time step rather than on a yearly time step since some pixels were susceptible to be detected as burned more than once per year. The resulting fire patches in the same 0.4 × 0.4º subregion for the four tested cut-off values, with the burn dates associated to the burned pixels, are displayed as an example of the flood-fill algorithm output (Fig. 1).
In order to parallelize the processing of BA into patches, we separated both MCD64A1 and MERIS fire_cci v4.1 products in 3.5 × 3.5º tiles. To avoid splitting a fire patch that overlaps two tiles, all tile
Patch ID ID number of thefire patch Npixels Total number of burned pixels
Ncore pixels Number of core burned pixels
A Area of thefire patch (ha) Acore Core area of thefire patch (ha)
P Perimeter of thefire patch (pixel sides) P.A.R. Perimeter to Area Ratio (= P/Npixels)
S.I. Shape Index (= 0.25*P/(Npixels)0.5)
D2 Fractal Correlation Dimension (= 2*ln(0.25*P)/ln(Npixels))
C.A. Core Area index (= Acore/A)
X Longitudinal coordinate of thefire patch center (deg) Y Latitudinal coordinate of thefire patch center (deg) σX Small half axis of the SDE (deg)
σy Big half axis of the SDE (deg)
θ Rotation angle of the ellipse (in lat/long coordinates). Corresponds to the angle between north andσY,(deg)
σX,km Small half axis of the SDE (km)
σY,km Big half axis of the SDE (km)
θkm Rotation angle of the ellipse (inflat projection). Corresponds to the angle between north and σY,km(deg)
RSDE Ellipse Ratio (= σX,km/σY,km,0o RSDEo 1)
ESDE Ellipse Eccentricity (= (1 – min(σX,km,σY,km)2/max(σX,km,σY,km)2))0.5)
BDmin Minimum pixel burn date of thefire patch
BDmax Maximum pixel burn date of thefire patch
BDmean Mean value of pixel burn date of thefire patch
Year Year associated with Mean_BD
borders overlapped with neighboring tiles with a width of 0.5º. We attributed to a given tile all fire patches whose centers were within the central 2.5 × 2.5º area, to avoid double counting.
Calculation offire patch functional traits
From the monthly patches described above, we used the R CRAN package ‘SDMtools’ (Species Distribution Modeling Tools) to compute allfire patch functional traits including morphological features and spatio-temporal information32 (Table 1). The perimeter (P), the total number of burned pixels (Npixels) and the number of core burned pixels (Ncore pixels) were computed for each patch, where a core burned pixel is defined as a pixel which is totally surrounded by other burned pixels. These three quantities were computed in pixel units. The corresponding patch areas (in hectares) were also computed (A for Npixels, and Acorefor Ncore pixels). Traits that describe thefire patch complexity are the Perimeter to Area Ratio P.A.R. (= P/Npixels), the Shape Index S.I. (= 0.25*P/(Npixels)0.5), the Fractal Correlation Dimension D2(= 2*ln(0.25*P)/ln(Npixels)) and the Core Area Index C.A. (= Acore/A). We also provided the minimum and maximum burn date (i.e., corresponding to the date of the first and last detected burned pixel of thefire patch), the mean burn date of the pixels belonging to the same fire patch and the year corresponding to the mean burn date of thefire patch.
The Standard Deviation Ellipse (SDE) was calculated from the spatial coordinates of the burned pixels composing eachfire patch, simplifying its geometry to a fitted ellipse by determining the elongation and directional azimuthal angle of thefire patch (Fig. 1). Ellipses are commonly used to simulate theoretical fire patches in most DGVM, for example following the Rothermel equation for fire propagation to compute the ellipse axes33,34. The R CRAN package‘aspace’35was used to compute the center position of the SDE (X and Y), its azimuthal angle (θ), and the minor and major half-axes (σXandσY) of thefitted ellipse to each patch (Table 1). The ellipse half-axes and azimuthal angle, initially computed in latitude/ longitude coordinates in degrees, were also computed after projecting the fire patch in a local flat projection (σX,kmandσY,km, in kilometers, andθkm). The eccentricity (ESDE) and ratio of half-axes of the ellipse (RSDE) were also computed. As an example, the values of these different metrics are provided for the patches highlighted in Fig. 1 (Table 2).
Thefire patch functional traits were only computed for patches composed of at least 5 burned pixels. This arbitrary threshold allowed us to lighten the databasefiles by removing very small fire patches with unreliable information about the fire patch complexity or orientation.
Global maps of fire patch functional traits and power law size distribution
Previous studies tried to explain fire patch size distribution with Self-Organized Criticality (SOC)36,37. SOC models predict that the distribution offire patch size follows a power law:
Nf ¼ α:Af- β
Patch Fire patch 1 Fire patch 2 Fire patch 3 Fire patch 4
Npixels 63 171 49 295 Ncore pixels 21 51 16 99 A (ha) 146.40 397,44 113.90 685.6 Acore(ha) 48.80 118.53 37.19 230.1 P 52 136 42 220 P.A.R. 0.825 0.795 0.857 0.746 S.I. 1.625 2.51 1.5 3.14 D2 1.24 1.37 1.21 1.41 C.A. 0.33 0.30 0.33 0.40 X (deg) − 9.39 − 9.34 − 9.29 − 9.34 Y (deg) 13.82 13.77 13.74 13.78 σX(deg) 0.012 0.024 0.009 0.024 σY(deg) 0.020 0.039 0.019 0.063 σX,km(km) 1.31 2.57 1.03 2.60 σY,km(km) 2.15 4.30 2.07 6.90 RSDE 0.61 0.60 0.51 0.38 ESDE 0.79 0.80 0.85 0.93 θ (deg) 46.5 150.6 87.1 131.9
Table 2. Values of the different functional traits for the four patches shown in Fig. 1f,g.The selected fire patches are annotated by their corresponding numbers in Fig. 1f,g.
Where Af is the area of the fire patch, Nf is the number of fire patches of a given size Af, α is a normalization constant andβ is the exponent of the power law. SOC models usually assume a constant value of β, but a number of analyses have detected significant variations of this parameter at a global scale17,38. Theβ parameter provides information on asymmetry in the fire patch size distribution. A value β = 0 tells us that the number of large fire patches is equal to the number of small fire patches per bin unit; when β increases, the frequency of small fire patches increases with respect to large ones. This parameter can be used as an index to investigate potential differences between different burned area products and to test the sensitivity ofβ to different patch reconstruction methods.
We fitted the parameter β to the distribution of fire patches in 1º × 1º grid cells covering the entire globe during the periods 2005-2011 for MCD64A1 and MERIS fire_cci v4.1. For each cell, we proceeded as follows: first, we produced the profile histogram of Nf and Af, defined as the normalized number of fires Nf for different logarithmic bins of fire patch sizes. We attribute to each value of the profile histogram a Poisson uncertainty equal to the square root of the number of fire patches in each size bin. We then fitted the power law by using the Minuit minimization algorithm (https://seal.web.cern.ch/seal/snapshot/work-packages/mathlibs/minuit/) which provides an efficient way to minimizeχ2.
As a level 2 product, the maps ofβ and σβ, the standard deviation ofβ obtained from the fit (computed from theβ values at χ2± 1), are also provided because they assess the quality of the fit and allow inter-comparisons between the different datasets. We also produced maps of the mean values and standard deviation for the perimeter-to-area ratio, shape index, fractal correlation dimension, ellipse ratio and ellipse eccentricity, and maps of the number offire events within each grid cell.
Code availability
The R-CRAN ‘raster’ project.org/package=raster), ‘SDMTools’ (https://CRAN.R-project.org/package=SDMTools) and ‘aspace’ (https://CRAN.R-project.org/package=aspace) packages can be found on CRAN, the global repository of open-source packages for R.
Due to the heavy CPU resources required to create the FRY database, the full code has been designed to run on a specific cluster architecture, and providing it would be of limited interest. However, any user interested in creating another database from a pixel BA product can contact the corresponding author who can share snippets of the code and provide help in adapting the code to another architecture.
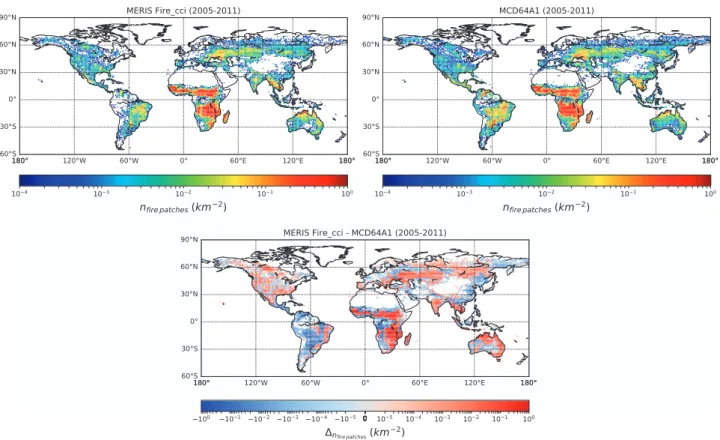
Figure 2. Fire patch density from thefire patch datasets for the years 2005-2011. (a) Fire patch density
calculated from the MERISfire_cci v4.1 BA product according to the algorithm described in the Methods
section, with a cut-off of 5 days (b) Same for the MCD64A1 BA product (c) Difference between MERISfire_cci
Data Records
The FRY database is organized in 8 datasets (2 burned area products for 4 cut-off values), which can be downloaded from the OSU-OREME repository. For each survey SURVEY (MERIS for MERIS fire_cci v4.1 or MODIS_6 for MCD64A1) and each cut-off value N (3, 5, 9 or 14), values for all traits listed in Table 1 are provided for each fire patch in Comma-Separated Format (csv) under the name fire_patches_SURVEY_final_co_N.csv (Data Citation 1). The names and order of the different fields are described in the header of each csvfile and in the meta-data associated with the repository.
The NetCDF maps of the parameters described at the end of the Methodology section for the survey SURVEY and the cut-off value N are provided under the name trait_map_SURVEY_1.0deg_co_N.nc (Data Citation 1). The NetCDFfiles are self-described.
Technical Validation
In this section, we compare fire patch functional traits between the MERIS fire_cci v4.1 and the MCD64A1 products for 2005-2011. Among the different traits listed in Table 1, we focus on the spatial distribution of the density of individual fire patches (Fig. 2), defined as the number of individual fire
Figure 3. β parameter from the fire patch datasets for the years 2005-2011. (a) β parameter calculated from
MERISfire_cci v4.1 BA product with a cut-off of 5 days (b) Same for MCD64A1 BA product (c) Uncertainty of
β for MERIS fire_cci v4.1 for the years 2005-2011 (d) Uncertainty of β for MCD64A1 (e) Difference between
MERISfire_cci v4.1 and MCD64A1 considering only patches with an area larger than 107 ha (f) Level of
patches per square kilometer, the slope of the patch size distribution (β parameter, Fig. 3), and the shape index (S.I., Fig. 4) as an indicator offire patch complexity. We display 1º ×1º grid maps of these three metrics for the MCD64A1 and MERISfire_cci v4.1 with a cut-off value of 5 days. We focused first on the 5 days cut-off value because it corresponds to an intermediate value of the considered cut-off range. We removed from the database allfire patches with less than 5 pixels (Methods section). The actual size of a 5-pixel fire patch in MCD64A1 is larger than a 5-pixel patch in MERIS fire_cci v4.1, and, for a given survey, larger at the equator than at high latitudes. In order to comparefire patches belonging to the same size category, we further removed from MERISfire_cci v4.1 and MCD64A1 all fire patches smaller than 107 ha, which corresponds to the size of a 5-pixelfire at the equator for a sensor with a 463 x 463m spatial resolution (i.e. the coarser resolution of the two sensors).
Fire patch density
The distribution offire patch density is similar between the two products with most of the individual fire patches detected in African tropical savannas, Northern Australia, central Eurasia, Brazilian Cerrado and South-Eastern Asia (Fig. 2). In these regions, MERIS fire_cci v4.1 detects more fire patches than MCD64A1. Conversely, MCD64A1 significantly detects more fires than MERIS fire_cci v4.1 in the other regions of Africa and South America. In total, for a cut-off value of 5, the MERISfire_cci v4.1 product detected over 2.35 million individualfire events larger than 107 ha, and the MCD64A1 product detected 2.49 million fires larger than 107 ha between the years 2005-2011. When including all detected fire patches (bigger and smaller than 107 ha) for the MERISfire_cci v4.1 patch data, the fire patch density of the product is larger in all regions. However, the MCD64A1 patch data still indicate morefires in the aforementioned regions. The differences in South America and South-Western Africa most probably arise from the lower number of available MERISfire_cci v4.1 images in these regions39. In boreal regions, the slight discrepancy between the two products is also found when comparing burned area30. The lower total number of detectedfire patches for MERIS fire_cci v4.1 could arise from missed seeds by the fire_cci algorithm. The 3-day time of overpass can lower the probability of matching burned pixels detected by MERIS imagery with activefire pixels from MODIS if there is a long delay between the two detections. This suggests that the temporal resolution of the sensors is an important parameter for detecting individualfire events when using a two-step algorithm to detect BA.
Slope of thefire patch size distributions (β)
The maps of thefitted β parameter for MCD64A1 and MERIS fire_cci v4.1 describing fire patch size distribution were computed with their uncertainties, the difference ofβ between the two products, and their degree of agreement in each cell (Fig. 3). The degree of agreement is measured in units of standard deviation (also noted σβ) and is equal to N if thefitted values of β for a given grid cell are compatible within N σβ for the two products. The spatial distribution of β is similar between the two fire patch datasets, with higher values in Africa, Eastern Europe (Ukraine and Western Russia) and South Eastern Asia, and lower values in northern Australia, Russia and North America. The uncertainty of the β parameter is intrinsically smaller than in regions with a large number of fire events. However, when computing the level of agreement between the products, there are discrepancies in the β parameter between the MERISfire_cci v4.1 and MCD64A1 derived fire patches products in Africa and in North-West Australia, where many cells do not match even within 5 sigmas. These regions correspond to the areas where MERISfire_cci v4.1 yields more fire patches than MCD64A1, and the power law is usually steeper for MERISfire_cci v4.1 (higher value of β) than for MCD64A1. Under the assumption that the probability of missing big fires is low in both BA products, this means that the MERIS fire_cci v4.1 product detects more smallfire patches in these regions with respect to MCD64A1 during the considered
Figure 4. Shape Index (S.I.) from thefire patch datasets for the years 2005-2011. (a) S.I. calculated from
time span. It should also be noted that we used Poisson uncertainties for thefit of the power law, which frequently underestimates the uncertainties. This underestimation could degrade the diagnosed level of agreement between the products. Except for these areas, the agreement is fair, with most cells matching within 2 sigmas.
Shape index (S.I.)
S.I. is systematically higher in the MERIS fire_cci v4.1 product (68% higher on average, Fig. 4). This relative difference does not vary much at global scale and can be explained by the higher spatial resolution of the MERIS sensor, which allows capturing more complex features of fire patches than MCD64A1. This difference can also be linked to the different algorithm used to reconstruct BA: the MERISfire_cci v4.1 algorithm contains a ‘growing’ phase which was especially designed to reconstruct accurate fire patch shapes. Within each product, S.I. is higher in boreal regions, Australia and South Eastern Asia.
The authors would like to remind potential users of the FRY database that the perimeter of thefire patches are computed from pixel data. All diagonal border lines (NW, NE, SE and SW directions) of the perimeters will appear as‘stair-step’ lines because of aliasing, and will therefore be biased upward with respect to the real fire patch perimeters. Since this bias depends on the spatial resolution of the pixel product, this renders difficult the direct comparison of the complexity indices between MERIS fire_cci v4.1 and MCD64A1. However, it is still possible to discriminate regions with more complexfire patches from regions with simplerfire patches for products with similar resolution.
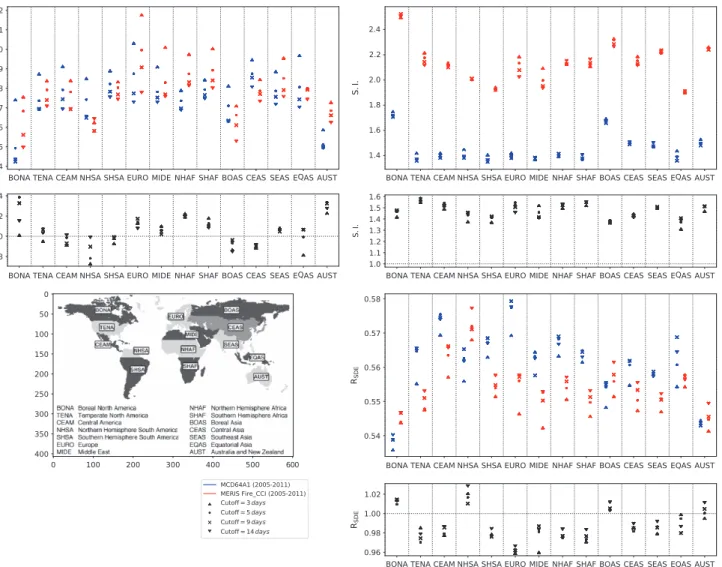
Figure 5. Median values ofβ parameter, shape index and ellipse ratio for different GFED regions. The
values are displayed for MERISfire_cci v4.1 and MCD64A1, and for the 4 different cut-off values. The bottom
plot displays the ratio of the median GFED values between the two products (MERISfire_cci v4.1 divided by
Sensitivity to varying the cut-off parameter on regional statistics offire patch functional traits
We next compare the values of β, S.I. and RSDEaveraged over the 14 Global Fire Emissions Database (GFED) regions for the 4 considered cut-off values (Fig. 5). To compute the average, the mean values in the 1º × 1º cells are weighted by their uncertainties. We also display the ratio of the average values obtained for MERISfire_cci v4.1 and MCD64A1. The cut-off value is arbitrarily chosen to reconstruct the fire patches. Here, we use the dispersion of the different cut-off values as a rough estimation of the uncertainty due to the arbitrary choice of the cut-off parameter value to reconstructfire patches.
The value of theβ parameter decreased as the cut-off value increased. Increasing the cut-off tends to group togetherfire patches which would have been separated with a lower cut-off. As a result, the number of small fires decreases and the number of large fires increases for increasing cut-off values (Fig. 1), resulting in a steeper power law for small cut-off values. If we consider the dispersion ofβ for the 4 tested cut-off values,β values are in agreement between the two products for a given cut-off value, except for Northern Hemisphere Africa (NHAF) and Australia (AUST). As mentioned above, the difference between the two products is emphasized by the underestimation of the uncertainty when performing the fit of the β parameter.
Increasing the cut-off value produces patches with a higher shape index, which corresponds to more complexfire patches. This effect is probably linked to the significant correlation between fire patch size and shape index (ρ = 0.405, p-val o 0.001, Fig. 6). Larger and longer fires can experience more variations in wind orientation while they burn, and are therefore susceptible to have a shape much
Figure 6. Profile histograms between different fire patch functional traits for a cut-off value of 5. The red
lines represent the weighted mean of the ordinate in different bins of the abscissa, and the error bars the standard deviation on the weighted mean. The error bars are sometimes not noticeable because they are smaller than the width of the line.
different from a simple ellipse. When comparing the average values of S.I. across the GFED regions, S.I. is higher in boreal regions for both products. This effect probably arises from the gridded BA pixel product: afire patch of a given size will be composed of more pixels in high latitudes than at the equator, which will result in an artificially more complex shape.
Higher cut-off values also yielded higher RSDE. As for the correlation between S.I. and patch size, we would expect longer and largerfires to propagate further and have more elongated ellipses than small fire patches. The correlation between A and RSDE was found to be close to zero, but there is a slight correlation between RSDEand core area (Fig. 6). This can be explained by the fact that the SDE is defined to contain 66% of the burned pixels of afire patch. A core area pixel has a higher probability to be located within the ellipse. RSDEis therefore more sensible to the core area than the total area of thefire patch. MCD64A1fire patches are slightly more elongated (~1-2%) than MERIS fire_cci v4.1, except for boreal regions and NHSA, whereas the MERIS fire_cci v4.1 product yields slightly higher ellipse ratio than MCD64A1.
References
1. Bond, W. J., Woodward, F. I. & Midgley, G. F. The global distribution of ecosystems in a world withoutfire. New Phytol. 165, 525–538 (2004).
2. Bond-Lamberty, B., Peckham, S. D., Ahl, D. E. & Gower, S. T. Fire as the dominant driver of central Canadian boreal forest carbon balance. Nature 450, 89–92 (2007).
3. van der Werf, G. R. et al. Globalfire emissions and the contribution of deforestation, savanna, forest, agricultural, and peat fires (1997–2009). Atm. Chem. and Phys 10, 11707–11735 (2010).
4. Hantson, S. et al. The status and challenge of globalfire modelling. Biogeosciences 13, 3359–3375 (2016).
5. Krause, A., Kloster, S., Wilkenskjeld, S. & Paeth, H. The sensitivity of global wildfires to simulated past, present and future lightning frequency. Journal of Geophysical Research: Biogeosciences 119(3) (2014).
6. Johnston, F. H. et al. Estimated Global Mortality Attributable to Smoke from Landscape Fires. Environ Health Perspect. 120, 695–701 (2012).
7. Moritz, M. A. et al. Learning to coexist with wildfire. Nature 515, 58–66 (2014).
8. Mouillot, F. et al. Ten years of global burned area products from spaceborne remote sensing—A review: Analysis of user needs and recommendations for future developments. Int. J. of Appl. Earth Obs. and Geoinf 26, 64–79 (2014).
9. Giglio, L., Loboda, T., Roy, D. P., Quayle, B. & Justice, C. O. An active-fire based burned area mapping algorithm for the MODIS sensor. Remote Sens. Environ. 113, 408–420 (2009).
10. Giglio, L., Randerson, J. T. & van der Werf, G. R. Analysis of daily, monthly, and annual burned area using the fourth-generation globalfire emissions database (GFED4): ANALYSIS OF BURNED AREA. J. Geophys. Res.: Biogeosciences 118, 317–328 (2013). 11. Bistinas, I., Harrison, S. P., Prentice, I. C. & Pereira, J. M. C. Causal relationships vs. emergent patterns in the global controls of
fire frequency. Biogeosciences Discuss 11, 3865–3892 (2014).
12. Thonicke, K. et al. The influence of vegetation, fire spread and fire behaviour on biomass burning and trace gas emissions: results from a process-based model. Biogeosciences 7, 1991–2011 (2010).
13. Rabin, S. S. et al. The Fire Modeling Intercomparison Project (FireMIP), phase 1: experimental and analytical protocols with detailed model descriptions. Geosci. Model Dev., 10, 1175–1197, doi:10.5194/gmd-10-1175-2017 (2017).
14. Yue, C. et al. Modelling the role offires in the terrestrial carbon balance by incorporating SPITFIRE into the global vegetation model ORCHIDEE– Part 1: simulating historical global burned area and fire regimes. Geosci. Mod. Development 7, 2747–2767 (2014).
15. Archibald, S., Lehmann, C. E. R., Gomez-Dans, J. L. & Bradstock, R. A. Defining pyromes and global syndromes of fire regimes. Proc. Natl. Acad. Sci 110, 6442–6447 (2013).
16. Loepfe, Lasse, Rodrigo, Anselm & Francisco, Lloret. Two thresholds determine climatic control of forestfire size in Europe and northern Africa. Region. Environ. Change 14, 1395–1404 (2014).
17. Hantson, S., Pueyo, S. & Chuvieco, E. Globalfire size distribution is driven by human impact and climate: Spatial trends in global fire size distribution. Global Ecol. and Biogeography 24, 77–86 (2015).
18. Román-Cuesta, R. M., Gracia, M. & Retana, J. Factors influencing the formation of unburned forest islands within the perimeter of a large forestfire. Forest Ecol. and Manage 258, 71–80 (2009).
19. Oliveira, S. L. J. et al. Ecological Implications of Fine-Scale Fire Patchiness and Severity in Tropical Savannas of Northern Australia. Fire Ecol 11, 10–31 (2015).
20. Cary, G. J. et al. Comparison of the Sensitivity of Landscape-fire-succession Models to Variation in Terrain, Fuel Pattern, Climate and Weather. Landscape Ecology 21, 121–137 (2006).
21. Kasischke, E. S. & Hoy, E. E. Controls on carbon consumption during Alaskan wildlandfires. Global Change Biol. 18, 685–699 (2012).
22. Hempson, G. P. et al. Continental level drivers of African pyrodiversity. Ecography 41, 889–899. doi:10.1111/ecog.03109 (2018). 23. Violle, C., Reich, P. B., Pacala, S. W., Enquist, B. J. & Kattge, J. The emergence and promise of functional biogeography. Proc. Natl.
Acad. Sci 111, 13690–13696 (2014).
24. Kattge, J. et al. TRY - a global database of plant traits. Global Change Biol. 17, 2905–2935 (2011).
25. Butler, E. E. et al. Mapping local and global variability in plant trait distributions. Proc. Natl. Acad. Sci 114(51): E10937–E10946 (2017).
26. Archibald, S. & Roy, D. P. Identifying individualfires from satellite-derived burned area data. in III-160-III-163 (IEEE). doi:10.1109/IGARSS.2009.5417974 (2009).
27. Giglio, L., Schroeder, W. & Justice, C. The collection 6 MODIS activefire detection algorithm and fire products. Remote Sens. Environ. 178, 31–41 (2016).
28. Alonso-Canas, I. & Chuvieco, E. Global burned area mapping from ENVISAT-MERIS and MODIS activefire data. Remote Sens. Environ. 163, 140–152 (2015).
29. Oliva, P., Martín, P. & Chuvieco, E. Burned area mapping with MERIS post-fire image. Int. J. Remote Sens. 32, 4175–4201 (2011). 30. Chuvieco, E. et al. A new global burned area product for climate assessment offire impacts: A new global burned area product.
Global Ecol. and Biogeography 25, 619–629 (2016).
31. Oom, D., Silva, P. C., Bistinas, I. & Pereira, J. M. C. Highlighting Biome-Specific Sensitivity of Fire Size Distributions to Time-Gap Parameter Using a New Algorithm for Fire Event Individuation. Remote Sens 8, 663 (2016).
32. Nogueira, J., Ruffault, J., Chuvieco, E. & Mouillot, F. Can We Go Beyond Burned Area in the Assessment of Global Remote Sensing Products with Fire Patch Metrics? Remote Sens 9, 7 (2016).
34. Rothermel, R. C. A mathematical model for predictingfire spread in wildland fuels. USDA Forest Services. Research Paper INT-115 (1972).
35. Levine, N. Crimestat. III: A spatial statistics program for the analysis of crime incident locations (version 3.3) (Ned Levine and Associates: Houston TX/ National Institute of Justice: Washington, DC, 2010).
36. Bak, P., Tang, C. & Wiesenfeld, K. Self-organized criticality : an explanation of the 1/f noise. Phys. Rev. Lett. 59(4): 381–384 (1987).
37. Malamud, B. D. Forest Fires: An Example of Self-Organized Critical Behavior. Science 281, 1840–1842 (1998).
38. Pueyo, S Self-Organised Criticality and the Response of Wildland Fires to Climate Change. Clim. Change 82, 131–161 (2007). 39. Tum, M. et al. Global Gap-Free MERIS LAI Time Series (2002–2012). Remote Sens 8, 69 (2016).
Data Citation
1. Laurent, P. et al. OSU OREME https://doi.org/10.15148/0e999ffc-e220-41ac-ac85-76e92ecd0320 (2018).
Acknowledgements
The authors would like to thank Cathy Nangini for helping them check the language quality of the article, and the OSU OREME (Montpellier, France) for providing the authors the data repository within the Observation task "Mediterranean_Forest/Forest_Fires". Pierre Laurent work was supported by the ESA Fire_cci project. M. Vanesa Moreno work was supported by UM Post-Doc program, University of Montpellier (France), and co-financed by the ESA Fire_cci project. The Coordenação de Aperfeiçoa-mento de Pessoal Superior (CAPES, Brazil) provided a PhD grant to Joana MP Nogueira (BEX‐1185‐13‐6 process).
Additional information
Competing interests: The authors declare no competing interests.
How to cite this article: Laurent, P. et al. FRY, a global database offire patch functional traits derived from space-borne burned area products. Sci. Data 5:180132 doi: 10.1038/sdata.2018.132 (2018). Publisher’s note: Springer Nature remains neutral with regard to jurisdictional claims in published maps and institutional affiliations.
Open AccessThis article is licensed under a Creative Commons Attribution 4.0 Interna-tional License, which permits use, sharing, adaptation, distribution and reproduction in any medium or format, as long as you give appropriate credit to the original author(s) and the source, provide a link to the Creative Commons license, and indicate if changes were made. The images or other third party material in this article are included in the article’s Creative Commons license, unless indicated otherwise in a credit line to the material. If material is not included in the article’s Creative Commons license and your intended use is not permitted by statutory regulation or exceeds the permitted use, you will need to obtain permission directly from the copyright holder. To view a copy of this license, visit http://creativecommons. org/licenses/by/4.0/
The Creative Commons Public Domain Dedication waiver http://creativecommons.org/publicdomain/ zero/1.0/ applies to the metadatafiles made available in this article.