HAL Id: hal-02510670
https://hal.archives-ouvertes.fr/hal-02510670
Submitted on 18 Mar 2020
HAL is a multi-disciplinary open access
archive for the deposit and dissemination of
sci-entific research documents, whether they are
pub-lished or not. The documents may come from
teaching and research institutions in France or
abroad, or from public or private research centers.
L’archive ouverte pluridisciplinaire HAL, est
destinée au dépôt et à la diffusion de documents
scientifiques de niveau recherche, publiés ou non,
émanant des établissements d’enseignement et de
recherche français ou étrangers, des laboratoires
publics ou privés.
A test-and-not-treat strategy for onchocerciasis
elimination in Loa loa co-endemic areas: cost analysis of
a pilot in the Soa health district, Cameroon
Edeltraud J. Lenk, Henri C. Moungui, Michel Boussinesq, Joseph Kamgno,
Hugues C Nana-Djeunga, Christopher Fitzpatrick, Anne-Claire M. M.
Peultier, Amy D Klion, Daniel A Fletcher, Thomas B Nutman, et al.
To cite this version:
Edeltraud J. Lenk, Henri C. Moungui, Michel Boussinesq, Joseph Kamgno, Hugues C Nana-Djeunga,
et al.. A test-and-not-treat strategy for onchocerciasis elimination in Loa loa co-endemic areas: cost
analysis of a pilot in the Soa health district, Cameroon. Clinical Infectious Diseases, Oxford University
Press (OUP), 2019, �10.1093/cid/ciz461�. �hal-02510670�
M A J O R A R T I C L E
Clinical Infectious Diseases
Received 19 February 2019; editorial decision 24 May 2019; accepted 3 June 2019; published online June 4, 2019.
aJ. L. S. and W. A. S. contributed equally to this work.
Correspondence: E. J. Lenk, Erasmus School of Health Policy and Management, Erasmus University Rotterdam, PO Box 1738, 3000 DR Rotterdam, The Netherlands (lenk@eshpm.eur.nl).
Clinical Infectious Diseases® 2019;XX(XX):1–8
© The Author(s) 2019. Published by Oxford University Press for the Infectious Diseases Society of America. This is an Open Access article distributed under the terms of the Creative Commons Attribution License (http://creativecommons.org/licenses/by/4.0/), which permits unrestricted reuse, distribution, and reproduction in any medium, provided the original work is properly cited. DOI: 10.1093/cid/ciz461
A Test-and-Not-Treat Strategy for Onchocerciasis
Elimination in Loa loa–coendemic Areas: Cost Analysis of
a Pilot in the Soa Health District, Cameroon
Edeltraud J. Lenk,1,2, Henri C. Moungui,3 Michel Boussinesq,4 Joseph Kamgno,3 Hugues C. Nana-Djeunga,3 Christopher Fitzpatrick,5
Anne-Claire M. M. Peultier,1 Amy D. Klion,6 Daniel A. Fletcher,7 Thomas B. Nutman,6 Sébastien D. Pion,4 Yannick Niamsi-Emalio,3 William K. Redekop,1
Johan L. Severens,1,a and Wilma A. Stolk2,a
1Erasmus School of Health Policy and Management, Erasmus University Rotterdam, and 2Department of Public Health, Erasmus Medical Center, University Medical Center Rotterdam, The
Netherlands; 3Centre for Research on Filariasis and Other Tropical Diseases, Yaounde, Cameroon; 4Unité Mixte Internationale 233, TransVIHMI, Institut de Recherche pour le Développement,
University of Montpellier, France; 5Neglected Tropical Diseases, World Health Organization, Geneva, Switzerland; 6National Institute of Allergy and Infectious Diseases, National Institutes of
Health, Bethesda, Maryland; and 7Department of Bioengineering, University of California, Berkeley
Background. Severe adverse events after treatment with ivermectin in individuals with high levels of Loa loa microfilariae in the blood preclude onchocerciasis elimination through community-directed treatment with ivermectin (CDTI) in Central Africa. We measured the cost of a community-based pilot using a test-and-not-treat (TaNT) strategy in the Soa health district in Cameroon.
Methods. Based on actual expenditures, we empirically estimated the economic cost of the Soa TaNT campaign, including
fi-nancial costs and opportunity costs that will likely be borne by control programs and stakeholders in the future. In addition to the empirical analyses, we estimated base-case, less intensive, and more intensive resource use scenarios to explore how costs might differ if TaNT were implemented programmatically.
Results. The total costs of US$283 938 divided by total population, people tested, and people treated with 42% coverage were
US$4.0, US$9.2, and US$9.5, respectively. In programmatic implementation, these costs (base-case estimates with less and more in-tensive scenarios) could be US$2.2 ($1.9–$3.6), US$5.2 ($4.5–$8.3), and US$5.4 ($4.6–$8.6), respectively.
Conclusions. TaNT clearly provides a safe strategy for large-scale ivermectin treatment and overcomes a major obstacle to
the elimination of onchocerciasis in areas coendemic for Loa loa. Although it is more expensive than standard CDTI, costs vary depending on the setting, the implementation choices made by the institutions involved, and the community participation rate. Research on the required duration of TaNT is needed to improve the affordability assessment, and more experience is needed to un-derstand how to implement TaNT optimally.
Keywords. onchocerciasis; Loa loa; cost analysis; point-of-care testing; disease elimination.
Community-directed treatment with ivermectin (CDTI) has been used since 1999 as the main strategy to combat oncho-cerciasis in Africa [1, 2]. While generally considered safe, iver-mectin has been associated with severe adverse events (SAEs) in individuals with high levels of circulating microfilariae (mf) of Loa loa (another filarial parasite endemic in Central Africa) [3, 4]. CDTI has been implemented in coendemic areas where the proportion of individuals with Onchocerca volvulus nodules exceeds 20% (hyperendemic and mesoendemic areas), albeit
with enhanced adverse event (AE) surveillance. However, fear of SAEs has caused individuals in such areas to refuse treatment, leading to suboptimal drug coverage and continued O. volvulus transmission. Moreover, CDTI is not recommended in Loa-coendemic areas where O. volvulus is hypoendemic (nodule prevalence <20%), as the risk of SAEs is thought to outweigh the benefits of CDTI. This jeopardizes onchocerciasis elimina-tion in Africa [5, 6].
A test-and-not-treat (TaNT) strategy using a smartphone-based videomicroscope (LoaScope) enabled the safe imple-mentation of ivermectin treatment in a pilot study in the Okola health district (HD) in Cameroon where all individuals ≥5 years of age [7, 8] were included. Of 16 259 tested individuals, only 340 (2.1%) were excluded from ivermectin treatment because of microfilarial counts >20 000 mf/mL, whereas 15 522 (95.5%) were treated without the occurrence of SAEs [7]. A second TaNT study in Soa HD also had no postivermectin SAEs and further demonstrated that TaNT could be performed by local health workers and community members under the supervi-sion of the research team [9]. Additional information about
HeadB/HeadA=HeadC=HeadB/HeadA=HeadC/HeadB
HeadC/HeadB=HeadD=HeadC/HeadB=HeadC/HeadB
HeadC=NList_dot_numeric1=HeadC=NList_dot_numeric
HeadC/HeadB=NList_dot_numeric1=HeadC/HeadB=NList_dot_numeric
HeadD=NList_dot_numeric1=HeadD=NList_dot_numeric
HeadD/HeadC=NList_dot_numeric1=HeadD/HeadC=NList_dot_numeric
SubBList2=NList_dot_numeric2=SubBList=NList_dot_numeric2
SubBList2=NList_dot_numeric=SubBList=NList_dot_numeric
NList_dot_numeric2=HeadB=NList_dot_numeric=HeadB
NList_dot_numeric3=HeadB=NList_dot_numeric=HeadB
NList_dot_numeric2=SubBList1=NList_dot_numeric=SubBList1
NList_dot_numeric3=SubBList1=NList_dot_numeric=SubBList1
SubBList3=HeadD=SubBList_Before_Head=HeadD
SubBList2=HeadD=SubBList_Before_Head=HeadD
SubBList2=HeadB=SubBList=HeadB
SubBList3=HeadB=SubBList=HeadB
HeadC=NList_dot_numeric1(2Digit)=HeadC=NList_dot_numeric(2Digit)
HeadC/HeadB=NList_dot_numeric1(2Digit)=HeadC/HeadB=NList_dot_numeric(2Digit)
HeadD=NList_dot_numeric1(2Digit)=HeadD=NList_dot_numeric(2Digit)
HeadD/HeadC=NList_dot_numeric1(2Digit)=HeadD/HeadC=NList_dot_numeric(2Digit)
SubBList2(2Digit)=NList_dot_numeric2(2Digit)=SubBList(2Digit)=NList_dot_numeric2(2Digit)
SubBList2(2Digit)=NList_dot_numeric(2Digit)=SubBList(2Digit)=NList_dot_numeric(2Digit)
NList_dot_numeric2(2Digit)=HeadB=NList_dot_numeric(2Digit)=HeadB
NList_dot_numeric3(2Digit)=HeadB=NList_dot_numeric(2Digit)=HeadB
NList_dot_numeric2(2Digit)=SubBList1(2Digit)=NList_dot_numeric(2Digit)=SubBList1(2Digit)
NList_dot_numeric3(2Digit)=SubBList1(2Digit)=NList_dot_numeric(2Digit)=SubBList1(2Digit)
SubBList3(2Digit)=HeadD=SubBList(2Digit)=HeadD
SubBList2(2Digit)=HeadD=SubBList(2Digit)=HeadD
SubBList2(2Digit)=HeadB=SubBList(2Digit)=HeadB
SubBList3(2Digit)=HeadB=SubBList(2Digit)=HeadB
Extract3=BList3=Extract1=BList3
BList3=Extract3=BList3=Extract3_0
this TaNT round in the Soa HD can be found in Supplementary Appendix 1.
Although TaNT is a promising strategy for onchocerciasis elimination in loiasis-coendemic areas, its implementation is expected to be costlier than that of CDTI. Consequently, there are affordability concerns at a wider scale. Thus, we measured the cost of community-based TaNT in the above-mentioned Soa pilot study [9]. In addition, we estimated the cost for 3 pro-grammatic implementation scenarios (base-case, less intensive, and more intensive), to obtain a range of plausible estimates under different assumptions of resource use.
METHODS
General Approach
A microcosting approach [10] was used to empirically assess the cost of a community-based TaNT in the Soa HD [9]. The empirical costing study reflects the costs borne by the organ-izations involved in implementing and executing the program in this specific pilot. A future program would likely be run by the Cameroonian Ministry of Health (MoH) in partnership with nongovernmental development organizations (NGDOs). We aimed to reflect this future situation in our cost calculations and therefore calculated the economic costs of the pilot, in-cluding financial costs (explicit cash expenditures on project activities) and added relevant opportunity costs (resources that could be used in other projects, if not used in this one) [11]. We designed the protocol, data collection instruments, and cost
calculation sheets following standard guidelines and reported input quantities and costs to maximize comparability with other studies and recently published mass drug administration (MDA) benchmarks [11, 12].
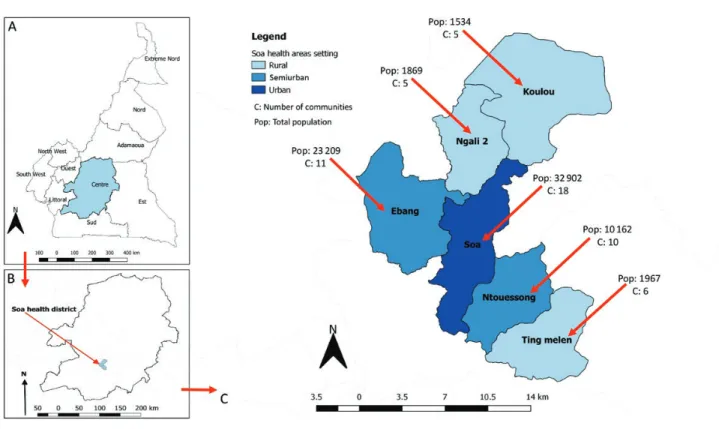
Study Area and Population
The Soa HD in Cameroon (Figure 1) is an ivermectin-naive dis-trict that is hypoendemic for onchocerciasis and coendemic for loiasis [13]. It is located 17 km from Yaoundé (Cameroon’s cap-ital) and is easily accessible. Soa HD consists of 6 health areas (3 rural, 2 semiurban, 1 urban) and its population was estimated at 71 643 inhabitants, according to the census performed as part of the TaNT pilot.
Time Window
The census, testing/treating, and monitoring of SAEs in the TaNT round took place from September 2017 to February 2018. Costs were collected beginning with the preparation of the round in August 2017 until the last payments in March 2018. Cost Calculation Components
The “supplies” category includes (but is not restricted to) fuel, car maintenance, food, transportation, office materials, field materials, and drugs to treat AEs. The “personnel” category includes per diems of community drug distributors (CDDs) and other staff, project staff salaries, and fringe costs for study personnel, when applicable. Overhead costs were not explic-itly measured but were assumed to be 15% of direct costs, as
Figure 1. Map of Soa health district in Cameroon, showing the rural/urban characterization, number of communities, and population size by health area.
reported in the project budget. Supplementary Appendices 1 and 2: Tables 1, 2, and 4) provide additional information. We excluded the following costs: ivermectin costs (as the drug was donated); bank tariffs; management/administrative costs incurred outside the country; costs incurred by households to be treated; opportunity cost of time spent by school staff; and opportunity costs of buildings used by MoH staff and of capital items purchased for previous projects.
Costs of LoaScopes and capillaries were provided in US dollars (US$); all other costs were reported in Central African francs (XAF) and converted to US$ using the US Treasury Reporting Rates of Exchange of 31 December 2017 (US$1 = XAF 568) [14]. Data Collection
Costs were based on actual payments or booked transfers col-lected from all invoices and bank transactions provided by project managers. External MoH staff working in the project and CDDs were interviewed using structured questionnaires to obtain information about their time spent on the project and opportunity cost of their salaries. A summary of the design, structure, and dissemination protocol for each questionnaire and English versions of these can be found in Supplementary Appendix 3: Table 6 and Questionnaires 1–3).
Data Entry, Cleaning, and Analysis
The invoices were analyzed and compared to the data pro-vided by monthly financial reports and bank transactions for
consistency and quality checks. The value of each invoice or bank transaction was labeled according to the input category, the health area in which the cost was incurred (using the label “district costs” if costs were not specific to any health area, but relative to the project as a whole), and the activity to which the cost could be attributed (advocacy, census, planning and budgeting, procurement, training, health education in the community and mobilization [HECM], delivery and distribu-tion of intervendistribu-tions to target populadistribu-tions, AE surveillance and management, monitoring and evaluation, and general manage-ment). Data from invoices and questionnaires were entered into a Microsoft Excel spreadsheet for further analysis. Overhead costs were added to the subtotal and the final result was divided by the project outputs.
Scenario Analysis
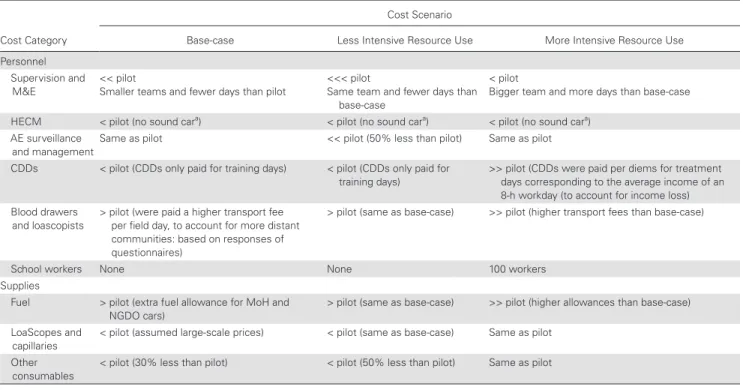
To assess the effect of different implementation strategies on the overall cost of TaNT, costs were calculated using 3 hypothetical alternative TaNT implementation scenarios: “base-case,” “less intensive resource use,” and “more intensive resource use.” The scenarios were designed based on the literature and our own expertise in conducting CDTI in Cameroon, using the same HD for context (eg, applying the same rural/urban distribution, same distances to the capital, same mode of delivery) [2, 15]. Table 1 describes the main differences between the scenarios and the pilot. See Supplementary Appendix 4: Tables 7–9) for a more detailed description.
Table 1. Summarized Description of Alternative Scenarios
Cost Category
Cost Scenario
Base-case Less Intensive Resource Use More Intensive Resource Use Personnel
Supervision and
M&E << pilot Smaller teams and fewer days than pilot <<< pilot Same team and fewer days than base-case
< pilot
Bigger team and more days than base-case HECM < pilot (no sound cara) < pilot (no sound cara) < pilot (no sound cara)
AE surveillance
and managementSame as pilot << pilot (50% less than pilot) Same as pilot CDDs < pilot (CDDs only paid for training days) < pilot (CDDs only paid for
training days) >> pilot (CDDs were paid per diems for treatment days corresponding to the average income of an 8-h workday (to account for income loss) Blood drawers
and loascopists
> pilot (were paid a higher transport fee per field day, to account for more distant communities: based on responses of questionnaires)
> pilot (same as base-case) >> pilot (higher transport fees than base-case)
School workers None None 100 workers
Supplies
Fuel > pilot (extra fuel allowance for MoH and
NGDO cars) > pilot (same as base-case) >> pilot (higher allowances than base-case) LoaScopes and
capillaries < pilot (assumed large-scale prices) < pilot (same as base-case) Same as pilot Other
consumables < pilot (30% less than pilot) < pilot (50% less than pilot) Same as pilot
Abbreviations: <, less than; <<, lesser than; <<<, much lesser than; >, more than; >>, much more than; AE, adverse events; CDD, community drug distributors; HECM, health education in the community and mobilization; M&E, monitoring and evaluation; MoH, Ministry of Health; NGDO, nongovernmental development organization.
aMegaphone-equipped car.
RESULTS
The population size and numbers of individuals tested, treated, or excluded, as well as the occurrence of AEs, per health area are given in Table 2. Only 0.8% of the tested population was excluded from treatment. The overall coverage was relatively low (42%).
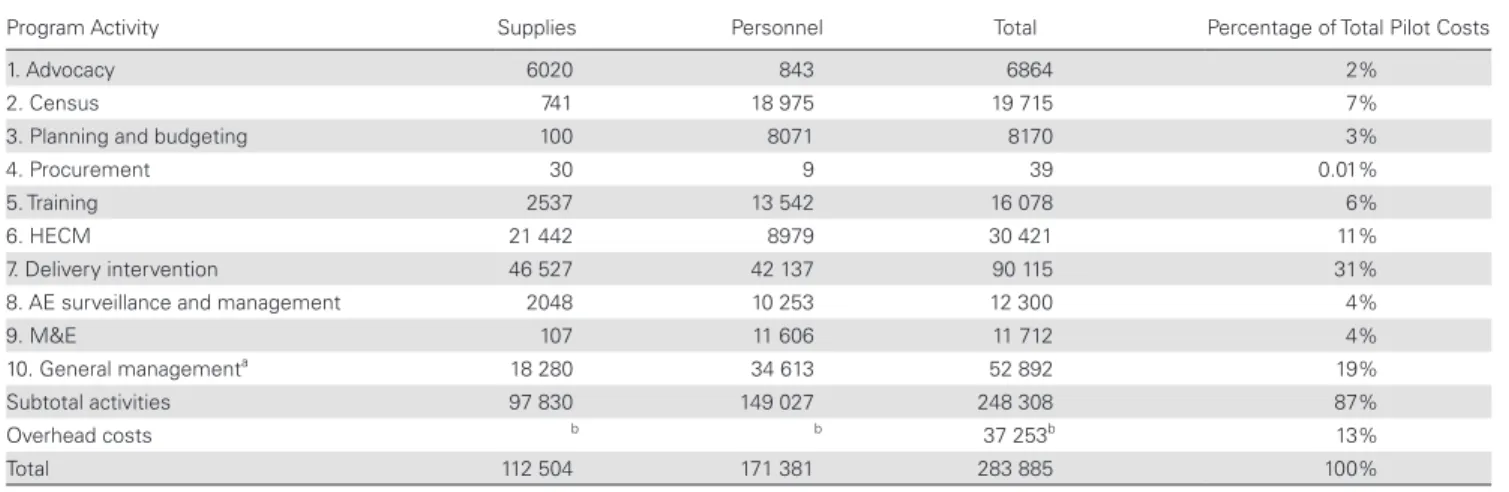
The costs of the pilot, disaggregated by programmatic activity, are presented in Table 3. The costliest activities were related to the actual delivery of the intervention (31%) and HECM (11%), although general management costs (not related to a specific activity) also formed a large part of the total costs (19%). The supplies input categories that were responsible for the highest shares of the total costs (from highest to lowest), are capillaries and information, education, and communication materials leading with 12% and 10% of the total pilot costs, respec-tively (Supplementary Appendix 2: Table 3). Supplementary Appendix 5: Table 10 shows volumes and prices of supplies per input category.
The majority of the personnel costs were not related to a spe-cific activity but to actions related to the implementation of the round as a whole. The same holds true for district and health area level MoH personnel. The main costs of all other categories were related to the delivery of the intervention (Supplementary Appendix 2: Table 5).
The total cost for the entire pilot was US$283 938 (Table 4), with a cost per person treated of US$9.5. The cost per person treated was reduced to US$5.4 for the base-case and to US$4.6 and US$8.6 for the less and more intensive scenarios, respectively.
The absolute costs of the Soa pilot and each of the implemen-tation scenarios disaggregated by programmatic activity, as well as the percentages of each activity, are given in Figure 2. The empirical study was more expensive than the scenarios, mainly due to the census, HECM, general management costs (for in-stance car maintenance and field materials), and the costs of LoaScopes and capillaries. Costs of delivering the intervention
formed the largest share of the total costs, mainly due to the costs of capillaries, field material, and per diems, which showed a reduction in the base-case and less intensive scenarios mostly due to less supervision and less expensive materials. Costs increased considerably in the more intensive scenario, due to the payment of higher per diems to CDDs to account for in-come loss. Even though general management costs were also reduced by less expensive materials in the scenarios, the per-centage of the total costs did not change much. Costs of HECM were lower in the scenarios because of the exclusion of the costs of the megaphone-equipped car and the reduction of prices of materials.
DISCUSSION
This study provides both empirical cost estimates of a pilot and projected costs based on scenario analyses using the new TaNT strategy in regions coendemic for O. volvulus and L. loa. Based on actual expenditure during the pilot, this strategy cost US$4.0 per person in the population, US$9.2 for each person tested, and US$9.5 for each person treated. In the alternative implementa-tion scenarios, these costs (shown as base-case estimates with less and more intensive scenarios) were estimated to be US$2.2 ($1.9–$3.6), US$5.2 ($4.5–$8.3), and US$5.4 ($4.6–$8.6), as-suming that population participation remained unchanged.
Several limitations apply to the internal validity of our study. Despite the careful collection of available data from invoices, bank transfers, and questionnaires, we had to adapt to the system usually used by financial managers of the implementing institution, without explicit reporting of the cost of previously acquired capital items or building rental. Using a retrospective questionnaire investigating opportunity costs of MoH staff was also not ideal, as it allows recall bias. Opportunity costs of time spent by school staff when helping during the treatment phase and of vehicles and furniture acquired for other projects were not included in this study, leading to a slight underestimation of the costs of the pilot. These limitations should be addressed
Table 2. Program Outputs (Number of Individuals)
Health Area Censused Censused Aged >5 Tested With LoaScope Treated Excluded for Loa >20 000 mf/mL Other ReasonsExcluded for a AEsb
Coverage (Treated/ Censused), % Ting Melen (r) 1967 1697 1644 1585 16 43 7 81 Koulou (r) 1534 1342 1035 975 38 22 18 64 Ngali 2 (r) 1869 1594 1017 963 36 18 19 52 Ebang (su) 23 209 19 906 11 412 10 987 53 372 47 47 Ntouessong (su) 10 162 8618 3602 3473 44 85 25 34 Soa (u) 32 902 29 524 12 098 11 765 58 275 68 36 Total 71 643 62 681 30 808 29 748 245 815 184 42
Abbreviations: AE, adverse event; mf, microfilariae; r, rural; su, semiurban; u, urban. aPregnant and breastfeeding women, individuals suffering from chronic disease. bNumber of AEs (multiple AEs may occur in 1 person).
in future studies to increase the accuracy of cost estimates and enable policymakers to anticipate their costs more reliably. This would also allow economic costs to be presented separated from financial costs.
Because we measured costs in a study setting, alongside a pilot implementation of community-based TaNT, our results may not be fully representative of a programmatic setting, lim-iting the external validity. Some costs may have been higher than expected under programmatic implementation (eg, all personnel received intensive training and supervision and CDDs received payment). Furthermore, best implementation practice still remains to be determined, and future programs
may be implemented somewhat differently. The programmatic operationalization scenarios were designed to address the ex-ternal validity limitations. They still do not cover all possible variations in implementation choices. We built the base-case scenario aiming to reflect Cameroonian reality as much as pos-sible. As shown in the scenario analyses, costs heavily depend on implementation choices, and cost-savings compared to the pilot can be achieved through reductions in supervisory per-sonnel, health education and sensitization, surveillance and management of AEs, and purchase prices of the LoaScopes and capillaries. The last 2 categories can be further reduced by implementing NGDOs/MoH if external funding agencies Table 3. Total Costs of Pilot per Activity (US Dollars)
Program Activity Supplies Personnel Total Percentage of Total Pilot Costs
1. Advocacy 6020 843 6864 2%
2. Census 741 18 975 19 715 7%
3. Planning and budgeting 100 8071 8170 3%
4. Procurement 30 9 39 0.01%
5. Training 2537 13 542 16 078 6%
6. HECM 21 442 8979 30 421 11%
7. Delivery intervention 46 527 42 137 90 115 31%
8. AE surveillance and management 2048 10 253 12 300 4%
9. M&E 107 11 606 11 712 4%
10. General managementa 18 280 34 613 52 892 19%
Subtotal activities 97 830 149 027 248 308 87%
Overhead costs b b 37 253b 13%
Total 112 504 171 381 283 885 100%
Abbreviations: AE, adverse event; HECM, health education in the community and mobilization; M&E, monitoring and evaluation.
aIncludes all inputs related to the project as a whole and that could not be attributed to a specific activity (eg, electricity, some office supplies, communication, some of the fuel and car maintenance costs).
bCalculated as 15% of the activities subtotal.
Table 4. Total Costs per Round and per Program Output (US Dollars): Pilot and Alternative Scenarios
Health Area and Scenario Total Costs of the Pilot per Health Area CensusedTotal No. Cost per Person Censused Cost per Person Tested Cost per Person Treated
Coverage (Treated/ Censused), % Empirical cost estimates by health area
Ting Melen (r) 17 770 1967 9.0 10.8 11.2a 81b Koulou (r) 14 994 1534 9.8 14.5 15.4a 64b Ngali 2 (r) 16 161 1869 8.6 15.9 16.8a 52b Ebang (su) 90 425 23 209 3.9 7.9 8.2 47c Ntouessong (su) 41 163 10 162 4.1 11.4 11.9 34c Soa (u) 103 425 32 902 3.1 8.5 8.8 36c
Total costs of the TaNT pilot 283 938 71 643 4.0 9.2 9.5 42
Alternative implementation scenarios
Base-case 159 349 71 643 2.2 5.2 5.4 42
Less intensive 137 289 71 643 1.9 4.5 4.6 42
More intensive 255 850 71 643 3.6 8.3 8.6 42
Abbreviations: r, rural; su, semiurban; TaNT, test and not treat; u, urban.
aRural areas had a higher cost per person treated due to more supervisory personnel (they were the first areas to participate in the pilot), more fuel costs (increased distance from the capital), and additional testing/treating at schools.
bRural areas had higher coverage because people are at home or work close to home and can be reached more easily by community drug distributors during the sensitization phase and because people are available during sampling hours (sampling needs to be done during regular school/work hours [between 10:00 am and 4:00 pm] due to the diurnal periodicity of Loa loa microfilaremia).
cSemiurban and urban areas had lower coverage because of more treatment refusals and the absence of people at work/school during sampling hours.
opt to donate these supplies to countries choosing to imple-ment the TaNT strategy, as already done with the donation of ivermectin.
Overall study coverage was relatively low, particularly in the semiurban and urban areas. Higher coverage is essential to on-chocerciasis elimination. Achieving high coverage in urban areas is a known problem, even in standard CDTI, due to lack of trust in public programs, migrant populations, and disorganized poor urban settlements [16, 17]. Yet, it may be even more diffi-cult to achieve in TaNT programs, as blood sampling needs to be done during regular school/work hours, requires the involve-ment of additional people (blood drawers and “loascopists”), and is best done with a mobile station rather than house-to-house. Additional measures are needed to increase coverage, including continuous and improved health education/mobiliza-tion and alternative ways to offer testing and treatment, such as mobile stations at schools and in commercial/industrial areas. However, because it is difficult to predict the cost and impact of these measures on coverage, we have not considered increases in coverage in our implementation scenarios. Although there will be some economies of scale (fixed costs divided over a larger population), other costs are likely to increase with the number of people covered (eg, personnel costs for delivering the intervention), resulting in a higher cost per person.
Our estimates, derived from a community-based single study, are not directly transferable to other settings due to many factors, such as variations in local prices, organization and availability of healthcare, and geographic characteristics such as remoteness, accessibility, and level of “urbanness” [18, 19].
To eliminate onchocerciasis, treatment would have to be re-peated yearly (or more frequently) for many years with suffi-cient treatment coverage (ie, 80% of the eligible population per World Health Organization guidance) [20]. The costs of future rounds are likely to be significantly lower than the initial round for a number of reasons, including the absence of startup costs, shared fixed costs (over multiple rounds within a given year), more efficient implementation (from the experience and struc-ture provided by the first round), lower intensity of HECM (communities would already be aware of the strategy), and less MoH advocacy and AE surveillance (since fewer cases would need to be followed). Further, as L. loa microfilarial densities remain low after treatment for at least 18 months, people proven to be treated in the previous round (using reidentification methods) would not need to be retested [21]. Capillary and LoaScope costs would only remain for the individuals not pre-viously tested and treated, making costs much more compa-rable to those of standard CDTI.
To date, there are no studies of the costs of alternative strategies of measuring L. loa microfilarial densities before treating for onchocerciasis to which we could compare our results. We cannot directly estimate the difference in costs between TaNT and CDTI without empirical comparisons, as it is impossible to disentangle costs of treatment from those of testing in the TaNT strategy. A unit cost benchmarking study by Fitzpatrick et al [11] showed that the unit cost of mass drug administration is highly variable, depending very much on the use of volunteers and economies of scale. This variation complicates a direct comparison of our results with
50 000 100 000 150 000 200 000 250 000 300 000 Empirical data Soa pilot Scenario 1: base case Scenario 2: less intensive Scenario 3: more intensive )$ S U( st so C 1) Advocacy 2) Census
3) Planning and budge ng 4) Procurement 5) Training
6) Health educa on community/ mobiliza on
7) Delivery interven on 8) Adverse event surveillance and management 9) Monitoring/evalua on 10) Overall Overhead 0% 10% 20% 30% 40% 50% 60% 70% 80% 90% 100% Empirical data Soa pilot Scenario 1: base case Scenario 2: less intensive Scenario 3: more intensive Pe rc en ta ge fr om to tal co st s
Figure 2. Total costs: empirical vs scenarios.
any previously published figures. A web-based tool [11] that provides unit cost benchmarks for different settings allowed us to estimate the expected cost of a first round of standard CDTI in Soa, using the corresponding population and characteristics of the area (which the tool allows), and the resulting cost esti-mate was US$18.3 (95% confidence interval [CI], $6.9–$35.6) per person treated using paid community health workers. The observed cost of TaNT for the pilot and more intensive scenario are closer to the lower end of the range despite the cost of testing. The benchmark unit cost of standard CDTI is considerably lower when implemented by unpaid community volunteers, US$3.9 (95% CI, $2.2–$5.7), and the cost of our base-case and low-intensity implementation scenario comes quite close to this. Details on the use of the benchmark tool are provided in Supplementary Appendix 6.
Through TaNT, community treatment with ivermectin can be expanded into the many areas in central Africa that are hypoendemic for onchocerciasis and coendemic for loiasis, where standard CDTI cannot be applied for safety reasons. Implementing treatment in these regions is crucial for the continent-wide elimination of onchocerciasis, with associated health and socioeconomic benefits estimated at more than US$6 billion [22]. The populations concerned will not only ben-efit from the control and potential elimination of onchocerciasis but—as ivermectin is a broad-spectrum anthelmintic drug— also from the effects of treatment of other parasitic diseases in-cluding scabies and soil-transmitted helminthiases.
CONCLUSIONS
Costs of TaNT are higher than costs of standard CDTI. How much higher will depend on how subsequent treatment rounds will be implemented and the required program duration. The duration will not be much longer than in Loa-free areas if the coverage is sufficiently high and the proportion of the popu-lation excluded from treatment (because of high-density loi-asis) is as low as observed in Soa and Okola (1% on average). The effect of excluding people from treatment may be more important where the proportion of people excluded due to lo-iasis is higher, but this can be mitigated by offering alternative treatment for onchocerciasis, such as a course of doxycycline. Although we did not assess the costs associated with such treat-ment, these should be weighed against the impact on program duration and success.
Even though TaNT is undoubtedly more expensive than MDA, onchocerciasis elimination will not be reached without a strategy that can be safely used in areas coendemic for L. loa. Our empirical study shows that TaNT using LoaScopes remains affordable, given the enormous potential economic benefits of reaching elimination of onchocerciasis in Cameroon and in other countries where L. loa is coendemic with O. volvulus. Various implementation scenarios show that costs could be
further reduced. Future studies in this field are needed to inves-tigate the costs of a programmatic implementation.
Supplementary Data
Supplementary materials are available at Clinical Infectious Diseases online. Consisting of data provided by the authors to benefit the reader, the posted materials are not copyedited and are the sole responsibility of the authors, so questions or comments should be addressed to the corresponding author. Notes
Acknowledgments. The authors express their true appreciation to Ann Goldman, Paul Cantey, Sim Azebaze, Raoul Ghomsi, and Katia Urena, whose important comments and insights contributed to this work.
Disclaimer. The authors alone are responsible for the views expressed in this article, which do not necessarily represent the views, decisions, or policies of the institutions with which they are affiliated.
Financial support. This work was supported by the Bill & Melinda Gates Foundation (grant number OPP1033740 to M. B., J. K., H. C. N., A. D. K., T. B. N., D. A. F., S. D. P., Y. N., and W. A. S.) and the Division of Intramural Research, National Institute of Allergy and Infectious Diseases, National Institutes of Health (to A. D. K. and T. B. N.). E. J. L. is external PhD at the Erasmus School of Health Policy and Management and this affiliation is formalized by means of an unpaid hospitality agreement. E. J. L. has performed the work for this study as external junior researcher, formalized by a paid fixed-term collaboration agreement with the Department of Public Health, Erasmus Medical Center, Rotterdam.
Potential conflicts of interest. D. A. F. is an inventor on patents re-lated to mobile phone imaging: High Numerical Aperture Telemicroscopy Apparatus (US patents 8743194 and 8786695) licensed by Thermo Fisher Scientific and CellScope Inc. All other authors report no potential conflicts of interest. All authors have submitted the ICMJE Form for Disclosure of Potential Conflicts of Interest. Conflicts that the editors consider relevant to the content of the manuscript have been disclosed.
References
1. Tekle AH, Zouré HG, Noma M, et al. Progress towards onchocerciasis elimina-tion in the participating countries of the African Programme for Onchocerciasis Control: epidemiological evaluation results. Infect Dis Poverty 2016; 5:66. 2. United Nations Development Programme/World Bank /World Health Organization.
Special programme for research and training in tropical diseases (TDR). Community directed treatment with ivermectin: report of a multi-country study. Applied field re-search reports. TDR/AFR/RP/96.1. Geneva, Switzerland: WHO, 1996. Available at: http://www.who.int/tdr/publications/documents/comdti_1.pdf.
3. Boussinesq M, Gardon J, Gardon-Wendel N, Chippaux JP. Clinical picture, ep-idemiology and outcome of Loa-associated serious adverse events related to mass ivermectin treatment of onchocerciasis in Cameroon. Filaria J 2003; 2(Suppl 1):S4-2883-2-S1-S4.
4. Gardon J, Gardon-Wendel N, Demanga-Ngangue, Kamgno J, Chippaux JP, Boussinesq M. Serious reactions after mass treatment of onchocerciasis with iver-mectin in an area endemic for Loa loa infection. Lancet 1997; 350:18–22. 5. Twum-Danso NA. Serious adverse events following treatment with ivermectin
for onchocerciasis control: a review of reported cases. Filaria J 2003; 2(Suppl 1):S3-2883-2-S1-S3.
6. Dadzie Y, Amazigo UV, Boatin BA, Sékétéli A. Is onchocerciasis elimination in Africa feasible by 2025: a perspective based on lessons learnt from the African control programmes. Infect Dis Poverty 2018; 7:63.
7. Kamgno J, Pion SD, Chesnais CB, et al. A test-and-not-treat strategy for oncho-cerciasis in Loa loa-endemic areas. N Engl J Med 2017; 377:2044–52.
8. D’Ambrosio MV, Bakalar M, Bennuru S, et al. Point-of-care quantification of blood-borne filarial parasites with a mobile phone microscope. Sci Transl Med
2015; 7:286re4.
9. Kamgno J, Nana-Djeunga HC, Pion SD, et al. Operationalization of the test and not treat strategy to accelerate the elimination of onchocerciasis and lymphatic filariasis in Central Africa. Int Health 2018; 10:i49–53.
10. Frick KD. Microcosting quantity data collection methods. Med Care 2009; 47:S76–81.
11. Fitzpatrick C, Fleming FM, Madin-Warburton M, et al. Benchmarking the cost per person of mass treatment for selected neglected tropical diseases: an approach
based on literature review and meta-regression with web-based software applica-tion. PLoS Negl Trop Dis 2016; 10:e0005037.
12. Goldman AS. DOLF PROJECT: protocol for cost data collection in community trials—2X vs 1X annual MDA. Washington, DC: George Washington University School of Public Health and Health Services, 2010.
13. Cano J, Basanez MG, O’Hanlon SJ, et al. Identifying co-endemic areas for major filarial infections in sub-Saharan Africa: seeking synergies and preventing severe adverse events during mass drug administration campaigns. Parasit Vectors 2018; 11:70-018-2655-5.
14. Bureau of the Fiscal Service, US Department of the Treasury. Treasury reporting rates of exchange. 2018. Available at: https://www.fiscal.treasury.gov/fsreports/ rpt/treasRptRateExch/historicalRates.htm. Accessed 20 March 2018.
15. Meredith SE, Cross C, Amazigo UV. Empowering communities in combating river blindness and the role of NGOs: case studies from Cameroon, Mali, Nigeria, and Uganda. Health Res Policy Syst 2012; 10:16.
16. Koudou BG, de Souza DK, Biritwum NK, et al. Elimination of lymphatic filariasis in West African urban areas: is implementation of mass drug administration nec-essary? Lancet Infect Dis 2018; 18:e214–20.
17. Envision. Eliminating neglected tropical diseases (NTDs) in urban settings (tech-nical brief). 2017. Available at: https://www.ntdenvision.org/sites/default/files/ docs/urban_mda_technical_brief_v6_0.pdf. Accessed 18 June 2018.
18. Sculpher MJ, Pang FS, Manca A, et al. Generalisability in economic evaluation studies in healthcare: a review and case studies. Health Technol Assess 2004; 8:iii– iv, 1–192.
19. Drummond M, Barbieri M, Cook J, et al. Transferability of economic evaluations across jurisdictions: ISPOR Good Research Practices Task Force report. Value Health 2009; 12:409–18.
20. World Health Organization. Guidelines for stopping mass drug administration and verifying elimination of human onchocerciasis: criteria and procedures. Geneva, Switzerland: WHO Document Production Services, 2016.
21. Pion S, Kamgno J, Chesnais C, et al. Effect of a single dose of ivermectin on
Loa loa microfilaremia 18 months after treatment. Am J Trop Med Hyg 2017;
97:559.
22. Kim YE, Stolk WA, Tanner M, Tediosi F. Modelling the health and economic impacts of the elimination of river blindness (onchocerciasis) in Africa. BMJ Glob Health 2017; 2:e000158.