Publisher’s version / Version de l'éditeur:
Science, 320, pp. 1478-1481, 2008-05-01
READ THESE TERMS AND CONDITIONS CAREFULLY BEFORE USING THIS WEBSITE. https://nrc-publications.canada.ca/eng/copyright
Vous avez des questions? Nous pouvons vous aider. Pour communiquer directement avec un auteur, consultez la première page de la revue dans laquelle son article a été publié afin de trouver ses coordonnées. Si vous n’arrivez pas à les repérer, communiquez avec nous à [email protected].
Questions? Contact the NRC Publications Archive team at
[email protected]. If you wish to email the authors directly, please see the first page of the publication for their contact information.
NRC Publications Archive
Archives des publications du CNRC
This publication could be one of several versions: author’s original, accepted manuscript or the publisher’s version. / La version de cette publication peut être l’une des suivantes : la version prépublication de l’auteur, la version acceptée du manuscrit ou la version de l’éditeur.
For the publisher’s version, please access the DOI link below./ Pour consulter la version de l’éditeur, utilisez le lien DOI ci-dessous.
https://doi.org/10.1126/science.1157980
Access and use of this website and the material on it are subject to the Terms and Conditions set forth at
Laser-Induced Electron Tunneling and Diffraction
Meckel, M.; Comtois, D.; Zeidler, D.; Staudte, A.; Pavičić, D.; Bandulet, H. C.;
Pépin, H.; Kieffer, J. C.; Dörner, R.; Villeneuve, D. M.; Corkum, P. B.
https://publications-cnrc.canada.ca/fra/droits
L’accès à ce site Web et l’utilisation de son contenu sont assujettis aux conditions présentées dans le site LISEZ CES CONDITIONS ATTENTIVEMENT AVANT D’UTILISER CE SITE WEB.
NRC Publications Record / Notice d'Archives des publications de CNRC:
https://nrc-publications.canada.ca/eng/view/object/?id=8e70c346-ca23-40e2-9739-60e25644bea9
https://publications-cnrc.canada.ca/fra/voir/objet/?id=8e70c346-ca23-40e2-9739-60e25644bea9
5. K. S. Egiyan et al., Phys. Rev. Lett. 96, 082501 (2006). 6. R. A. Niyazov et al., Phys. Rev. Lett. 92, 052303 (2004). 7. F. Benmokhtar et al., Phys. Rev. Lett. 94, 082305 (2005). 8. J. L. S. Aclander et al., Phys. Lett. B 453, 211 (1999). 9. A. Tang et al., Phys. Rev. Lett. 90, 042301 (2003). 10. A. Malki et al., Phys. Rev. C Nucl. Phys. 65, 015207
(2002).
11. E. Piasetzky, M. Sargsian, L. Frankfurt, M. Strikman, J. W. Watson, Phys. Rev. Lett. 97, 162504 (2006). 12. R. Shneor et al., Phys. Rev. Lett. 99, 072501 (2007). 13. L. L. Frankfurt, M. I. Strikman, Phys. Rep. 76, 215 (1981). 14. L. L. Frankfurt, M. I. Strikman, D. B. Day, M. Sargsian,
Phys. Rev. C Nucl. Phys. 48, 2451 (1993).
15. J. Alcorn et al., Nucl. Instrum. Methods A522, 294 (2004). 16. Materials and methods are available as supporting
material on Science Online.
17. I. Mardor, Y. Mardor, E. Piasetzky, J. Alster, M. M. Sargsian, Phys. Rev. C Nucl. Phys. 46, 761 (1992). 18. R. Schiavilla, R. B. Wiringa, S. C. Pieper, J. Carlson,
Phys. Rev. Lett. 98, 132501 (2007).
19. M. M. Sargsian, T. V. Abrahamyan, M. I. Strikman, L. L. Frankfurt, Phys. Rev. C Nucl. Phys. 71, 044615 (2005).
20. J. M. Lattimer, M. Prakash, Science 304, 536 (2004). 21. G. Baym, Nucl. Phys. A. 590, 233 (1995). 22. G. Baym, Nucl. Phys. A. 702, 3 (2002).
23. T. Frick, H. Muther, A. Rios, A. Polls, A. Ramos, Phys. Rev. C Nucl. Phys. 71, 014313 (2005).
24. This work was supported by the Israel Science Foundation, the U.S.-Israeli Binational Scientific Foundation, the UK Engineering and Physical Sciences Research Council and Science and Technology Facilities Council, NSF, and the U.S.
Department of Energy (DOE) (grants DE-AC02-06CH11357 and DE-FG02-94ER40818 and U.S. DOE contract no. DE-AC05-84150, modification no. M175, under which the Southeastern Universities Research Association, Inc. operates the Thomas Jefferson National Accelerator Facility). The raw data from this experiment are archived in Jefferson Lab's mass storage silo.
Supporting Online Material
www.sciencemag.org/cgi/content/full/320/5882/1476/DC1 Materials and Methods
Figs. S1 and S2 Table S1 References
19 February 2008; accepted 8 May 2008 10.1126/science.1156675
Laser-Induced Electron
Tunneling and Diffraction
M. Meckel,1,2D. Comtois,3D. Zeidler,1,4A. Staudte,1,2D. Pavičić,1H. C. Bandulet,3H. Pépin,3 J. C. Kieffer,3R. Dörner,2D. M. Villeneuve,1P. B. Corkum1*
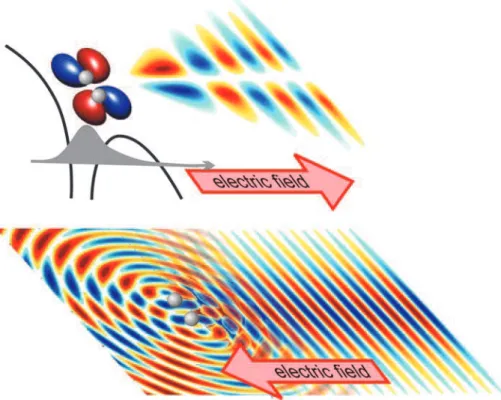
Molecular structure is usually determined by measuring the diffraction pattern the molecule impresses on x-rays or electrons. We used a laser field to extract electrons from the molecule itself, accelerate them, and in some cases force them to recollide with and diffract from the parent ion, all within a fraction of a laser period. Here, we show that the momentum distribution of the extracted electron carries the fingerprint of the highest occupied molecular orbital, whereas the elastically scattered electrons reveal the position of the nuclear components of the molecule. Thus, in one comprehensive technology, the photoelectrons give detailed information about the electronic orbital and the position of the nuclei.
M
olecular multiphoton ionization in the tunneling limit (sketched in the upper frame of Fig. 1) is similar to tunneling in a scanning tunneling microscope (STM) (1). In both cases, electrons escape from the outer regions of the orbital to the continuum; that is, to the vacuum for multiphoton ionization of gas phase molecules or to the conduction band of the metal tip in a STM. In a STM, the sample is fixed and the tip is moved. Rotating the molecule with respect to the field direction is the analog of moving the tip. The resulting angle-dependent ionization probability (2–5) provides information for a molecule analogous to the position depen-dence of the tunneling current in a STM. How-ever, whereas the total tunneling current is one observable, the electron wave packet that emerges into the vacuum from the tunnel retains more information about the orbital.In contrast to the static field of a STM, the electric field in a laser pulse oscillates and forces
a fraction of the tunneled electron wave packet back to the parent ion. There, the wave packet can diffract from the molecule (lower frame in Fig. 1). This phenomenon has been called laser-induced electron diffraction (LIED) (6) and relates to recent research on ultrafast electron diffraction, where a femtosecond electron bunch is created at a photocathode and accelerated in an electrostatic field onto a molecular (7) or solid state (8) target. In our case, the molecule serves as its own photo-cathode, whereas the laser provides the accelerat-ing field. This situation produces extremely high current densities and attosecond timing (9).
We report the observation of molecular tunneling spectroscopy and LIED. We measured electrons produced from aligned O2 and N2,
resolving their three-dimensional (3D) momen-tum distribution. Comparing experiment and theory, we show that, in the two dimensions per-pendicular to the field direction, the momentum distribution for these direct electrons is deter-mined by the highest occupied molecular orbital (HOMO), observed through the filter of the suppressed binding potential (Fig. 1) through which the electron tunnels. We also demonstrate LIED (6) and confirm its origin with a simula-tion. Selecting the wavelength of the recollision electron modifies the diffraction pattern. Thus, one set of measurements simultaneously identi-fies the orbital wave function of the molecule and the position of the atoms in the molecule.
Laser-induced tunneling and diffraction ex-ploit different parts of the ionizing electron wave packet. The fraction of the electron wave packet that is created while the field strength increases within an optical half-cycle departs directly and irrevocably from its parent ion. Only tunneling stands between the orbital and the electron detec-tor. The wave packet that is born while the field decreases returns to the ion where it can elas-tically scatter (diffract), inelaselas-tically scatter, or recombine to (interfere with) the orbital from which it was extracted (10). These three scatter-ing processes offer different perspectives on the molecule.
Tunneling, the process underlying all, probes the electronic structure of the neutral molecule. The recombination radiation, known as high-harmonic radiation, also measures the orbital structure of the neutral molecule (11). However, because high-harmonic generation starts with tunneling and ends with interference, these pro-cesses must be disentangled before the tech-niques can be generalized to complex orbitals. In contrast, elastic and inelastic scattering occur at the molecular ion. Inelastic rescattering is closely related to field-free collision physics (12, 13). It can cause multiple ionization and subsequently lead to Coulomb explosion of small molecules. The molecular structure can then be inferred from the momentum vectors of the correlated ionic fragments. Elastic scattering is also sensitive to the potential structure of the molecular ion. How-ever, here the molecular structure is encoded in the diffracting electron wave packet, making this imaging technique scaleable to more complex molecules.
For electron diffraction to be observable, the de Broglie wavelength of the electron needs to be on the order of the dimensions of the molecule. Small diatomic molecules have a bond length of ≈1 Å [1.9 atomic units (au)]. To obtain this wavelength, an electron would need a kinetic energy of 150 eV, corresponding to a momentum of 3.3 au. Electrons that are accelerated in the laser field and recollide with the parent molecule can easily reach this range of kinetic energies (10).
We recorded the momentum of electrons arising from tunneling ionization of aligned O2
and N2, employing a Cold Target Recoil Ion
Mo-1National Research Council of Canada, 100 Sussex Drive,
Ottawa, Ontario, Canada, K1A 0R6.2Institut für Kernphysik,
Johann Wolfgang Goethe Universität, Max-von-Laue Straße 1, D-60438 Frankfurt, Germany.3Institut National de la
Re-cherche Scientifique–Énergie, Matériaux et Télécommunication, 1650 boulevard Lionel-Boulet, Varennes, Québec, Canada, J3X 1S2.4Carl Zeiss SMT AG, Rudolf-Eber-Straße 2, 73447
Oberkochen, Germany.
*To whom correspondence should be addressed. E-mail: [email protected]
13 JUNE 2008 VOL 320 SCIENCE www.sciencemag.org 1478
REPORTS
on June 18, 2008
www.sciencemag.org
mentum Spectroscopy (COLTRIMS) system (14). COLTRIMS allows us to measure the 3D mo-mentum vectors of single electrons and ions in coincidence. This coincidence capability is used to measure both O2and N2simultaneously under
identical conditions by means of a gas mixture. It also allows us to eliminate any contribution to the electron spectra from inelastic scattering resulting in fragmentation or multiple ionization of the molecules. However, with monomolecular tar-gets, we achieve very similar results even without the ion-electron coincidence requirement. Finally, the coincidence measurement permits us to pick up weak fragmentation channels that provide information about the quality of our alignment [see supporting online material (SOM) text B].
Our laser pulse (800 nm) had a total energy of 5 mJ (split and used for both alignment and probing) and a repetition rate of 30 kHz. We align the molecules (15) using a slightly stretched (60 fs), moderately intense (≤8 × 10¹³W/cm2)
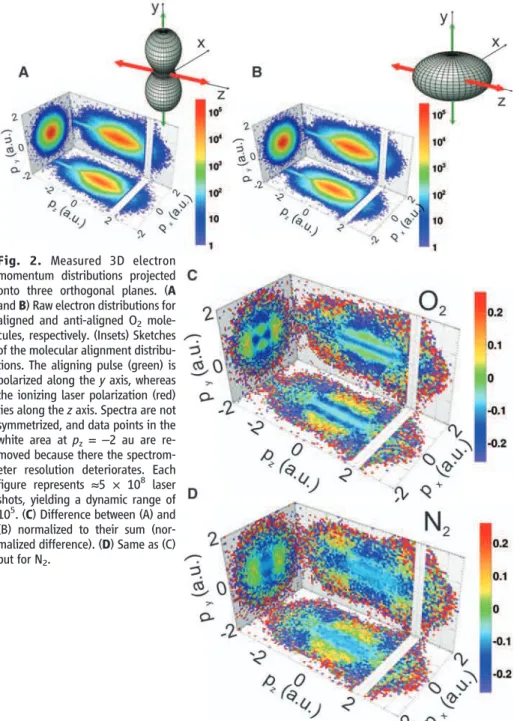
laser pulse. The intense (2.5 × 10¹⁴W/cm2), short (40 fs), ionizing pulse, which is applied after a delay, catches the molecule at any alignment that can be achieved with polarized light. Experimen-tally, aligning (pump) and ionizing (probe) pulses are perpendicularly polarized ( y axis and z axis in the inset of Fig. 2A, respectively). The pump pulse creates a rotational wave packet (15) that results in molecules aligned primarily along the y axis at a well-defined time delay (sketch in Fig. 2A). At a different time delay, the alignment dis-tribution will be confined in the xz plane (sketch in Fig. 2B). We refer to this complementary case as anti-alignment. A computerized delay stage moved between the respective pump-probe delays every 10 s (details in SOM text A and B).
The electron momentum distributions (Fig. 2) obtained for aligned (A) and anti-aligned (B) O2
molecules have been correlated with singly charged O2+ions. For display purposes, the distribution is
projected onto three planes. Most prominent in the figure is the large dynamic range in the dis-tribution. The color code covers five orders of magnitude. The rapid fall-off of the signal is so prominent that it is hard to discern anything else from the figure. The spectra for N2(fig. S1) are
qualitatively indistinguishable from those of O2.
Molecular specific structure arising from tunneling and diffraction is revealed when we employ normalized differences. The anti-aligned projections are subtracted from the aligned pro-jections and then divided by their sum. The nor-malized differences for O2and N2are plotted in
Fig. 2, C and D. Because the data are not symme-trized, the quadrant-to-quadrant reproducibility is a measure of the quality of the image.
The low lateral-momentum electrons (p⊥¼ ffiffiffiffiffiffiffiffiffiffiffiffiffiffiffi
p2xþ p2 y q
< 0:5 au, where p is momentum) exhibit clear patterns in the projection per-pendicular to the ionizing laser field. The vast majority of these electrons drift directly to the detector without further interaction with the
par-ent ion. They provide information on the ioniz-ing orbital, filtered by the tunnel. These electrons are equally evident in the other two projections. They are spread along the z direction between jpzj < 1:5 au, reflecting the fact that ionization can occur over a range of times within a field cycle.
Figure 3 presents an expanded view of the px-pyprojections of the electron momenta from
N2and O2and focuses on the central part of the
distribution. The very different distributions cre-ated by tunneling from O2and N2reflect the very
different structures of the respective ionizing or-bitals. In tunneling theory, the tunnel serves as a filter for the perpendicular component p⊥ of the orbital wave function. The tunneled wave packet then can be expressed as (in atomic units) (16–18)
Yðp⊥Þº〈p⊥jYi〉exp − ffiffiffiffi Ip p ffiffiffi 2 p Ep 2 ⊥ ! ð1Þ where the exponential factor is the filter func-tion. It contains the ionization potential Ipand
the electric field E of the ionizing laser pulse at the moment of tunneling. The exponential factor depends only weakly on the alignment of the molecule (through a weakly angular-dependent Stark-shift). Therefore, it is approx-imately cancelled in any ratio of two different alignments. However, the electronic wave function jYi〉is locked to the molecular frame, whereas p⊥is defined with respect to the laser-field
di-rection. Therefore, the alignment dependence of the projected wave function 〈p⊥jYi〉 is accen-tuated by taking ratios. We now show that this basic tunneling concept agrees with our experi-mental measurements.
Using the wave function for the HOMOs of N2and O2, we calculated the lateral electron
mo-mentum distributions (both shape and amplitude) that emerge from the molecules for each molec-ular alignment. The electrons are given initial conditions determined by tunneling and then clas-sically propagated in the field of a pulse identical to the experiment, taking into account the parent ion’s Coulomb potential (19, 20). Finally, each molecular alignment contributes to the predicted spectrum, according to its weight in the measured alignment or anti-alignment distribution. There are no free parameters in this model (described more fully in SOM text C). The results are shown in the bottom row of Fig. 3. The simulation re-produces the symmetry seen in the experiment. The model also shows that imperfect alignment causes the orbital’s footprint to disappear in the unnormalized spectra (Fig. 2, A and B). That is, the node is filled by the alignment distribution of ionizing molecules.
We now turn to the structures at higher elec-tron momenta (p⊥> 0:5 au) and (jpzj > 1:5 au) in Fig. 2, C and D. This region is dominated by electrons that have rescattered. In Fig. 2, C and D, the relative probability of finding an electron in
Fig. 1. (Top) Tunneling creates a filtered projection of the molecular orbital. Approximately half of the electron wave packet escapes directly to the detector. (Bottom) Remaining portion is driven back to the parent ion. Here, the central portion of the recolliding wave packet is shown diffracting from the molecule. The outer portions of the wave packet (not shown) weakly interact with the ion potential. The relative strength of each component depends on the filtered projection of the molecular orbital and therefore on molecular alignment.
www.sciencemag.org SCIENCE VOL 320 13 JUNE 2008 1479
REPORTS
on June 18, 2008
www.sciencemag.org
the momentum region pz= 2 au, py= 1.5 au in all
quadrants and at pz= 0 au, px= 1 au passes
through rather broad local maxima. There are corresponding minima at pz= 2 au, px= 1.5 au
and at pz= 0 au, py= 1 au. This structure contains
information on the scattering potential. That is, we experimentally observed LIED.
Interpreting an electron distribution such as this is different from interpreting conventional electron diffraction because of the presence of the laser field (17). We analyzed our data in analogy to the attosecond streak camera (21) to remove the influence of the laser field on the electron momentum after the scattering has occurred. The final, observed momentum of a scattered electron is p→
fin¼ p→recþ A→rec (17), where
A →
rec¼ ðE→0=wÞsin wtrec is the vector potential
defined by the electric field E→
ðtÞ ¼ E→0cosðwtÞ
of the probe pulse (here, w is the frequency of the light), and p→
recis the electron momentum
at the time trecof recollision. This analysis yields
a manifold of momentum spheres centered at pz= ±Arecwith radii prec. The maximum radius
prec,max corresponds to a recollision energy of
3.17Up[where Up¼ ðE0=2wÞ2is the
pondero-motive potential]. Slicing the momentum spheres at perpendicular planes defined by px≈0 and
py ≈ 0 yields diffraction circles such as those
illustrated in Fig. 4 (at left). Within each diffrac-tion circle, we can relate our results to conven-tional electron diffraction: ϕ is the scattering angle, and the radius of each circle is the elec-tron momentum or wavelength, l = h/prec
(where h is Planck’s constant), at which scat-tering occurs.
The four panels at right in Fig. 4 show the value of the measured electron distributions along diffraction circles of radius 1.4 au (blue), 1.2 au (red), and 1.0 au (black). Each curve is offset for clarity. Electrons in the range 0° < ϕ < 30° or 330° < ϕ < 360° are direct electrons and are not plotted in the figure (details in SOM text D).
Because the molecules were aligned along the y axis, the py-pzprojection is the most intuitive
plane in which to analyze diffraction. At a recol-lision momentum precof 1 au, the electron
wave-length l = 6.3 au is larger than twice the equilibrium bond length of O2(d = 2.3 au). However, numerical
simulations (22, 23) and experiments (24) have shown that the appropriate electron wavelength for diffraction is the wavelength at the core of the ion. That is, the recollision energy (corresponding to the radius of the diffraction circle) plus the ionization potential of the HOMO yield the appro-priate diffraction wavelength. With this assump-tion (l = 4.57 au), the first minimum at around 60° (and then at 300°) thus corresponds to a bond length of 2.6 au.
To help extend this interpretation, we turned to simulation (SOM text E). We used the prob-ability of recollision as a function of the angle between the molecule and the laser electric field and averaged over the alignment distributions. The electron recollision momentum is chosen by selecting a diffraction circle for analysis. We made
three final assumptions: (i) We assumed that the electron wavelength corresponds to the sum of recollision energy and the field free ionization energy. (ii) We assumed two-center diffraction. (iii) Because long trajectory electrons dominate, we concentrated on them. The resulting distribu-tions are shown in the solid curves in Fig. 4. Comparing the calculated and measured distribu-tions, we see that the modulation in the regions ϕ ≈50° – 150° and ϕ ≈ 210° – 310° arises from diffraction. The dashed lines highlight the shift of the diffraction maxima and minima with the electron wavelength. Electrons that backscatter through ϕ ≈ 180° are not properly described. They appear in the figure in the range ϕ ≈ 150° – 210°. The overall agreement in the positions of
the diffraction minima and maxima between sim-ulations and experiment is good, except for N2in
the px-pzplane, where the simulated diffraction
peaks appear shifted. This peak shift probably comes from an overestimation of the recollision probability for N2molecules oriented parallel to
the laser field in the model.
There are three reasons why we obtain agreement for most angles. First, using normal-ized differences makes the two-center scattering contribution highly visible while making our re-sults somewhat insensitive to details of the atom-ic contribution (25). Second, by concentrating on relatively high-energy electrons, we only need to consider the first recollision (9), keeping the electron trajectories relatively simple. Third,
al-Fig. 2. Measured 3D electron momentum distributions projected onto three orthogonal planes. (A and B) Raw electron distributions for aligned and anti-aligned O2
mole-cules, respectively. (Insets) Sketches of the molecular alignment distribu-tions. The aligning pulse (green) is polarized along the y axis, whereas the ionizing laser polarization (red) lies along the z axis. Spectra are not symmetrized, and data points in the white area at pz= –2 au are
re-moved because there the spectrom-eter resolution dspectrom-eteriorates. Each figure represents ≈5 × 10⁸ laser
shots, yielding a dynamic range of 105. (C) Difference between (A) and
(B) normalized to their sum (nor-malized difference). (D) Same as (C) but for N2.
13 JUNE 2008 VOL 320 SCIENCE www.sciencemag.org 1480
REPORTS
on June 18, 2008
www.sciencemag.org
though the screened Coulomb potential is not fully treated in our diffraction analysis, we add the most important aspect by augmenting the electron energy measured from the scattering circles by Ip(17, 22, 23).
We have demonstrated that multiphoton ion-ization in the tunneling limit gives extensive in-formation on the ionizing electronic orbital. If we rotate the molecule in small steps, all momenta from the wave function are sampled. We only need to select one angle for diffraction. This dif-fraction pattern reveals the interatomic dimensions of a molecule. Interestingly, the angle could be se-lected to favor recollision only from particular
elec-tronic configurations, allowing us to determine the structure of selected isomers or of excited states.
In a diffraction experiment, selecting a dif-ferent electron wavelength l changes the diffrac-tion pattern in the same way as a change in the internuclear separation d (sinϕ = nl/d, where n is the order of the diffraction peak). By showing that a 20% change in electron wavelength makes a measurable difference in the diffraction pattern, we indirectly demonstrate that vibrational or photo-chemical dynamics can be combined with LIED. Coincidence imaging allows us to use the charac-teristics of the correlated ion to select those events that we wish to analyze. Thus, LIED provides a
method to isolate structural changes of any excited state that impresses a distinct signature on the ion. In studies where coincidence imaging is unnecessary, employing a technology such as velocity map imaging (26, 27) would allow elec-tron spectra to be recorded using lasers with repetition rates as high as 136 MHz (28). Data of the same quality that we show could be obtained in milliseconds or less. Such a measurement is practical for any molecule that can be placed in the gas phase, provided that the strong field does not dislodge other electrons in an uncontrolled manner (29) and provided that the molecule can be aligned with sufficient precision.
Finally, we stand back and survey the emerg-ing strong-field technology for molecular imag-ing. Tunneling, one of the most fundamental of the quantum mechanical processes, initiates all of the methods. Information about the ionizing orbital of the neutral molecule is imprinted on the tunneled electron. A second perspective on the molecular orbital is contained in the high-harmonic radiation that is produced upon recol-lision. High-harmonic radiation has two major advantages over tunneling. First, by measuring photons rather than electrons the problem of space-charge is avoided. Second, if the tunneled wave packet is independent of the angle between laser-field and molecular axis, tomography provides a well-developed algorithm for invert-ing the image (11, 30). However, there is one major disadvantage: Tunneling and recombina-tion are entwined in the angle-dependent har-monic spectrum (31). This problem has so far limited the application of orbital tomography.
A complementary insight is achieved by laser Coulomb explosion imaging (32–34) We become sensitive to the position of the nuclei in a molecular ion. LIED supplies us with the means to overcome the limitations of Coulomb explosion imaging and
Fig. 4. Left panel is reproduced from Fig. 2C. Three color-coded diffraction circles are superimposed. The radius of the circle defines the recollision momentum prec(scattering wavelength); their width defines
the range of momenta that are analyzed; and ϕ is the scattering angle. The four plots at right show the angular distributions within the indicated
diffraction circles (see SOM text D for details). The color coding is preserved. Results of the simulations are superimposed as solid lines. The curves for recollision momentum of 1.0 au have no offset. For clarity, other curves are offset in units of 0.2. The data are shown with statistical error bars (1s).
Fig. 3. px versus py
projections of the nor-malized differences for O2 and N2. (Top)
Ex-perimental data (from Fig. 2). The color scale has been changed to em-phasize the low lateral-momentum structure near the center of each figure enclosed in the dashed circle. The low lateral momentum retains the symmetry of the HOMO (shown above). (Bottom) Magnified results of our simulation (see text).
www.sciencemag.org SCIENCE VOL 320 13 JUNE 2008 1481
REPORTS
on June 18, 2008
www.sciencemag.org
opens the pathway toward the imaging of larger molecules. Taken together, we can obtain a full picture of molecules. With the extension of these tools to pump-probe techniques, we will be able to simultaneously trace the temporal changes in the nuclear and electronic structure of molecules.
References and Notes
1. G. Binning, H. Rohrer, C. Gerber, E. Weibel, Phys. Rev. Lett. 49, 57 (1982).
2. J. Muth-Böhm, A. Becker, F. Faisal, Phys. Rev. Lett. 85, 2280 (2000).
3. X. Tong, Z. Zhao, C. Lin, Phys. Rev. A 66, 033402 (2002). 4. A. Alnaser et al., Phys. Rev. A 71, 031403 (2005). 5. D. Pavičić, K. Lee, D. Rayner, P. B. Corkum,
D. M. Villeneuve, Phys. Rev. Lett. 98, 243001 (2007). 6. T. Zuo, A. Bandrauk, P. B. Corkum, Chem. Phys. Lett.
259, 313 (1996).
7. H. Ihee et al., Science 291, 458 (2001). 8. B. J. Siwick, J. R. Dwyer, R. E. Jordan, R. J. D. Miller,
Science 302, 1382 (2003).
9. H. Niikura et al., Nature 417, 917 (2002). 10. P. B. Corkum, Phys. Rev. Lett. 71, 1994 (1993). 11. J. Itatani et al., Nature 432, 867 (2004).
12. A. Staudte et al., Phys. Rev. Lett. 99, 263002 (2007). 13. A. Rudenko et al., Phys. Rev. Lett. 99, 263003 (2007). 14. J. Ullrich et al., Rep. Prog. Phys. 66, 1463 (2003). 15. H. Stapelfeldt, T. Seideman, Rev. Mod. Phys. 75, 543 (2003). 16. N. B. Delone, V. P. Krainov, J. Opt. Soc. Am. B 8, 1207
(1991).
17. M. Spanner, O. Smirnova, P. B. Corkum, M. Ivanov, J. Phys. B 37, L243 (2004).
18. M. Ivanov, M. Spanner, O. Smirnova, J. Mod. Opt. 52, 165 (2005).
19. T. Brabec, M. Ivanov, P. B. Corkum, Phys. Rev. A 54, R2551 (1996).
20. D. Comtois et al., J. Phys. B 38, 1923 (2005). 21. J. Itatani et al., Phys. Rev. Lett. 88, 173903 (2002). 22. M. Lein, J. Marangos, P. Knight, Phys. Rev. A 66, 051404
(2002).
23. S. Yurchenko, S. Patchkovskii, I. Litvinyuk, P. B. Corkum, G. Yudin, Phys. Rev. Lett. 93, 223003 (2004). 24. D. Akoury et al., Science 318, 949 (2007). 25. M. Okunishi et al., Phys. Rev. Lett. 100, 143001
(2008).
26. C. Bordas, F. Paulig, H. Helm, D. Huestis, Rev. Sci. Instrum. 67, 2257 (1996).
27. A. Eppink, D. Parker, Rev. Sci. Instrum. 68, 3477 (1997). 28. I. Hartl et al., Opt. Lett. 32, 2870 (2007).
29. M. Lezius et al., Phys. Rev. Lett. 86, 51 (2001). 30. T. Kanai, S. Minemoto, H. Sakai, Nature 435, 470
(2005).
31. S. Baker et al., Science 312, 424 (2006), published online 1 March 2006; 10.1126/science.1123904. 32. F. Légaré et al., Phys. Rev. A 72, 052717 (2005). 33. T. Ergler et al., Phys. Rev. Lett. 97, 193001 (2006). 34. A. Alnaser et al., Phys. Rev. A 72, 030702 (2005). 35. We gratefully acknowledge financial support from the
Canadian Institute for Photonics Innovation, Natural Sciences and Engineering Research Council of Canada, Canadian Foundation for Innovation, Alexander-von-Humboldt Foundation, Deutsche Forschungsgemeinschaft, and the German Academic Exchange Service. P.B.C. acknowledges financial support from the Air Force Office of Scientific Research. M.M. thanks the German National Academic Foundation.
Supporting Online Material
www.sciencemag.org/cgi/content/full/320/5882/1478/DC1 SOM Text
Figs. S1 to S3 References
18 March 2008; accepted 16 May 2008 10.1126/science.1157980
Electrical Resistance of Long
Conjugated Molecular Wires
Seong Ho Choi, BongSoo Kim, C. Daniel Frisbie*
The charge transport mechanism of a wire can be revealed by how its electrical resistance varies with length. We have measured the resistance and current-voltage characteristics of conjugated molecular wires ranging in length from 1 to 7 nanometers, connected between metal electrodes. We observe the theoretically predicted change in direct-current transport from tunneling to hopping as a function of systematically controlled wire length. We also demonstrate that site-specific disruption of conjugation in the wires greatly increases resistance in the hopping regime but has only a small effect in the tunneling regime. These nanoscale transport measurements elucidate the role of molecular length and bond architecture on molecular conductivity and open opportunities for greater understanding of electrical transport in conjugated polymer films.
C
harge transport can occur through long, p-conjugated molecules (1–3), and the term “molecular wire” is often used to describe conjugated molecules in which charge transport is efficient over long distances (4, 5). For example, the b-carotene molecule can trans-fer electrons over tens of Angstroms (6). In the context of molecular electronics, where the ul-timate goal is the fabrication of circuitry based on the prescribed electronic function of individual molecules (4, 7), it is desirable to have a quan-titative definition of what constitutes a molecular wire.A fundamental property of a wire is the scaling of its resistance (or conductance) with length. The length dependence of resistance is a direct consequence of the charge transport
mech-anism. In the macroscopic world, the resistance of a metallic wire increases linearly with length as a result of the diffusive nature of carrier transport in the metal. However, this particular scaling need not hold for conduction in mole-cules over nanometer-length scales, as has been pointed out theoretically (8–10) and observed experimentally (2, 3, 11, 12). For short molecules (<3 nm) connected between metallic contacts, it is well-accepted that resistance scales exponen-tially with length according to Eq. 1.
R¼ R0expðbLÞ
where R is the junction resistance, R0is an
ef-fective contact resistance, L is molecular length, and b is the exponential prefactor that depends on the nature of bonding in the molecular back-bone. The exponential length dependence in Eq. 1 results directly from the transport mechanism in metal/molecule/metal junctions based on short mol-ecules, namely, direct (nonresonant) tunneling.
For longer molecules connected between metal electrodes, the scaling of resistance with
length can be anticipated by comparison to fundamental studies of electron transfer in solu-tion. Both theory and experiment on soluble donor-bridge-acceptor (D-B-A) systems (2, 3, 8, 11, 12) indicate that for long molecular bridges, the charge transport mechanism changes from direct tunneling to hopping, as evidenced by a change in the length dependence of the electron transfer rate constant. Specifically, for short bridges, the length dependence is exponential, corresponding to the tunneling regime, and for long bridges, the scaling is linear, as expected for hopping trans-port; in the experiments reported by Wasielewski and colleagues (2), the transition occurs when the conjugated bridge becomes longer than ~2.5 nm. The weaker length dependence associated with the hopping regime facilitates the transport of charge over greater distances, and it is this regime that might be considered most “wirelike,” although tunneling through saturated peptide bonds, for example, has also been shown to provide enhanced transport over relatively large distances in redox proteins (13, 14).
In the context of molecular electronics, it has been difficult to systematically examine the hopping regime in conjugated molecular wires connected to metallic contacts because of the relatively large range of molecular lengths re-quired (spanning many nanometers) and the complexities of adsorbing long molecules to metal surfaces while controlling orientation. Electrical transport measurements on molecules up to 18 nm in length have been reported (15), and charge hopping in molecular junctions has been observed (16–18), but the systematic length dependence of conduction has not been a prin-cipal focus.
Here, we provide direct evidence for a change in transport mechanism from tunneling to hop-ping in molecular junctions based on conjugated oligophenyleneimine (OPI) wires ranging in length from 1.5 to 7.3 nm. We contacted OPI Department of Chemistry and Department of Chemical
Engineering and Materials Science, University of Minneso-ta, Minneapolis, MN 55455, USA.
*To whom correspondence should be addressed: frisbie@ cems.umn.edu
(1)
13 JUNE 2008 VOL 320 SCIENCE www.sciencemag.org 1482
REPORTS
on June 18, 2008
www.sciencemag.org
Laser Induced Electron Tunneling and Diffraction
Supporting Online Material
-Supporting Text A: Materials and Methods
We determined the momentum vectors of electrons and ions in coincidence using COLTRIMS
(S1). Electrons and ions created in the laser focus were guided to separate time and position
sensitive microchannel plate detectors with delayline readout by weak electric (29.1 V/cm) and
magnetic (13.7 Gauss) fields. After an acceleration region of 68.5 mm, electrons entered an
electric field free drift tube with a length of
151.5 mm before reaching the detector (RoentDek
HEX80 (S2)). Ions were accelerated over a path of
148 mm onto a RoentDek DLD80 detector,
without passing through a field-free drift region. Both detectors had an active diameter of
80 mm.
We determined the following electron momentum resolutions:
∆p
x= ∆p
y= 0.2 au;
∆p
z= 0.36 au. The latter is measured as the FWHM of the center of mass momentum
distribu-tion of
O
+2
ions in the time of flight direction. The resolution in the x-y directions is calculated
from the respective detector resolutions since the center of mass momentum distributions are
dominated by the resolution of the ion momentum
1. To discriminate against false coincidences,
we only use events for electron spectra whose electron-ion center of mass momentum in the
time of flight direction (p
z) is no more than
±0.4 au.
Our jet contained, among other species, N
2and O
2at the same time. Therefore, oxygen and
nitrogen were measured under exactly the same conditions. The ion time of flight allows
iden-tification of the ion species and thereby determination of the origin of the measured electron.
The electrons in the spectra of Fig.2 are correlated to either
16O
+2or
14N
+2.
Supporting Text B: Molecular Alignment
We used the following pump-probe delays to align or anti-align molecules: O
2aligned 2.929 ps,
anti-aligned 8.726 ps; N
2, aligned 3.856 ps, anti-aligned 4.490 ps. Each delay was maintained
for ten seconds whereafter a computer-controlled delaystage moved to the next. Thereby a
1The center of mass momentum distributions (electron momentum + ion momentum) yield FWHM ∆p x =
2.6 au, ∆py= 4.4 au (jet direction) and pz= 0.36 au (time of flight direction).