Publisher’s version / Version de l'éditeur:
The Journal of Physical Chemistry C: Nanomaterials and Interfaces, 114, 32, pp.
13739-13745, 2010-07-26
READ THESE TERMS AND CONDITIONS CAREFULLY BEFORE USING THIS WEBSITE.
https://nrc-publications.canada.ca/eng/copyright
Vous avez des questions? Nous pouvons vous aider. Pour communiquer directement avec un auteur, consultez la première page de la revue dans laquelle son article a été publié afin de trouver ses coordonnées. Si vous n’arrivez pas à les repérer, communiquez avec nous à PublicationsArchive-ArchivesPublications@nrc-cnrc.gc.ca.
Questions? Contact the NRC Publications Archive team at
PublicationsArchive-ArchivesPublications@nrc-cnrc.gc.ca. If you wish to email the authors directly, please see the first page of the publication for their contact information.
NRC Publications Archive
Archives des publications du CNRC
This publication could be one of several versions: author’s original, accepted manuscript or the publisher’s version. / La version de cette publication peut être l’une des suivantes : la version prépublication de l’auteur, la version acceptée du manuscrit ou la version de l’éditeur.
For the publisher’s version, please access the DOI link below./ Pour consulter la version de l’éditeur, utilisez le lien DOI ci-dessous.
https://doi.org/10.1021/jp1034135
Access and use of this website and the material on it are subject to the Terms and Conditions set forth at
Molecular dynamics study of ionomer and water adsorption at carbon
support materials
Mashio, Tetsuya; Malek, Kourosh; Eikerling, Michael; Ohma, Atsushi;
Kanesaka, Hiroyuki; Shinohara, Kazuhiko
https://publications-cnrc.canada.ca/fra/droits
L’accès à ce site Web et l’utilisation de son contenu sont assujettis aux conditions présentées dans le site LISEZ CES CONDITIONS ATTENTIVEMENT AVANT D’UTILISER CE SITE WEB.
NRC Publications Record / Notice d'Archives des publications de CNRC:
https://nrc-publications.canada.ca/eng/view/object/?id=e0f8664e-92a9-4fa6-ae25-0e8aa91cf434 https://publications-cnrc.canada.ca/fra/voir/objet/?id=e0f8664e-92a9-4fa6-ae25-0e8aa91cf434Molecular dynamics simulations were applied to unravel the microscopic structure of Nafion ionomer and water adsorbed at graphitized carbon sheets. The considered molecular model resembles microscopic interfaces at which current generation proceeds in catalyst layers of polymer electrolyte fuel cells. The analysis of equilibrated interfacial configurations shows that Nafion ionomer forms a thin adhesive film on the graphite sheet. At low water content, water molecules form clusters around sulfonic acid groups. At high water content, a continuous water film wets the ionomer surface. The structural analysis of this model did not provide any evidence for interconnected water clusters existing inside the ionomer film, which implies that hydronium ion transport will occur mainly along hydrated ionomer surfaces.
Introduction
Polymer electrolyte fuel cells (PEFCs) are promising power sources for various applications such as automobiles, portable devices, and stationary power generators. The most significant hurdles to the large scale commercialization of PEFC technology include reduction of cost, improvement of power density and enhancement of durability.1-4
Improving the structural design of membrane electrode assemblies (MEAs) that consist of a polymer electrolyte membrane (PEM), catalyst layers (CLs), microporous layers (MPLs), and gas diffusion layers (GDLs) is central to solving these issues.4-6 Particularly, the cathode CL is the crucial
component in which multicomponent transport phenomena and electrochemical conversion take place. Fuel cell CLs are random porous media that are directly attached to the PEM. They generally consist of Pt nanoparticles randomly dispersed on highly porous, electron-conducting support materials, and a proton-conducting ionomer that impregnates the pore space. Support materials are usually made of carbon materials because of their high electronic conductivity and acid tolerance.7-12
Nafion, a sulfonated tetrafluoroethylene copolymer, is the primary choice as the proton-conducting ionomer in CLs.
Pt loadings of current CL designs incur a major portion of the material costs in PEFC. Lowering the Pt loading is desirable, but it should not affect the power density. Reducing the Pt loading as a result of improving the Pt utilization is essential to achieve cost reduction without sacrificing power density.
To design highly performing and inexpensive CLs, it is of vital importance to understand the relationships among fabrica-tion parameters, material parameters, physicochemical proper-ties, self-organized microstructures, and performance. There is a lack of understanding of how material properties and performance are correlated in these complex media, mostly
because of the difficulties of measuring them directly in operating CLs. For example, the morphology of the ionomer subphase and its impact on the transport properties is still controversial. According to experimental observations by More et al., the ionomer morphology can be classified into three types: well-dispersed thin film layers on the surface of carbon supports and Pt particles, separate uncorrelated domains of ionomer agglomerates and Pt/C agglomerates, and rodlike fibrils bridging between Pt/C agglomerates.13 The morphologies differ in
adhesion strength between Pt/C surfaces and ionomer. In any case, it should be noted that the morphology of ionomer at the carbon surface is completely different from the phase-segregated random morphology of water-filled PEMs.14-16
The structure and distribution of water in CLs has also been elusive. Several efforts have been undertaken to analyze the amount and the state of water in CLs during fuel cell operation. The main limitation is the insufficient resolution of the pertinent methods.17,18Neutron radiography is nowadays employed for
the in situ detection of water in operating fuel cells. The resolution reported by Boillat et al. is 2.5µm, which allows detecting and quantifying liquid water in flow fields, GDLs, and across MEAs.17However, this resolution is too coarse to
determine the detailed map of the water distribution in CLs. Typical thicknesses of CLs are in the range of 10 µm, with pore sizes in the range of 2-50 nm, which is far below the resolution of neutron radiography.
The difficulty in quantifying the amount of water in CLs in experiment has led researchers to predict the amount and distribution of water in CLs using models of structure and processes.19-27Many assumptions have been made due to the
lack of experimental evidence. The water uptake isotherm of the Nafion membrane was used to describe water uptake properties of Nafion ionomer in CLs.19-24The transport
proper-ties of water and protons were inferred from the values for the Nafion membrane,19-27as well. These assumptions are largely
uncorroborated since the morphology of the ionomer in CLs and the water uptake and distribution in CLs are different from those in the Nafion membrane.
* Corresponding author. Phone: 5329. Fax: +81-46-867-5332. E-mail: t-mashio@mail.nissan.co.jp.
†Nissan Motor Co., Ltd.
‡National Research Council Canada Institute for Fuel Cell Innovation. §Simon Fraser University.
10.1021/jp1034135 2010 American Chemical Society Published on Web 07/26/2010
Another contentious issue is the wetting properties of pore surfaces in the cathode CL (CCL). Water distribution in the CCL determines the interplay of transport properties and electrochemical conversion. As discussed in refs 26 and 27, the CCL controls the water fluxes to PEM and MPL sides, and it acts as an efficient medium for the vaporization exchange in PEFC. Moreover, full flooding of the CCL accompanied by a significant drop in fuel cell voltage could occur at normal operating current densities of the fuel cell. Understanding the interplay among composition, porous structure, heterogeneous wetting properties, and operating conditions is crucial for determining the distribution, fluxes, and transformation of water in CCL. For further improvements of performance models, it is, therefore, vital to understand the structure of interfaces and the heterogeneous wettability in CCL.19,23,26,27
Molecular dynamics (MD) simulations provide valuable insights into microscale structure and transport properties of CLs.28-32Malek et al.28 introduced a model based on
coarse-grained molecular dynamics to study the self-organized micro-structure in CLs. The simulation led to a phase segregated structure consisting of agglomerated carbon particles surrounded by ionomer, water clusters, and solvent. Ionomer formed a randomly interconnected proton-conducting network. They found that ionomer domains did not penetrate into the carbon agglomerates. Several MD studies have also been applied to explore structure and transport properties in simplified model systems.
The model system considered by Liu et al.29 employed a
hydrated Nafion membrane and a Pt or graphitized carbon sheet attached to it. They found that the surface of the Pt sheet attached to the Nafion membrane was covered with adsorbed Nafion fragments, but there was no wetting and Nafion adsorption on the graphite surface. Since they studied the Nafion fragments detachment from the Nafion membrane and adhesion on the Pt or graphite sheet, their findings are limited to the interface between the Nafion membrane and Pt/C surfaces.
Balbuena et al.30,31investigated the transport of oxygen and
water at the interface between hydrated Nafion ionomer and a graphitized carbon sheet decorated with Pt particles. They observed that Nafion ionomer and water adsorbed on the surface of the Pt particles. Oxygen permeability through a Nafion-water layer covering the Pt surface was slightly lower than that in bulk water due to the difference in the environment. They focused in particular on the effect of Pt particles on the morphology and transport properties and did not consider the influence of the type of carbon material.
Iden et al.33measured the effects of different carbon supports
on the proton conductivity for pseudo catalyst layers sandwiched
between two Nafion membranes. They found that the pseudo CLs with the carbon support that had lower surface area and less surface groups showed higher proton conductivity. This alludes to the important influence of the surface properties of carbon support materials on proton transport.
Here, we present a model study of ionomer and water adsorption on a graphitized carbon sheet, employing atomistic molecular dynamics simulations. In the present work, we did not explicitly investigate the effect of Pt particles. We analyzed the morphology of Nafion ionomer and water at the graphite surface obtained after annealing and optimization runs. There-after, for the structures obtained, we investigated the transport of water and hydronium ions. Finally, we explored the effect of functionalizing the graphitized carbon sheet with ionized or un-ionized carboxyl groups on structure and transport properties.
Methodology
Interfacial Model. Carbon black is the primary choice as the electron-conducting catalyst support material in PEFC.7-12
It provides high electronic conductivity, chemical stability under acidic conditions, and high dispersion of Pt particles due to the high surface area. However, the effects of the support material on structure and transport properties in CLs are still not well understood.
As a starting point for systematic calculations of adsorption at carbon support materials, we employed a graphitic carbon sheet consisting of 8192 carbon atoms with size 13.64 × 15.748 nm2, as shown in Figure 1. A simulation box was constructed
with the graphite sheet as the x-y basal plane and with 50 nm thickness in the z direction. The size of the simulation box in the x-y direction is the same as the graphite sheet. Periodic boundary conditions were applied in x, y, and z directions.
To investigate the effect of surface properties of the carbon support,34-36 we introduced surface functional groups at the
graphite sheet. Two extreme cases, 64 adsorbed surface groups of carboxyl (COOH) and carboxylate (COO
-), were simulated, as shown in Figure 1b and c, respectively. We assumed uniform distributions of the groups on the graphite surface. Throughout this study, the structures of graphite sheets were frozen at their initial configurations.
The chemical formula of Nafion ionomer simulated in the present work is shown in Figure 2. The equivalent weight is assumed to be 1100 g of dry polymer per mole of sulfonic acid groups. The monomeric unit of Nafion ionomer was repeated 20 times to form a chain with length of ∼12 nm. In MD simulations, sulfonic acid head groups at the polymer side chains are assumed to be fully ionized. Each simulated system included
Figure 1. Illustration of graphitized carbon sheet (a), graphitized carbon sheet functionalized with carboxyl groups (COOH) (b), or carboxylate groups (COO
-) (c-).
12 Nafion oligomers. For charge neutrality, 240 hydronium ions were added. In this work, which relies entirely on classical atomistic molecular dynamics, excess protons reside in hydro-nium ions, which are not allowed to undergo any molecular transformations involving proton transfer. The only mechanism of proton transport permitted is the classical diffusion of hydronium ions. Proton transport via the structural diffusion mechanism of a protonic defect was not evaluated.37 In
simulations including carboxylate groups, 64 additional hydro-nium ions were added. To investigate the effect of the amount of Nafion, we also considered systems with 6 and 24 Nafion oligomers at the bare graphite sheet. The water content in the systems was set to correspond to the total number of water molecules per sulfonic acid groups ofλ ) 22, 15, 10, and 5. The corresponding total numbers of water molecules in the simulation box are given in Table 1.
Force Field Parameters. The general amber force field (GAFF)38,39was employed for the nonbonding, bonding, angle,
and torsion potentials of Nafion chains, functional groups, and a graphite sheet. Partial charges, Lennard-Jones, bonding, and angle potentials for Nafion chains of GAFF were taken from the work by Venkatnathan et al.,40and torsion potentials were
taken from the work by Urata et al.41SPC/E model was used
to represent water molecules.42Excess protons are assumed to
exist in the form of hydronium ions. The partial charges and the force field parameters of hydronium ions were taken from the work of Kusaka et al.43
MD Simulation. Simulation systems were prepared by placing Nafion ionomer, hydronium ions, and water molecules on top of the graphite sheets.λ in the initial configurations was set to 40. The corresponding total number of water molecules is given in Table 1. To blend all components and obtain the random initial configurations for the MD simulation, an an-nealing was repeatedly conducted for an NVT ensemble of the specified composition, including four main steps: (1) an initially prepared configuration was heated from 300 to 800 K over a period of 50 ps; (2) the final structure obtained from step 1 was used to initialize an MD simulation at 800 K for 50 ps; (3) the final structure obtained from step 2 was cooled from 800 to 300 K over a period of 50 ps; and (4) an MD simulation was performed at 300 K for 50 ps. The temperature was maintained with a Berendsen thermostat. With the resulting configuration from step 4, step 1 was reinitialized and the procedure was started all over again. Overall, steps 1-4 were repeated three
times. After this annealing process, a number of randomly selected water molecules were removed to obtain the desired water content.
For each system, MD production runs (NVT) were performed at 300 K for 10 ns. In all cases, the last 5 ns of the MD simulations were used for the analysis of structural conforma-tions and transport properties.
Bulk Ionomer Model. For the sake of comparison, a pure ionomer system was also simulated. The simulation system included 12 Nafion oligomers with 240 hydronium ions for charge neutrality. The water content (λ) was set to 22, 15, 10, and 5. The number of water molecules was specified in Table 1. The simulation procedure was the same as in the calculation of the interfacial system with the graphite sheet, except that MD simulations were performed in an NPT ensemble at 1 atm after annealing.
Results and Discussion
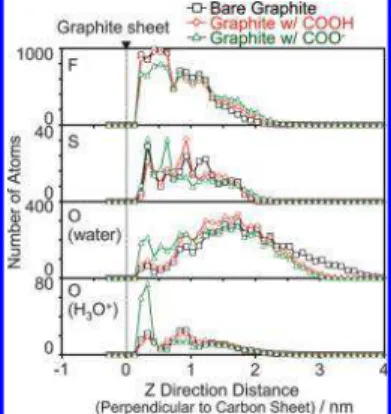
A. Structure of Nafion and Water near the Graphitized Carbon Sheet.Distributions of fluorine atoms and sulfur atoms in Nafion, oxygen atoms in water and oxygen atoms in hydronium ions in the z direction are shown in Figure 3. The thickness of the ionomer film (i.e., F and S atom distributions) is ∼2 nm and independent of the water content. Water molecules are distributed mainly on the surface of this film. The number of water molecules on the graphite sheet remains constant at small value. The hydronium ions are distributed close to sulfur atoms due to strong electrostatic interactions.
Snapshots of the interfacial region at the bare graphite sheet are shown in Figure 4. Nafion ionomer is dispersed well on the graphite sheet. Atλ ) 5, water forms small disconnected clusters around sulfonic acid groups. Water forms larger islands atλ ) 22. The largest water droplet is ∼5.6 nm in diameter and 1.8 nm in thickness. Even atλ ) 22, small isolated water clusters remain, and the connectivity of water clusters is still poor. Because of the hydrophobic nature of the graphite sheet and ionomer backbones, Nafion ionomer interacts with the graphite sheet mainly via the backbone, whereas side chains are oriented away from the graphite sheet, adsorbing water as shown in Figure 4b. The free surface of the Nafion is, therefore, predominantly hydrophilic. Tentatively, we could identify this with a layered structure in which a thin adhesive film of Nafion ionomer adsorbs on the surface of the graphite sheet, and water adsorbs to the outer surface of the ionomer. This structural picture agrees with that proposed by Masuda et al.44 They
investigated the structure of adsorbed Nafion ionomer on a highly oriented pyrolytic graphite (HOPG) by in situ tapping
no. of hydronium ions 120 120 120 120 120 12 Oligomers
no. of water molecules 960 2160 3360 5040 9360 no. of hydronium ions 240 240 240 240 240
24 Oligomers
no. of water molecules 1920 4320 6720 10080 18720 no. of hydronium ions 480 480 480 480 480
Figure 3. Number of fluorine atoms and sulfur atoms in Nafion, oxygen atoms in water, and oxygen atoms in hydronium ions in the z direction, which is perpendicular to the graphitized carbon sheet.
mode atomic force microscope (AFM). They determined a thin Nafion film with a height of less than 2 nm on HOPG surface. Figure 5 shows final snapshots of the systems with varying amounts of Nafion ionomer at λ ) 22. Upon increasing the ionomer content, Nafion coverage and the ionomer film thick-ness increase. The water morphology is significantly affected by the amount of Nafion ionomer. For small amounts of ionomer (6 oligomers) in panel a, water clusters are small, disconnected, and well-dispersed on the surface. At the high ionomer content (24 oligomers) in panel c, water forms continuously intercon-nected clusters on the surface of the ionomer.
The distributions of F, S, O (water), and O (hydronium ions) in the z direction in systems with different Nafion amounts are shown in Figure 6. The fraction of F atoms near the surface of the graphitized carbon sheet increases with increasing amounts of Nafion ionomer. This indicates that the increasing Nafion
content enhances the compactness of the ionomer film. More-over, the thickness of the Nafion film increases with an increasing amount of ionomer, as can be seen in the distribution profiles of F and S in Figure 6. Less water is adsorbed on the surface of the graphite sheet with 12 or 24 Nafion oligomers, as shown in the O (water) profiles in Figure 6, since the compact layer of Nafion ionomer reduces the accessible surface of the graphite sheet, and moreover, water is preferably adsorbed at sulfonic acid groups, which are oriented away from the graphite surface.
B. Transport Properties of Hydronium Ions and Water near the Bare Graphite Sheet. On the basis of the layered interfacial morphology, it is evident that the size, distribution, and connectivity of water clusters on the surface of the Nafion ionomer should play an important role in the hydronium ion transport. We calculated the average residence time ratios with respect to total analysis time of hydronium ions in the vicinity of sulfonic acid sites by assuming the contact distance between an O (hydronium) and S as 3.5 Å, which is the first coordination shell of hydronium ions around anionic head groups that represent ionomer side chains. This property depends on effective interactions between anionic head groups and hydro-nium ions. A high residence time indicates low mobility of hydronium ions as a result of their strong electrostatic interac-tions with fixed anionic head groups. The residence time ratios as a function of water content are shown in Figure 7. At lowλ, the difference in the residence time between interfacial systems and the bulk membrane is minor. This suggests that the mobility of protons is controlled by similar interfacial effects. The difference becomes more pronounced at highλ. The average minimum distance between neighboring sulfonic acid groups increases as a function ofλ as shown in Figure 8. The distance is expanded withλ due to the increase of the amount of adsorbed
Figure 4. Final snapshots of the Nafion morphology of 12 oligomers in the vicinity of the bare graphite sheet at λ ) 5 (a) and λ ) 22 (b). Backbones (gray beads), side chains (green beads), water (orange beads), and hydronium ions (white/red beads) are visualized. Sulfonic acid groups (red/yellow beads) are visualized in the side view only.
Figure 5. Final snapshots of the systems atλ ) 22 in the presence of 6 (a), 12 (b), and 24 oligomers (c). The coloring is the same as that in Figure 4.
Figure 6. Number of fluorine and sulfur atoms in Nafion, oxygen (O) atoms in water, and oxygen (O) atoms in hydronium ions in the z direction atλ ) 22.
water at anionic head groups. A high density of anionic head groups might enhance surface proton transport due to reduced Coulomb barriers between neighboring groups. To evaluate the long-range mobility, we calculated the self-diffusion coefficients of water and hydronium ions using
We used the time period from 2 to 5 ns of the last 5 ns of MD simulations to calculate the self-diffusion coefficients. The self-diffusion coefficients of hydronium ions and water atλ )
22 are provided in Table 2. A low diffusion coefficient of water is observed in the system with 6 Nafion oligomers. Once water forms connected and large clusters in the system with 24 Nafion oligomers, the diffusion coefficient significantly increases. Even in the case with 24 Nafion oligomers, the diffusion coefficient of water is still lower than that of bulk water (2.4 × 10⁻⁵
cm2s-1
).42 This indicates that electrostatic interactions with
sulfonic acid groups or hydronium ions limit the water mobility, even if a continuous water cluster has been established. The diffusion coefficients of hydronium ions in the interfacial systems are lower than that in the bulk membrane. As suggested by the comparison of residence time, the lower electrostatic interaction between sulfonic acid groups and hydronium ions in the bulk membrane compared to the interfacial systems could result in the higher self-diffusion coefficient of hydronium ions.
C. Effect of Surface Groups.Figure 9 shows equilibrated structures for the graphite sheet with the functional surface groups atλ ) 22. In the presence of functional groups, Nafion forms thin film structures similar to what is observed on the bare graphite sheet. The main difference is in the water morphology. In the case with the ionized functional groups, water is more dispersed and less connected on the surface of Nafion ionomer. Figure 10 shows the number of F and S in Nafion ionomer, O (water), and O (hydronium ions) along the
zdirection for the system containing the bare graphite sheet and systems containing the graphite sheet with adsorbed functional groups. Ionized functional surface groups increase the ability of the graphite sheet to adsorb water and hydronium ions, as indicated by the increased number of O (water) and O (hydronium ions) near the graphite surface. The number of sulfonic acid sites in the vicinity of the graphite sheet with the ionized functional groups increases, as well. Correspondingly, hydrophobic parts of the ionomer are redistributed, with
Figure 8. Average minimum distance between neighboring sulfonic acid groups at different ionomer contents.
TABLE 2: Diffusion Coefficients of Hydronium Ions (DH) and Water (DW) at Various Number of Oligomers at λ ) 22
system DH cm2s-1 DW cm2s-1 interfacial system 6 oligomers 0.112 × 10⁻⁵ 0.157 × 10⁻⁵ 12 oligomers 0.102 × 10⁻⁵ 0.369 × 10⁻⁵ 24 oligomers 0.105 × 10⁻⁵ 0.964 × 10⁻⁵ bulk membrane 0.123 × 10⁻⁵ 0.600 × 10⁻⁵
Figure 9. Final snapshots of the systems with 12 oligomers atλ ) 22 with the bare graphite sheet (a), COOH (b), and COO
-(c). The coloring is the same as that in Figure 4.
Figure 10. Number of fluorine and sulfur atoms in Nafion, oxygen atoms in water, and oxygen atoms in hydronium ions in the z direction in the system with 12 oligomers atλ ) 22.
D ) (|r(t) - r(0)|
2)
decreasing amounts near the graphite surface and increasing amounts on the outer ionomer surface at a distance 2 nm away from the graphitized carbon sheet. The effect of the carboxyl (COOH) groups on Nafion and water distributions in the z direction is negligible as compared with the effect of carboxylate (COO
-) groups.
Average numbers of the residence time ratios, self-diffusion coefficients of hydronium ions and water, and average distance between neighboring sulfonic acid groups atλ ) 22 for systems with and without surface functional groups are summarized in Table 3. When the ionized functional groups are applied to the surface of the graphitized carbon sheet (Figure 9c), the mobility of the hydronium ions becomes lower than for the bare graphite sheet (Figure 9a). In the case with ionized functional groups, water is more dispersed and less connected on the surface of the Nafion ionomer. At the same time, the number of hydronium ions in the vicinity of the graphitized carbon sheet increases due to the strong interaction with the ionized functional groups. These two factors, the decreased water cluster size and increased electrostatic attraction between hydronium ions and sulfonic acid sites, could result in the longer residence time and lower self-diffusion coefficient of hydronium ions. A low self-diffusion coefficient of water is observed in the system with the ionized functional groups due to the reduced size and connectivity of water clusters. In contrast, the effect of un-ionized functional groups on transport properties is minor, since they do not significantly affect Nafion ionomer and water morphology.
D. Impact on Structures and Properties of CLs.Although a simple model was applied to represent surface properties of the carbon supports, our simulation results can provide useful insights in view of structure and properties of CLs. Our results indicate that Nafion ionomer is predominantly adsorbed on the graphitized carbon sheet via the backbone, and the side chains face toward the pore space. Therefore, when the surface of the carbon support is graphitized, many sulfonic acid groups will be oriented toward the interior pore space. The surface wetta-bility of the pores in CLs depends on the number of hydrophobic backbones, the number of hydrophilic sulfonic acid groups, and the surface area of carbon supports exposed to the pore. Therefore, the interfacial packing density of the sulfonic acid groups that face toward the pore space could have significant impact on the surface properties of pores in CLs.
The number of sulfonic acid groups that point outwardly from the interface toward the free space depends on the surface properties of the carbon supports. In other words, fewer anionic surface groups face toward the pore space when the carbon support surface is more hydrophilic. This reorientation of anionic surface groups could make pore surfaces in CLs more hydro-phobic. The existence of Pt particles may have a large effect on the structures of Nafion ionomer. The effect of Pt particles will be clarified in our future work.
Our results indicate that water is adsorbed mainly on the hydrophilic surface of the ionomer. The morphology of the adsorbed water, such as size or connectivity of water clusters, might be affected by the surface properties of the carbon
supports. According to our simulations, the structure and distribution of the adsorbed water plays an important role for the transport properties. Consequently, the structure and surface properties of carbon supports will affect the transport properties of proton and water. Specifically, the functionalization of carbon supports might not enhance proton conductivity in CLs. This aspect can, in part, explain how different carbon supports could lead to different proton conductivities in the work by Iden et al.33They found that the pseudo CLs with the carbon support
that had more surface groups showed a lower proton conductiv-ity. The difference of water structure and distribution in CLs as a result of the difference in the carbon surface wettability could exert a significant influence on the proton conductivity in their work.
Conclusions
The morphology of Nafion ionomer and water on graphitized carbon sheets was examined by using molecular dynamics simulations. Nafion ionomer in the vicinity of the graphite carbon sheet is dispersed well and forms a thin film structure. Nafion ionomer molecules are attached to the graphite sheet mainly via the backbone, whereas side chains are predominantly oriented away from the graphite sheet. This results in a hydrophilic external Nafion surface. At low water content, water forms small isolated clusters around sulfonic acid groups. At high water content, water starts to form large connected water clusters on the surface of the ionomer film. No swelling was observed in the thin adhesive Nafion film. The electrostatic interaction between sulfonic acid groups and hydronium ions strongly affect hydronium ion mobility. The self-diffusion coefficient of water is restricted by the electrostatic interactions. It also depends on water cluster size and connectivity. The surface properties of the graphite sheet affects the morphology of the Nafion ionomer and water. When ionized functional groups are applied on the graphite surface, the size of the water clusters becomes smaller as compared with that on the bare graphite sheet. The number of water molecules, hydronium ions, and sulfonic acid groups in the vicinity of the graphite sheet increases with application of the ionized functional groups. This makes the external surface of Nafion ionomer less hydrophilic.
Acknowledgment.We gratefully acknowledge the Nissan-IFCI collaboration program.
References and Notes
(1) Frenette, G.; Forthoffer, D. Int. J. Hydrogen Energy 2009, 34, 3578. (2) Chalk, S. G.; Miller, J. F. J. Power Sources 2006, 159, 73. (3) Wee, J. H. Renewable Sustainable Energy ReV. 2007, 11, 1720. (4) Mock, P.; Schmid, S. A. J. Power Sources 2009, 190, 133. (5) James, B. D.; Kalinoski, J. A. Mass Production Cost Estimation for Direct H2PEM Fuel Cell Systems for Automotive Applications: 2008; Update DOE Fuel Cell Technical Publications, 2009.
(6) Sinha, J.; Lasher, S.; Yang, Y.; Kopf, P. Direct Hydrogen PEMFC Manufacturing Cost Estimation for Automotive Applications: Fuel Cell Tech Team Review; DOE Fuel Cell Technical Publications, 2008.
(7) Watanabe, M.; Tomikawa, M.; Motoo, S. J. Electroanal. Chem.
1985, 195, 81.
TABLE 3: Residence Time Ratios (RT), Diffusion Coefficients of Hydronium Ions (DH) and Water (DW), and Average Minimum Distance between Neighboring Sulfonic Acid Groups (MDS) in the Systems with 12 Oligomers at λ ) 22
systems RT % DH cm2s-1 DW cm2s-1 MDS nm
interfacial system
bare graphite sheet 71.1 0.102 × 10⁻⁵
0.369 × 10⁻⁵ 0.59
graphite sheet with COOH 67.1 0.104 × 10⁻⁵ 0.347 × 10⁻⁵ 0.57
graphite sheet with COO
-76.8 0.075 × 10⁻⁵
0.131 × 10⁻⁵ 0.64
bulk membrane 56.5 0.123 × 10⁻⁵ 0.600 × 10⁻⁵ 0.66
Scherer, G. G.; Wokaun, A.; Ichikawa, Y.; Tasaki, Y.; Shinohara, K.
Electrochem. Commun. 2008, 10, 546.
(18) Hickner, M.; Siegel, N. P.; Chen, K. S.; Hussey, D. S.; Jacobson, D. L.; Arif, M. J. Electrochem. Soc. 2008, 155, B427.
(19) Weber, A. Z.; Newman, J. J. Electrochem. Soc. 2005, 152, A677. (20) Liu, G.; He, W.; Nguyen, T. V. J. Electrochem. Soc. 2004, 151, A1999.
(21) Jaouen, F.; Lindbergh, G.; Sundholm, G. J. Electrochem. Soc. 2002,
149, A437.
(22) Berg, P.; Novruzi, A.; Volkov, O. J. Fuel Cell Sci. Technol. 2008,
5, 021007-1.
(23) Pasaogullari, U.; Wang, C.-Y. J. Electrochem. Soc. 2005, 152, A380.
(24) Mukherjee, P. P.; Wang, C.-Y. J. Electrochem. Soc. 2006, 153, A840.
(25) Bernardi, D. M.; Verbrugge, M. W. AIChE J. 1991, 37, 1151. (26) Eikerling, M. J. Electrochem. Soc. 2006, 153, E58.
(27) Liu, J.; Eikerling, M. Electrochim. Acta 2008, 53, 4435.
(37) Eikerling, M.; Kornyshev, A. A.; Spohr, E. AdV. Polym. Sci. 2008,
215, 15.
(38) Wang, J.; Cieplak, P.; Kollman, P. A. J. Comput. Chem. 2000, 21, 1049.
(39) Wang, J.; Wolf, R. M.; Caldwell, J. W.; Kollman, P. A.; Case, D. A. J. Comput. Chem. 2004, 25, 1157.
(40) Venkatnathan, A.; Devanathan, R.; Dupuis, M. J. Phys. Chem. B
2007, 111, 7234.
(41) Urata, S.; Irisawa, J.; Takada, A.; Shinoda, W.; Tsuzuki, S.; Mikami, M. J. Phys. Chem. B 2005, 109, 4269.
(42) Berendsen, H. J. C.; Grigera, J. R.; Straatsma, T. P. J. Phys. Chem.
1987, 91, 6269.
(43) Kusaka, I.; Wang, Z.-G.; Seinfeld, J. H. J. Phys. Chem. 1998, 108, 6829.
(44) Masuda, T.; Naohara, H.; Takakusagi, S.; Singh, P. R.; Uosaki, K.
Chem. Lett. 2009, 38, 884. JP1034135