Publisher’s version / Version de l'éditeur:
Vous avez des questions? Nous pouvons vous aider. Pour communiquer directement avec un auteur, consultez la première page de la revue dans laquelle son article a été publié afin de trouver ses coordonnées. Si vous n’arrivez pas à les repérer, communiquez avec nous à [email protected].
Questions? Contact the NRC Publications Archive team at
[email protected]. If you wish to email the authors directly, please see the first page of the publication for their contact information.
https://publications-cnrc.canada.ca/fra/droits
L’accès à ce site Web et l’utilisation de son contenu sont assujettis aux conditions présentées dans le site LISEZ CES CONDITIONS ATTENTIVEMENT AVANT D’UTILISER CE SITE WEB.
World Energy Engineering Congress [Proceedings], pp. 1-9, 2007-08-15
READ THESE TERMS AND CONDITIONS CAREFULLY BEFORE USING THIS WEBSITE. https://nrc-publications.canada.ca/eng/copyright
NRC Publications Archive Record / Notice des Archives des publications du CNRC :
https://nrc-publications.canada.ca/eng/view/object/?id=29c2b346-c208-411f-b30c-14465f617505 https://publications-cnrc.canada.ca/fra/voir/objet/?id=29c2b346-c208-411f-b30c-14465f617505
NRC Publications Archive
Archives des publications du CNRC
This publication could be one of several versions: author’s original, accepted manuscript or the publisher’s version. / La version de cette publication peut être l’une des suivantes : la version prépublication de l’auteur, la version acceptée du manuscrit ou la version de l’éditeur.
Access and use of this website and the material on it are subject to the Terms and Conditions set forth at
Residential total energy system installation at the Canadian Centre for
Housing Technology
Gusdorf, J.; Douglas, M. A.; Szadkowski, F.; Limouse, E.; Manning, M. M.;
Swinton, M. C.; Yang, L.
http://irc.nrc-cnrc.gc.ca
R e s i d e n t i a l t o t a l e n e r g y s y s t e m i n s t a l l a t i o n
a t t h e C a n a d i a n C e n t r e f o r H o u s i n g
T e c h n o l o g y
N R C C - 5 0 2 7 3
G u s d o r f , J . ; D o u g l a s , M . A . ; S z a d k o w s k i , F . ;
L i m o u s e , E . ; M a n n i n g , M . M . ; S w i n t o n , M . C . ; Y a n g ,
L .
A version of this document is published in / Une version de ce document se trouve dans: World Energy Engineering Congress, Atlanta, GA., Aug. 15-17, 2007, pp. 1-9
The material in this document is covered by the provisions of the Copyright Act, by Canadian laws, policies, regulations and international agreements. Such provisions serve to identify the information source and, in specific instances, to prohibit reproduction of materials without written permission. For more information visit http://laws.justice.gc.ca/en/showtdm/cs/C-42
Les renseignements dans ce document sont protégés par la Loi sur le droit d'auteur, par les lois, les politiques et les règlements du Canada et des accords internationaux. Ces dispositions permettent d'identifier la source de l'information et, dans certains cas, d'interdire la copie de documents sans permission écrite. Pour obtenir de plus amples renseignements : http://lois.justice.gc.ca/fr/showtdm/cs/C-42
RESIDENTIAL TOTAL ENERGY SYSTEM INSTALLATION AT THE CANADIAN CENTRE FOR HOUSING TECHNOLOGY
John Gusdorf1, Mark A. Douglas1, Frank Szadkowski1, Edouard Limouse2, Marianne Manning3, Michael Swinton3, Libing Yang1
1. CANMET Energy Technology Centre – Ottawa, Natural Resources Canada 2. Institut Catholique des Arts et des Métier, France
3. Institute for Research in Construction, National Research Council
ABSTRACT
Distributed cogeneration in single households may provide a viable alternative to the construction of new central power plants in the coming years. A key issue in residential cogeneration is how to size and integrate the required technologies in order to satisfy the total energy needs of the household, consisting of electricity, domestic hot water, space heating and space cooling. An interesting pathway to a more sustainable future involves the use of the earth surrounding the home as both a source and a sink for energy, especially if it enables the recycling of summertime waste heat from the generator.
This demonstration project was planned and implemented at the Canadian Centre for Housing Technology (CCHT) in 2006. The CCHT, located on the campus of the National Research Council in Ottawa, Ontario, Canada maintains two detached, single-family houses that have the capacity to assess energy and building technologies with daily simulated occupancy effects.
This paper describes the residential total energy system installed in one of the houses at the CCHT, consisting of two one-ton ground source heat pumps, an air handler for supplemental/back-up heating, a natural gas fired hot water tank, an indirect domestic hot water tank and a multistage thermostat. The bore-field consists of three vertical wells arranged to suit a typical suburban landscape. Two of the wells serve the heat pumps and the third well is arranged between the other two to sink the waste heat from a cogeneration unit to be installed in May 2007. The heat pump system was sized to satisfy the cooling load in Canada’s heat dominated climate, leaving room in the operation of the system to accept waste heat from the cogeneration unit, either directly or indirectly by recycling the heat through the ground to the heat pumps.
Following an earlier paper which introduced the installation and described initial ground thermal response testing, this paper presents, summarizes and discusses operational results of the heat pump system in heating mode over a continuous 47 day period ending December 21, 2006. The paper will also describe the configuration planned for the recovery of heat from the cogeneration system when installed in May 2007.
INTRODUCTION
The Canadian Centre for Housing Technology (CCHT) includes two identical R-2000 (energy-efficient) houses, each with simulated occupancy and a data collection system with over 200 data points. They are used for side-by-side testing in which the effects of a change in one house can be directly measured against the performance of the other. For this project a residential total energy system was installed in one of the houses, its performance was monitored in detail, and its use of natural gas and electricity was compared with those of the other house. The purpose of this project is to investigate the combination of ground source heat pumps (GSHP) and cogeneration at the residential scale, with possible recycling of heat from cogeneration through the ground. Figure 1 is a schematic of the residential total energy system. It consists of two one-ton GSHPs for heating or cooling the house, an air-handler for supplementary heating, a direct fired and an indirect fired hot water tank, a double-wall flat-plate heat exchanger, and three thermal wells. It is designed to accept a cogeneration unit that has undergone testing by Advanced Engine Technology Ltd. (1) for Natural Resources Canada (NRCan). The unit was designed and manufactured by Aisin Seiki Co. Ltd. Although it is not intended for North American service, NRCan has nevertheless achieved a high degree of
FIGURE 1. SCHEMATIC OF THE RESIDENTIAL TOTAL ENERGY SYSTEM.
confidence working with a standard Japanese production model received in 2006.
In addition to the CCHT’s permanent data collection system, the HVAC system was monitored by its own data logger that recorded 45 temperatures (including 19 in the wells), 7 electrical consumptions, 6 liquid flows, 4 on/off statuses, natural gas consumption, and air flow. Thermal response tests were performed between 7 September and 5 October 2006, and the system supplied all space heat and hot water to the house for the 47 days from 4 November to 20 December 2006. The system has performed as designed, and is now ready to accept the cogeneration unit in May 2007.
THE RESIDENTIAL TOTAL ENERGY SYSTEM
As shown in Figure 1, the system includes two ground source heat pumps, each with a capacity of approximately one ton (3.517 kW). Two small units were used so that the planned cogeneration unit will be able to supply their starting loads by starting one of them at a time. A single two-stage unit would have been preferable, but none with the desired capacity
we
re available within the time frame of this project. The heat pumps were sized to supply the house cooling load in Canada’s heating dominated climate, so that the system will accept heat from thecogeneration unit. The GSHPs are installed in parallel, and approximately half of the house return air goes through each of them. GSHP #1 is started first, and if it cannot supply the cooling or heating load, then GSHP #2 is also started. When both heat pumps cannot satisfy the heating load, then the air handler is also used.
The air handler consists of a coil, a fan that blows air across the coil, and a pump that circulates hot water through the coil. Its fan operates in continuous low speed when there is no demand for heating or cooling. When there is a demand it goes into a higher speed. The GSHPs and the air handler are controlled by a three-stage thermostat with PID (proportional-integral-derivative) control logic programmed for a 15 minute control cycle in order to optimize the response of the space conditioning system.
The GSHPs extract or reject heat with fluid flow in parallel through the two outer boreholes using one single speed pump. Each borehole is a well 52 m (175 ft) deep and 150 mm (6 in) in diameter (Well #1 and Well #2). Two polyethylene tubes of 25 mm (1 in) outside diameter are separated by spacers that were designed to hold thermocouples in place and allow a grout pipe to be inserted down the well (Figure 2). The tubes are
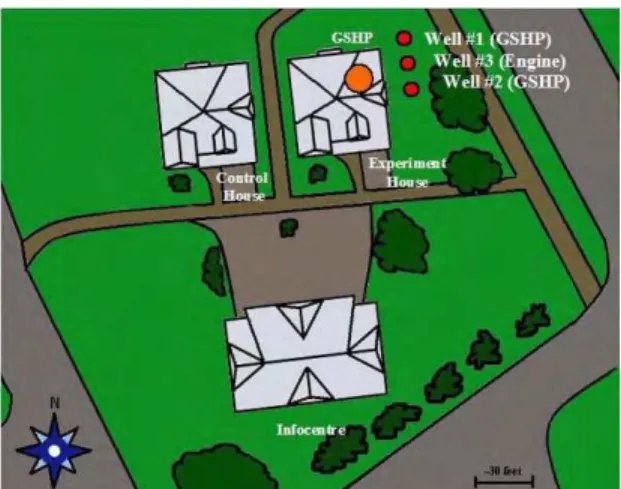
FIGURE 2. CROSS SECTION OF A WELL, FIGURE 3. PLAN OF THE CCHT, SH0WING THE SHOWING THE POSITION OF THE GROUT PIPE LOCATIONS OF THE WELLS.
DURING FILLING.
connected with a U at the bottom of the well to allow the working fluid to flow down and then back up. After the tubes were installed, the wells were filled with a bentonite-based grout. The fluid is a 50/50 mixture of propylene glycol and water. The pump is activated whenever either of the GHSPs is on. Balancing valves (not shown) were used to set equal flows through each of the GSHPs and each of the wells. The central well for the cogeneration unit (Well #3) is 76.3 m (250 ft) deep. The wells are parallel to the east side of the house, spaced 4.6 m (15 ft) apart, with Well # 3 between the other two, as shown in Figure 3.
The system includes a 129 L (34 US Gal) natural gas fired, condensing hot water tank, and a 302 L (80 US Gal) indirect hot water tank heated by an internal double-wall heat exchanger. The gas-fired tank is intended as a backup to the future cogeneration unit, and in the absence of that unit, it supplied hot water to the house, and heat to the air handler when required. The double-wall, flat-plate heat exchanger will be used to transfer heat between the propylene glycol cogeneration engine coolant and the water in the two tanks. When the tanks are at their maximum temperatures, then the three-way valve will be used to send engine heat to Well #3.
THE DATA COLLECTION SYSTEMS
The CCHT’s permanent data collection system was used to record natural gas and electricity use by the system, and the house temperature at the thermostat. It also recorded natural gas and electricity use for space heat and hot water, and house temperature in the identical control house. The CCHT houses also have simulated occupancy systems that release 242 L (64 US Gal) of hot water through sinks, showers and baths, and control lights and major appliances in both houses. The houses are “benchmarked” several times a year to show that they use nearly identical amounts of energy for space conditioning, hot water, lighting and appliances.
In addition to the permanent data collection system, the residential total energy system was monitored by its own data logger that recorded the following quantities:
• 5 air temperatures: The house return air, the air out of each GSHP, the air entering the air handler, and the air leaving the air handler (supply air). All temperatures were measured with thermocouples with accuracies of 0.5 C (1 F) or better.
• 21 liquid temperatures in the house: Coolant into and out of each of the GSHPs, coolant into and out of wells #1 and #2, engine coolant into and out of well #3, cold water into the system, water from the direct-fired to indirect tank, water from the indirect to direct-fired tank, hot water out of the indirect tank, domestic hot water to the house, water into and out of the air handler, and 6 temperatures relating to the cogeneration unit that are not used in this report.
• 19 temperatures in the wells: Wells #1 & #2 at 1, 2, 5, 10, 25 and 53.3 m (3.3, 6.6, 16.4, 32.8, 82.0 and 175 ft), and Well #3 at 1, 2, 5, 10, 25, 50 and 76.2 m (3.3, 6.6, 16.4, 32.8, 82.0, 164 and 250 ft).
• 9 electrical consumptions: GSHP #1, GSHP #2, the GSHP coolant pump, the pump between the two tanks, the air handler, the direct-fired tank, and three for the cogeneration unit that are not used in this report. These were measured with pulse-generating kWh meters with 1 pulse per 0.0006 kWh.
• 6 liquid flows: Coolant through GSHP #1 and GSHP #2, cold water into the system (equals domestic hot water to house), water between the tanks, water to the air handler, and
cogeneration unit coolant (not used except in thermal response tests). These were measured with pulse-generating flow meters with one pulse per liter.
• 5 on/off statuses: GSHP #1, GSHP #2, the pump between the tanks, the air handler pump, and the cogeneration unit (not used).
• 2 natural gas uses: The direct-fired tank and the cogeneration unit (not used), measured with pulse-generating utility-type gas meters with one pulse per 0.05 cubic feet.
• Air flow in the supply plenum.
These quantities were scanned every ten seconds, and in the same ten-second interval they were used to calculate the following 12 heat flows:
• From GHSP #1 and #2 to the air (two values). • From GHSP #1 and #2 to the coolant (two
values).
• To Wells #1 and #2 (one value).
• To and from the air handler (water and air side).
• From the direct-fired to indirect tank. • To domestic hot water.
• To Well #3 (used only for thermal response tests).
• From the engine to the heat exchanger, and from the heat exchanger to the indirect tank (not used).
All data points and heat flows were saved every five minutes. Temperatures and air flow were saved as averages. Natural gas and electricity use, liquid flows, on-times, and heat flows were saved as totals.
FLOW BALANCING AND THERMAL TESTS
A contractor was hired to balance the flows through the two GSHP units and through Wells # 1 and #2. A second contractor with a certified portable thermal conductivity test unit performed an in-situ thermal conductivity test in Well #3 two weeks after it was grouted. The test ran for 48 hours from 7 to 9 September 2006. Heat was generated using electricity from a diesel generator, and the heat input was 5950 W with a flow of 0.31 L/s (4.9 gpm) of water. The results are: Effective ground conductivity 2.7 W/mK (1.6 Btu/hr ft F), deep ground temperature 11.3°C (52.3 °F), and average thermal
resistance of the borehole 0.15 mK/W (0.087 ft F/ Btu hr) (2, 3).
On 3, 4 and 5 October 2006, three thermal pulse tests of six hours each were conducted on Well #3, The fluid in the well was a 50% by volume propylene glycol /water mixture, and heat was supplied by the direct-fired tank through the heat exchanger. The flow rate was a constant 0.53 L/s (8 gpm), which is the flow rate anticipated for the cogeneration unit. The purpose of these tests was to study the thermal response of the well to long and short duration heat injections approximating the duty cycles foreseen when the cogeneration unit is in operation (3).
OPERATION OF THE SYSTEM
By early November the ground temperatures had recovered from the thermal tests. The system was started on the afternoon of 3 November 2006, and was turned off on the morning of 21 December. It supplied all the space heat and hot water demands of the house for the 47 complete days of 4 November to 20 December. The two GSHP units were able to meet the space heat demand at all times except during the night of 7 – 8 December during which the outdoor temperature dropped to -15.8 C (3.6 F), and the air handler ran for 51 minutes, as it was intended to do.
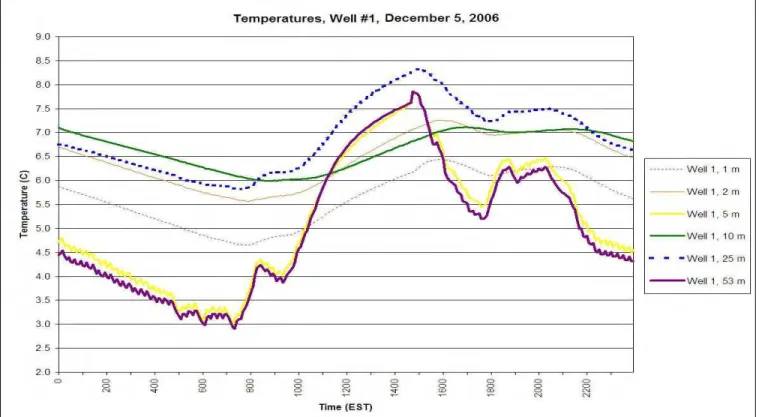
Figures 4 & 5 show the duty cycles of the two GSHPs and the air handler on two days selected for discussion. Figure 4 is for the coldest day, 8 December, during which the air handler was used. Each vertical bar represents a 15-minute interval. A 100% duty cycle would mean that all three units were on for the entire 15 minutes. GSHP #1 was on continuously until about 09:15. GSHP #2 was on at least 60% of the time until about 07:45, when it stopped for an entire 15-minute interval. The air handler cycled on and off until about 07:00, and then remained off for the rest of the day. It was never on for more than 28% of any interval. Figure 5 is for a more typical day, 5 December, during which the air handler never came on. GSHP #1 ran for most of the time, except between 10:50 and 14:40 when warmer outside temperatures – around -5 C (23 F), solar radiation, and heat released by simulated occupancy caused it to stop. GSHP #2 cycled on and off through the morning, late afternoon, and late evening. Figure 6 shows the temperatures at various depths in Well #1. The operation of the GSHP units has an immediate and strong effect on the temperatures at 5 and 53 m. Others show a slower response, and the temperature at 10 m responds least of all. Figure 7 shows the temperatures in Well #2. None of them respond as quickly as the 5 and 53 m temperatures in Well #1, and the temperature at 2 m shows almost no response. A possible explanation for the very different temperature responses is that grouting the wells may have moved some thermocouples closer or further from the tubes, or created insulating air spaces. The response of the borehole temperatures will continue
FIGURE 4. DUTY CYCLES ON 8 DECEMBER
FIGURE 6. TEMPERATURES IN WELL #1. SAME TIMES AS FIGURE 5
.
TABLE 1. COMPARISON OF THE SYSTEM WITH THE CONTROL HOUSE.
System Control Saving (C-S)/C
Natural Gas (m3) 5.3 19.5 73%
Electricity (kWh) 96.8 28.0 -246%
Total Energy (MJ) 548 829 34%
Cost (C$) 11.49 12.68 9%
GHGs (kg CO2 equiv, avg elec) 31.10 43.01 28%
to be analyzed in order to better understand their utility for indicating the thermal status of the boreholes.
Comparison with the Control House
The system’s energy use was compared with energy use for space heat and domestic hot water in the identical control house. The control used a 94.5% efficient condensing natural gas furnace and a standard natural gas fired hot water tank. Generally, the CCHT’s identical houses allow the energy use of a particular technology in one house to be directly compared against standard equipment in the other. This involves “benchmarking” the houses before and after an experiment to ensure that they use the same amount of energy with the standard equipment in both houses, and to produce an offset if energy use is different. However, this direct side-by-side testing could not be done with this project for three reasons:
• The thermostats and thermostat settings were changed between the benchmark and the start of this project. Normally, single-stage thermostats are used to control the natural gas furnaces in both houses. The GSHP system required a three-stage thermostat, and the thermostat in the control house was replaced by an identical unit programmed for one stage. It was then found that the set-point of the thermostat in the control house had to be lowered by 0.5 C (0.9 F) to keep the houses at the same average temperature. The average daily temperatures in the two houses were within 0.25 C (0.5 F) throughout the project, but these changes still introduce a level of uncertainty.
• Out of necessity, work was done in the control house during some of the 47 days during which the GSHP system supplied space heat and hot water to the experiment house. Those days have to be excluded from any analysis.
• Due to the workload in the houses, it was not possible to do a benchmark after the project.
For these reasons, our analysis is based on three days during which no work was performed in the control house. These include the warmest day of the project (16 Nov), the second coldest day (5 Dec), and an average day (12 Nov). The offset derived from the pre-experiment benchmark was applied to the measured energy use for the three days, and the results are shown in Table 1, using current prices of 0.52 C$/m3 (~13.25 US$/1000 ft3) for natural gas, and 0.09 C$/kWh (~0.081 US$/kWh) for electricity. Without the benchmark offset, the energy savings would have been 37% of total energy, and 14% of energy cost. Greenhouse gas emissions (GHGs) are in kilograms of carbon dioxide equivalent, and are calculated from GHG intensities published by Environment Canada (4). GHGs for electricity are based on Ontario’s average generation mixes for November and December (5).
The system uses 73% less natural gas because it uses natural gas only for hot water while the control house uses it for both hot water and space heat. The system uses 246% more electricity, primarily because it uses electricity for to drive the heat pumps for space heat, and also because it uses three pumps. Because the GSHPs have a COP of around 3, the total use of energy by the system is 34% less, and due to electricity’s higher cost per unit of energy, the cost savings are 9%. At Ontario’s GHG intensity of electrical generation (0.236 kg/kWh in November and 0.192 kg/kWh in December) (5) the system was responsible for 28% less GHG emissions than the control, pointing to the superior environmental performance of the GSHPs.
The system’s savings of total energy, cost and GHG might have been significantly greater had it not been for a control issue in transferring heat from the direct-fired to the indirect tank. The pump between the two tanks continued to run even when the two tanks appeared to be at almost the same temperature and the temperature drop through the indirect tank was as low as 1 C (1.8 F). The loop between the two tanks includes the heat exchanger and about 6 m (20 ft) of insulated copper tubing, and the pump consumes about 80 W. Thus, keeping the pump on longer than necessary loses heat from the system to the basement, and uses electricity unnecessarily. The result is equivalent to a hot water tank with an energy factor of 0.41. The pump is controlled by the thermostat in the indirect tank. We hypothesize that the pump runs longer than necessary because that thermostat is located below
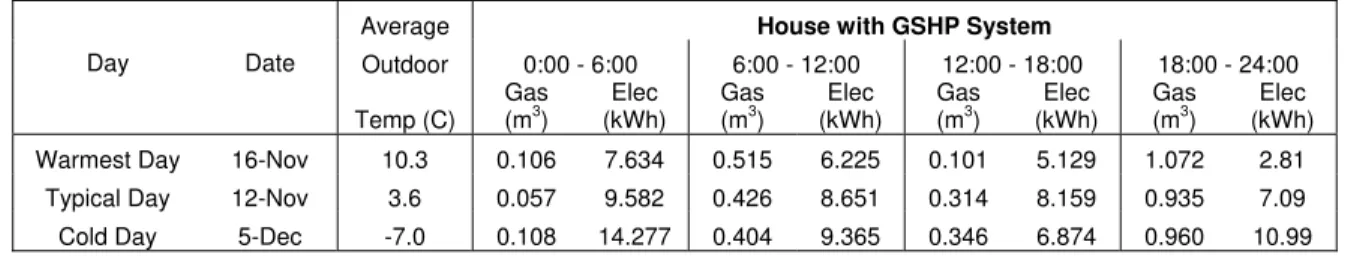
TABLE 2. SYSTEM ENERGY USE IN SIX-HOUR PERIODS. Average House with GSHP System
Outdoor 0:00 - 6:00 6:00 - 12:00 12:00 - 18:00 18:00 - 24:00 Day Date Temp (C) Gas (m3 ) Elec (kWh) Gas (m3 ) Elec (kWh) Gas (m3 ) Elec (kWh) Gas (m3 ) Elec (kWh) Warmest Day 16-Nov 10.3 0.106 7.634 0.515 6.225 0.101 5.129 1.072 2.81
Typical Day 12-Nov 3.6 0.057 9.582 0.426 8.651 0.314 8.159 0.935 7.09 Cold Day 5-Dec -7.0 0.108 14.277 0.404 9.365 0.346 6.874 0.960 10.99 the bottom of the indirect tank’s internal heat exchanger,
and so takes much longer to reach the set-point than the rest of the tank does. The location of the temperature sensing element will be optimized in further work.
Operation in Six-hour Periods
When electrical utilities implement time-of-day metering, then the optimum use of residential cogeneration units may involve running them during times of peak electrical demand and high prices. During those times, the cogeneration units could follow the house load – minimizing or eliminating electrical purchases from the grid, or they could run at capacity – selling electricity to the utility at the best price, and further reducing the utility’s peak load. For this reason, the performance of the residential total energy system was analyzed during six-hour periods, as shown in Table 2. On all three days, the system uses the most electricity between 0:00 and 0:600 which is the off-peak period in Ontario in both the winter and summer (5).
Well Data and Modeling
Temperatures in and out of the wells were used by Yang (5) to validate two ground heat exchanger models based on the Cylindrical Heat Source (CHS) theory. Quasi-dynamic and steady-state models were validated, and both showed good results, with the quasi-dynamic model outperforming the steady-state one for time periods of less than one hour.
THE FUTURE COGEN UNIT
The 6 kWe AISIN Cogeneration System is scheduled to
be installed in May 2007. It has a 3-cylinder, 4-stroke, 952 cc engine that runs on natural gas, consuming a maximum of 2.3 m3/hour. Its permanent magnet generator produces up to 6 kW at 100/200 VAC, 60 Hz through an inverter. Heat is recovered via the engine coolant and from the exhaust, and the maximum heat output is 11.7 kWth. The overall efficiency is
approximately 85%. It has been tested by an independent contractor and found to perform very well under a variety of conditions including cold starting tests (1). Although designed to synchronize with the electrical grid, and to shut down when the grid goes down, the unit has been successfully run at part loads in a mode that does not backfeed to the grid. This mode should allow the unit to follow the house loads during our future tests.
The cogeneration unit will be mounted on a concrete pad outside the house on the same side as the three wells. The plan is to run the unit for six hours each day during the period of peak loads. When smart metering is in effect in Ontario, it should also be the approximate time of maximum electricity costs. It is also possible that excess electricity can be sent to the grid through utility approved connections which have been used in two previous residential cogeneration tests at the CCHT (6,7). Heat will be captured in the two hot water tanks through the heat exchanger, and used for domestic hot water and space heat as required. When the tanks are at their set-point, the three-way valve will send the engine coolant through Well #3 to sink the excess heat. The largest amounts of excess heat are expected to be captured in the non-heating season. It is hoped that some of this heat can be recycled through the heat pumps during the early heating season. The calibrated ground heat exchanger models will be used to explore this concept beyond the time period convenient for experiments.
CONCLUSIONS
A residential total energy system was designed and tested at the Canadian Centre for Housing Technology. The system uses two ground source heat pumps, and is designed to accept electricity and heat from a natural gas fired cogeneration unit. Thermal response tests in one of the three wells have determined the thermal characteristics of the soil and the boreholes, and have been used successfully to calibrate ground heat exchanger models. The system has performed as intended, supplying all heat and hot water to the house. In comparison with the high-efficiency gas furnace and gas-fired hot water tank in the identical house next door, it used less energy, cost less to run, and produced fewer greenhouse gases. System efficiency could probably be improved by adjusting the location of the thermostat in the indirect hot water tank. Efforts to interpret thermocouple data intended to provide in-situ borehole thermal status will continue. The system is ready to accept a 6 kWe natural gas fired cogeneration unit that has
been successfully tested under a variety of conditions approximating those expected when the unit is installed at the CCHT.
REFERENCES
1. AET, 2007. Final Report: Performance Tests for a 6
kWe Aisin Cogeneration System. Advanced Engine Technology Ltd (AET), Ottawa, Ontario. (Business Confidential)
2. Beatty, B., 2006, “Report on In-Situ thermal Conductivity Test NRC Montreal Road Campus, Ottawa, Ontario”, Beatty & Associates Ltd., Ottawa, Ontario.
3. Yang, L., et. al., 2007. “Residential Total Energy System Testing at the Canadian Centre for Housing Technology,” ASME Power 2007, July 17-19, 2007, San Antonio, Texas.
4. EC, 2005. Canada’s Greenhouse Gas Inventory:
1990-2003. Environment Canada, Ottawa, Ontario. 5. Chamberland, M., 2006. “Peak Incremental
Generation for the Province of Ontario,” Natural Resources Canada, Ottawa, Ontario.
6. Bell, M. et. al., 2004. “Testing Residential Combined Heat and Power Systems at the Canadian Centre for Housing Technology,” in Proceedings,
2004 ACEEE Summer Study on Energy Efficiency in Buildings, American Council for an Energy-Efficient Economy, Washington, D.C.
7. Bell, M., et. al., 2006. “Testing a Residential Fuel Cell for Combined Heat and Power,” in
Proceedings, 2006 ACEEE Summer Study on Energy Efficiency in Buildings, American Council for an Energy-Efficient Economy, Washington, D.C.