arXiv:hep-ex/0609010v1 6 Sep 2006
Measurement of high-p
Single Electrons from Heavy-Flavor Decays in p + p Collisions
at
√
s
= 200 GeV
A. Adare,8 S. Afanasiev,22 C. Aidala,9 N.N. Ajitanand,48 Y. Akiba,42, 43 H. Al-Bataineh,37 J. Alexander,48
K. Aoki,27, 42 L. Aphecetche,50 R. Armendariz,37 S.H. Aronson,3 J. Asai,43 E.T. Atomssa,28 R. Averbeck,49
T.C. Awes,38 B. Azmoun,3V. Babintsev,18G. Baksay,14 L. Baksay,14A. Baldisseri,11K.N. Barish,4P.D. Barnes,30
B. Bassalleck,36S. Bathe,4 S. Batsouli,38 V. Baublis,41A. Bazilevsky,3 S. Belikov,3 R. Bennett,49 Y. Berdnikov,45
A.A. Bickley,8 J.G. Boissevain,30 H. Borel,11K. Boyle,49 M.L. Brooks,30H. Buesching,3 V. Bumazhnov,18
G. Bunce,3, 43 S. Butsyk,30, 49 S. Campbell,49 B.S. Chang,57J.-L. Charvet,11S. Chernichenko,18 J. Chiba,23
C.Y. Chi,9 M. Chiu,19 I.J. Choi,57 T. Chujo,54 P. Chung,48 A. Churyn,18 V. Cianciolo,38 C.R. Cleven,16
B.A. Cole,9 M.P. Comets,39 P. Constantin,30 M. Csan´ad,13 T. Cs¨org˝o,24T. Dahms,49 K. Das,15 G. David,3
M.B. Deaton,1 K. Dehmelt,14 H. Delagrange,50A. Denisov,18 D. d’Enterria,9 A. Deshpande,43, 49 E.J. Desmond,3
O. Dietzsch,46 A. Dion,49 M. Donadelli,46O. Drapier,28 A. Drees,49A.K. Dubey,56 A. Durum,18V. Dzhordzhadze,4
Y.V. Efremenko,38 J. Egdemir,49F. Ellinghaus,8 W.S. Emam,4 A. Enokizono,29 H. En’yo,42, 43 S. Esumi,53
K.O. Eyser,4 D.E. Fields,36, 43 M. Finger,5, 22 M. Finger, Jr.,5, 22 F. Fleuret,28 S.L. Fokin,26 Z. Fraenkel,56A. Franz,3
J. Franz,49 A.D. Frawley,15 K. Fujiwara,42Y. Fukao,27, 42 T. Fusayasu,35S. Gadrat,31 I. Garishvili,51 A. Glenn,8
H. Gong,49 M. Gonin,28 J. Gosset,11 Y. Goto,42, 43 R. Granier de Cassagnac,28N. Grau,21 S.V. Greene,54
M. Grosse Perdekamp,19, 43 T. Gunji,7 H.-˚A. Gustafsson,32 T. Hachiya,17 A. Hadj Henni,50 C. Haegemann,36
J.S. Haggerty,3H. Hamagaki,7R. Han,40H. Harada,17E.P. Hartouni,29K. Haruna,17 E. Haslum,32 R. Hayano,7
M. Heffner,29 T.K. Hemmick,49 T. Hester,4 X. He,16 H. Hiejima,19 J.C. Hill,21 R. Hobbs,36 M. Hohlmann,14
W. Holzmann,48 K. Homma,17 B. Hong,25 T. Horaguchi,42, 52 D. Hornback,51 T. Ichihara,42, 43 K. Imai,27, 42
M. Inaba,53 Y. Inoue,44, 42 D. Isenhower,1 L. Isenhower,1 M. Ishihara,42 T. Isobe,7M. Issah,48 A. Isupov,22
B.V. Jacak,49 J. Jia,9 J. Jin,9 O. Jinnouchi,43 B.M. Johnson,3 K.S. Joo,34 D. Jouan,39 F. Kajihara,7
S. Kametani,7, 55 N. Kamihara,42J. Kamin,49 M. Kaneta,43 J.H. Kang,57 H. Kanoh,42, 52H. Kano,42 D. Kawall,43
A.V. Kazantsev,26 A. Khanzadeev,41 J. Kikuchi,55D.H. Kim,34 D.J. Kim,57E. Kim,47 E. Kinney,8 A. Kiss,13
E. Kistenev,3 A. Kiyomichi,42J. Klay,29 C. Klein-Boesing,33L. Kochenda,41 V. Kochetkov,18B. Komkov,41
M. Konno,53D. Kotchetkov,4A. Kozlov,56 A. Kr´al,10A. Kravitz,9 J. Kubart,5, 20 G.J. Kunde,30 N. Kurihara,7
K. Kurita,44, 42 M.J. Kweon,25 Y. Kwon,51, 57 G.S. Kyle,37 R. Lacey,48Y.-S. Lai,9 J.G. Lajoie,21A. Lebedev,21
D.M. Lee,30 M.K. Lee,57 T. Lee,47 M.J. Leitch,30 M.A.L. Leite,46 B. Lenzi,46 T. Liˇska,10 A. Litvinenko,22
M.X. Liu,30 X. Li,6 B. Love,54D. Lynch,3 C.F. Maguire,54 Y.I. Makdisi,3 A. Malakhov,22 M.D. Malik,36
V.I. Manko,26 Y. Mao,40, 42 L. Maˇsek,5, 20 H. Masui,53 F. Matathias,9 M. McCumber,49 P.L. McGaughey,30
Y. Miake,53P. Mikeˇs,5, 20 K. Miki,53 T.E. Miller,54 A. Milov,49S. Mioduszewski,3 M. Mishra,2 J.T. Mitchell,3
M. Mitrovski,48 A. Morreale,4 D.P. Morrison,3 T.V. Moukhanova,26 D. Mukhopadhyay,54 J. Murata,44, 42
S. Nagamiya,23Y. Nagata,53 J.L. Nagle,8 M. Naglis,56I. Nakagawa,42, 43 Y. Nakamiya,17 T. Nakamura,17
K. Nakano,42, 52J. Newby,29 M. Nguyen,49 B.E. Norman,30A.S. Nyanin,26 E. O’Brien,3S.X. Oda,7C.A. Ogilvie,21
H. Ohnishi,42 H. Okada,27, 42 K. Okada,43 M. Oka,53 O.O. Omiwade,1 A. Oskarsson,32 M. Ouchida,17
K. Ozawa,7 R. Pak,3D. Pal,54A.P.T. Palounek,30 V. Pantuev,49 V. Papavassiliou,37J. Park,47W.J. Park,25
S.F. Pate,37H. Pei,21 J.-C. Peng,19H. Pereira,11 V. Peresedov,22D.Yu. Peressounko,26 C. Pinkenburg,3
M.L. Purschke,3A.K. Purwar,30 H. Qu,16J. Rak,36 A. Rakotozafindrabe,28I. Ravinovich,56 K.F. Read,38, 51
S. Rembeczki,14 M. Reuter,49 K. Reygers,33V. Riabov,41 Y. Riabov,41G. Roche,31A. Romana,28,∗ M. Rosati,21
S.S.E. Rosendahl,32 P. Rosnet,31 P. Rukoyatkin,22 V.L. Rykov,42 B. Sahlmueller,33N. Saito,27, 42, 43 T. Sakaguchi,3
S. Sakai,53H. Sakata,17V. Samsonov,41 S. Sato,23 S. Sawada,23J. Seele,8 R. Seidl,19 V. Semenov,18R. Seto,4
D. Sharma,56 I. Shein,18 A. Shevel,41, 48 T.-A. Shibata,42, 52 K. Shigaki,17 M. Shimomura,53 K. Shoji,27, 42
A. Sickles,49 C.L. Silva,46 D. Silvermyr,38 C. Silvestre,11 K.S. Sim,25 C.P. Singh,2 V. Singh,2 S. Skutnik,21
M. Sluneˇcka,5, 22 A. Soldatov,18 R.A. Soltz,29 W.E. Sondheim,30 S.P. Sorensen,51 I.V. Sourikova,3F. Staley,11
P.W. Stankus,38E. Stenlund,32 M. Stepanov,37 A. Ster,24 S.P. Stoll,3 T. Sugitate,17C. Suire,39 J. Sziklai,24
T. Tabaru,43 S. Takagi,53E.M. Takagui,46A. Taketani,42, 43 Y. Tanaka,35 K. Tanida,42, 43 M.J. Tannenbaum,3
A. Taranenko,48 P. Tarj´an,12 T.L. Thomas,36 M. Togawa,27, 42 A. Toia,49 J. Tojo,42 L. Tom´aˇsek,20H. Torii,42
R.S. Towell,1 V-N. Tram,28 I. Tserruya,56 Y. Tsuchimoto,17 C. Vale,21 H. Valle,54 H.W. van Hecke,30
J. Velkovska,54R. Vertesi,12 A.A. Vinogradov,26M. Virius,10 V. Vrba,20 E. Vznuzdaev,41M. Wagner,27, 42
W. Xie,43 Y. Yamaguchi,55 A. Yanovich,18 Z. Yasin,4 J. Ying,16S. Yokkaichi,42, 43 G.R. Young,38 I. Younus,36
I.E. Yushmanov,26 W.A. Zajc,9,† O. Zaudtke,33 C. Zhang,38 S. Zhou,6 J. Zim´anyi,24 and L. Zolin22
(PHENIX Collaboration)
1Abilene Christian University, Abilene, TX 79699, U.S.
2Department of Physics, Banaras Hindu University, Varanasi 221005, India 3Brookhaven National Laboratory, Upton, NY 11973-5000, U.S. 4University of California - Riverside, Riverside, CA 92521, U.S. 5Charles University, Ovocn´y trh 5, Praha 1, 116 36, Prague, Czech Republic 6China Institute of Atomic Energy (CIAE), Beijing, People’s Republic of China
7Center for Nuclear Study, Graduate School of Science, University of Tokyo, 7-3-1 Hongo, Bunkyo, Tokyo 113-0033, Japan 8University of Colorado, Boulder, CO 80309, U.S.
9Columbia University, New York, NY 10027 and Nevis Laboratories, Irvington, NY 10533, U.S. 10Czech Technical University, Zikova 4, 166 36 Prague 6, Czech Republic
11Dapnia, CEA Saclay, F-91191, Gif-sur-Yvette, France 12Debrecen University, H-4010 Debrecen, Egyetem t´er 1, Hungary
13ELTE, E¨otv¨os Lor´and University, H - 1117 Budapest, P´azm´any P. s. 1/A, Hungary 14Florida Institute of Technology, Melbourne, FL 32901, U.S.
15Florida State University, Tallahassee, FL 32306, U.S. 16Georgia State University, Atlanta, GA 30303, U.S.
17Hiroshima University, Kagamiyama, Higashi-Hiroshima 739-8526, Japan
18IHEP Protvino, State Research Center of Russian Federation, Institute for High Energy Physics, Protvino, 142281, Russia 19University of Illinois at Urbana-Champaign, Urbana, IL 61801, U.S.
20Institute of Physics, Academy of Sciences of the Czech Republic, Na Slovance 2, 182 21 Prague 8, Czech Republic 21Iowa State University, Ames, IA 50011, U.S.
22Joint Institute for Nuclear Research, 141980 Dubna, Moscow Region, Russia 23KEK, High Energy Accelerator Research Organization, Tsukuba, Ibaraki 305-0801, Japan
24KFKI Research Institute for Particle and Nuclear Physics of the Hungarian Academy of Sciences (MTA KFKI RMKI), H-1525 Budapest 114, POBox 49, Budapest, Hungary
25Korea University, Seoul, 136-701, Korea
26Russian Research Center “Kurchatov Institute”, Moscow, Russia 27Kyoto University, Kyoto 606-8502, Japan
28Laboratoire Leprince-Ringuet, Ecole Polytechnique, CNRS-IN2P3, Route de Saclay, F-91128, Palaiseau, France 29Lawrence Livermore National Laboratory, Livermore, CA 94550, U.S.
30Los Alamos National Laboratory, Los Alamos, NM 87545, U.S.
31LPC, Universit´e Blaise Pascal, CNRS-IN2P3, Clermont-Fd, 63177 Aubiere Cedex, France 32Department of Physics, Lund University, Box 118, SE-221 00 Lund, Sweden 33Institut f¨ur Kernphysik, University of Muenster, D-48149 Muenster, Germany
34Myongji University, Yongin, Kyonggido 449-728, Korea
35Nagasaki Institute of Applied Science, Nagasaki-shi, Nagasaki 851-0193, Japan 36University of New Mexico, Albuquerque, NM 87131, U.S.
37New Mexico State University, Las Cruces, NM 88003, U.S. 38Oak Ridge National Laboratory, Oak Ridge, TN 37831, U.S.
39IPN-Orsay, Universite Paris Sud, CNRS-IN2P3, BP1, F-91406, Orsay, France 40Peking University, Beijing, People’s Republic of China
41PNPI, Petersburg Nuclear Physics Institute, Gatchina, Leningrad region, 188300, Russia 42RIKEN, The Institute of Physical and Chemical Research, Wako, Saitama 351-0198, Japan 43RIKEN BNL Research Center, Brookhaven National Laboratory, Upton, NY 11973-5000, U.S. 44Physics Department, Rikkyo University, 3-34-1 Nishi-Ikebukuro, Toshima, Tokyo 171-8501, Japan
45Saint Petersburg State Polytechnic University, St. Petersburg, Russia
46Universidade de S˜ao Paulo, Instituto de F´ısica, Caixa Postal 66318, S˜ao Paulo CEP05315-970, Brazil 47System Electronics Laboratory, Seoul National University, Seoul, South Korea
48Chemistry Department, Stony Brook University, Stony Brook, SUNY, NY 11794-3400, U.S. 49Department of Physics and Astronomy, Stony Brook University, SUNY, Stony Brook, NY 11794, U.S. 50SUBATECH (Ecole des Mines de Nantes, CNRS-IN2P3, Universit´e de Nantes) BP 20722 - 44307, Nantes, France
51University of Tennessee, Knoxville, TN 37996, U.S.
52Department of Physics, Tokyo Institute of Technology, Oh-okayama, Meguro, Tokyo 152-8551, Japan 53Institute of Physics, University of Tsukuba, Tsukuba, Ibaraki 305, Japan
54Vanderbilt University, Nashville, TN 37235, U.S. 55Waseda University, Advanced Research Institute for Science and
Engineering, 17 Kikui-cho, Shinjuku-ku, Tokyo 162-0044, Japan 56Weizmann Institute, Rehovot 76100, Israel
57Yonsei University, IPAP, Seoul 120-749, Korea (Dated: October 29, 2018)
The momentum distribution of electrons from decays of heavy flavor (charm and beauty) for midrapidity |y| < 0.35 in p + p collisions at √s = 200 GeV has been measured by the PHENIX experiment at the Relativistic Heavy Ion Collider (RHIC) over the transverse momentum range 0.3 < pT < 9 GeV/c. Two independent methods have been used to determine the heavy flavor yields, and the results are in good agreement with each other. A fixed-order-plus-next-to-leading-log pQCD calculation agrees with the data within the theoretical and experimental uncertainties, with the data/theory ratio of 1.72 ± 0.02stat
± 0.19sys for 0.3 < p
T<9 GeV/c. The total charm production cross section at this energy has also been deduced to be σc¯c= 567 ± 57
stat
± 224sys µb. PACS numbers: 25.75.Dw
Heavy-flavor (charm and beauty) production serves as a testing ground of QCD. Because of the large quark mass, it is expected that next-to-leading order pertur-bative QCD (NLO pQCD) can describe the production cross section of charm and beauty at high energy, partic-ularly at high pT. At the Tevatron, beauty production
is well described by NLO pQCD [1]. Charm production cross sections at high pTare found to be higher than the
theory by ≈ 50 %, but are compatible within the the-oretical uncertainties [2]. Since heavy-flavor production at RHIC energies is dominated by gluon-gluon fusion, its production in polarized p + p collisions probes the gluon distribution G(x) and the gluon polarization ∆G(x). A good understanding of the reaction mechanism for heavy-flavor production is crucial for reliably extracting these distributions. Furthermore in Au+Au collisions at RHIC strong suppression of single electrons from heavy-flavor decays has been observed [3]. Measurements of heavy-flavor production in p + p collisions provide a baseline for studying hot and dense matter effects in heavy ion reac-tions. Earlier measurements at RHIC [4, 5] have a limited pTrange with substantial experimental uncertainties, so
an improved measurement is crucial.
We report the production cross section of electrons, (e++e−)/2, at mid-rapidity in p+p collisions at√s = 200
GeV for 0.3 < pT< 9 GeV/c measured by the PHENIX
experiment. Contributions from semi-leptonic decays of heavy-flavor are determined using two independent meth-ods. This measurement has over two orders of magnitude larger statistics with much reduced systematic uncertain-ties compared to our previous measurement [4].
The data were collected by the PHENIX detector [6] during the 2005 RHIC run using the two central arm spectrometers. Each spectrometer covers |η| < 0.35 in pseudo-rapidity and ∆φ = π/2 in azimuth. It in-cludes a drift chamber (DC) and pad chambers (PC1) for charged particle tracking, a Ring Imaging ˇCerenkov de-tector (RICH) for electron identification, and an electro-magnetic calorimeter (EMCal) for electron identification and trigger. Beam-beam counters (BBCs), positioned at pseudo-rapidities 3.1 < |η| < 3.9, measure the position of the collision vertex along the beam (zvtx) and provide
the interaction trigger. In this run, helium bags, one for each arm, were placed in the space between the beam pipe and DC to reduce multiple scattering and photon conversion.
Two datasets are used for the analysis: (1) the min-imum bias (MB) dataset recorded by the BBC trigger, and (2) a “photon” trigger (PH) dataset triggered at level-1 requiring a minimum energy deposit of 1.4 GeV in an overlapping tile of 4 × 4 EMCal towers in coin-cidence with the BBC trigger. The PH trigger has ≃ 100 % efficiency for high pTelectrons above 2 GeV/c in
the active trigger tiles. The BBC trigger cross section is 23.0 ± 2.2 mb. Since only ≃ 50 % of inelastic p + p col-lisions satisfy the BBC trigger condition, only a fraction of the inclusive electron production events is triggered. This pTand process independent fraction is determined
to be ǫbias= 0.79 ± 0.02 from the yield ratio of high pT
π0with and without the BBC trigger. After selection of
good runs and a vertex cut of |zvtx| < 20 cm, an
inte-grated luminosity (L) of 45 nb−1 in the MB dataset and
1.57 pb−1 in the PH dataset are used for the analysis.
Charged particle tracks are reconstructed using DC and PC1 and confirmed by a hit in EMCal within 4σ in position. The momentum resolution is σp/p ≃ 0.7% ⊕
0.9%p (GeV/c), and the momentum scale is calibrated within 1% using the reconstructed mass of J/ψ → e+e−.
Electron identification (eID) requires at least two as-sociated hits in RICH, a shower shape cut in EMCal, and a cut in the ratio E/p where E is energy mea-sured in EMCal. We require 0.7 < E/p < 1.3 for 0.8 < pT < 5 GeV/c. For lower pT, the minimum
value of E/p decreases with decreasing pT to 0.55 at
pT= 0.3 GeV/c. The E/p cut removes background
elec-trons from photon conversions and semi-leptonic decay of kaons (K → eνπ(Ke3)) that occur far from the
ver-tex, and most of the remaining hadron background. The hadron contamination after the E/p cut is 3% at pT= 0.3
GeV/c and less than 1% for 0.8 < pT < 5 GeV/c with
eID efficiency of approximately 90 %.
For pT > 5 GeV/c, where pions also emit ˇCerenkov
photons in RICH, tighter electron identification cuts are applied. We require at least 5 associated hits in RICH, a tighter shower shape cut in EMCal, and 0.8 < E/p < 1.3. With these cuts, the electron measurement is extended to 9 GeV/c in pT. The eID efficiency of the tighter cuts
is pTindependent, and is determined to be 57% of that
for pT< 5 GeV/c by applying the same tighter cuts for
pT < 5 GeV/c. With the tighter cuts, hadron
contami-nation is negligible for pT < 7 GeV/c. For 7 < pT < 8
contamina-tion is determined and subtracted using a Gaussian plus exponential fit to E/p distribution.
The invariant cross section for electron production is calculated using the following formula,
Ed 3σ dp3 = 1 L 1 2πpT Ne ∆pT∆y 1 ǫrec 1 ǫbias , (1)
where Ne is the measured electron yield; ǫrec, calculated
using a full GEANT [7] simulation, includes the geomet-rical acceptance, track reconstruction and eID efficiency, and the smearing effect due to finite momentum reso-lution. For the PH dataset, ǫrec also includes the PH
trigger efficiency. The cross sections from the MB and the PH datasets are consistent with each other for the overlapped pTregion.
The inclusive electron yield consists of three compo-nents: (1) electrons from heavy-flavor decay, (2) “pho-tonic” background electrons from Dalitz decays of light mesons and photon conversions primarily in the beam pipe, and (3)“non-photonic” background electrons from the remaining Ke3decays and dielectron decays of vector
mesons. The photonic background is much larger than the non-photonic background. We determined the spec-trum of electrons from heavy-flavor decay by subtracting the background components from the inclusive spectrum using the following two independent methods.
In the “cocktail subtraction” method [3, 4, 8] a cock-tail of electron spectra from various background sources is calculated using a Monte Carlo event generator of hadron decays. The most important background is the π0Dalitz decay, so we use our measured π0and π±
spec-tra as input to the generator. The specspec-tral shapes of other light hadrons h are obtained from the pion spec-tra by mT scaling (pT → pp2T+ M
2
h− Mπ2). Within
this approach the ratios h/π0 are constant at high p T.
For the relative normalization, we use the following ra-tios: η/π0= 0.48 ± 0.03 [9], ρ0/π0 = 1.0 ± 0.3, ω/π0 =
0.90 ± 0.06 [10], η′/π0= 0.40 ± 0.12, φ/π0= 0.25 ± 0.08.
For pT > 2 GeV/c, contributions from η and all other
hadrons combined are approximately 20% and 10% of π0,
respectively. Another major background electron source is conversions of photons in the beam pipe (0.29% of a radiation length(X0)) as well as in the air and the
he-lium bags (0.1% X0). The conversion electron spectrum
is very similar to that of Dalitz decays. Using a detailed GEANT simulation of the PHENIX detector, the ratio of electrons from conversions to Dalitz decays, RCD, is
determined to be 0.40 ± 0.04 for π0, essentially p T
inde-pendent. RCD is approximately half of that in [4] since
the helium bags eliminated most of the conversions out-side of the beam pipe. The conversion spectra are calcu-lated by scaling the Dalitz decay spectra by RCD, with
small corrections to account for the species dependence of the relative branching ratio of Dalitz decay to photon decay ((h → eeγ)/(h → γγ)). The internal and exter-nal conversions of direct photons are also included in the
cocktail, using our measured direct photon spectrum [11] as input. The direct photon contribution is comparable to or greater than that from the η for pT > 5 GeV/c.
Non-photonic backgrounds are also included in the cock-tail. Since the Ke3background depends on the analysis
cuts, it is evaluated by a full GEANT simulation. In the “converter subtraction” method [12], we in-troduce an additional photon converter (a thin brass sheet of 1.67% X0) around the beam pipe for part of
the run. The converter multiplies the photonic electron background by a fixed factor, Rγ ≃ 2.3, which is
de-termined precisely via GEANT simulation. Rγ is larger
than in [12] since we have less conversion material in the 2005 run. The photonic background Nγ
e is determined as
Nγ
e = (NeC−(1−ǫ)NeNC)/(Rγ−1+ǫ), where NeCand NeNC
are electron yield with and without the converter, respec-tively; and ǫ (2.1%) represents a small loss of electrons due to the converter. The non-photonic component is then determined as Nnon−γ
e = NeNC− Neγ. Small
remain-ing non-photonic background, such as Ke3 and hadron
contamination, are subtracted.
These two methods are complementary to each other. The converter method is more accurate, and it allows us to extract a heavy-flavor signal down to pT= 0.3 GeV/c
where the signal is only ≈ 10% of inclusive electrons. In addition, the measured photonic background Nγ
e is
used to confirm and to calibrate the normalization of the calculated cocktail yields. A drawback of the method is statistical precision: the converter run contains only a small fraction (≃ 7% in the 2005 run) of the data. The cocktail method can use the full statistics at high pT,
where the photonic background becomes a small fraction of inclusive electrons.
Systematic uncertainties are categorized into (a) in-clusive electron spectra, (b) cocktail subtraction, and (c) converter subtraction. Category (a) is common to both analyses, and includes the uncertainties in luminos-ity (9.6%), geometrical acceptance (4%), eID efficiency (3%), and the PH trigger efficiency (3% at the plateau). Uncertainties in cocktail subtraction (category (b)) in-clude the normalization (8%) and pT dependent shape
uncertainty (2% at pT ≃ 2 GeV/c, increasing to 6% at
9 GeV/c). In the converter analysis (category(c)) the dominant uncertainties are in Rγ (2.7%) and in the
rel-ative acceptance in the converter and the normal runs (1.0%). These uncertainties are propagated into the un-certainties in the heavy-flavor electron yields and added in quadrature.
Figure 1 shows the ratio of the measured Nγ e to the
cocktail calculation as a function of pT. The ratio is
con-sistent with unity within the uncertainties of the cocktail. At high pT (> 1.8 GeV/c), the ratio is 0.94 ± 0.02staton
average. Since this is within the uncertainty of the cock-tail normalization, we rescale the cockcock-tail yields by this factor. This removes the 8% normalization uncertainty in the cocktail.
(GeV/c) T p 0 0.5 1 1.5 2 2.5 3 3.5 4 4.5 measured/cocktail 0.6 0.7 0.8 0.9 1 1.1 1.2 1.3
Photonic electrons (measured/cocktail)
FIG. 1: Ratio of photonic electrons measured by the con-verter method to the cocktail calculation. Data from the MB (PH) dataset are shown below (above) 1.8 GeV/c. The upper and lower curves show the systematic error of the cocktail. Error bars are statistical only.
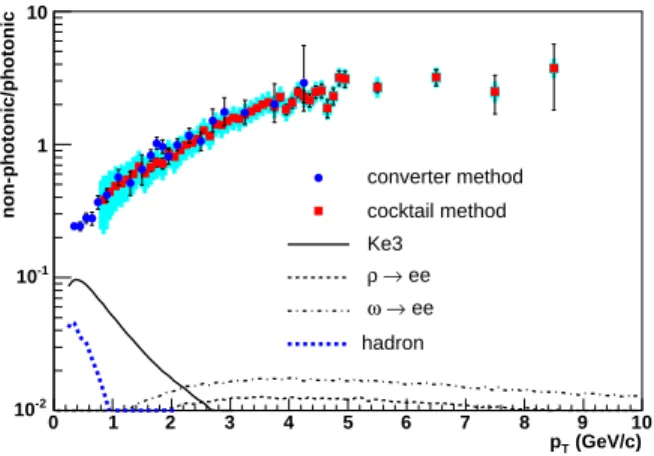
(GeV/c) T p 0 1 2 3 4 5 6 7 8 9 10 non-photonic/photonic -2 10 -1 10 1 10 converter method cocktail method Ke3 ee → ρ ee → ω hadron
FIG. 2: Ratio of non-photonic electrons to photonic back-ground. Error bars are statistical errors and the error bands show the cocktail systematic errors. The solid, dashed, dot-dashed, and dot curve is the remaining non-photonic back-ground from Ke3, ρ → ee, ω → ee, and hadron contamina-tion, respectively.
In Fig. 2, filled circles (squares) show the ratio of non-photonic electrons relative to non-photonic background de-termined by the converter (cocktail) method. The non-photonic electrons are dominantly heavy-flavor decay sig-nals. The remaining non-photonic background contribu-tions have been calculated and are shown in Fig. 2. The two methods are consistent with each other. The ra-tio monotonically increases with increasing pT, becoming
greater than unity for pT> 2.4 GeV/c, and saturates at
≃ 3 for pT > 5 GeV/c. The large signal-to-background
ratio is due to the small amount of conversion material in the spectrometer acceptance.
Figure 3 (a) shows the invariant differential cross sec-tion of electrons from heavy-flavor decays. All back-ground has been subtracted, including the non-photonic components shown in Fig. 2. The data from the two anal-ysis methods are combined: at low pT(pT< 1.6 GeV/c)
the converter subtraction method on the MB data set is
) 3 c -2 (mb GeV 3 /dp σ 3 E d -10 10 -9 10 -8 10 -7 10 -6 10 -5 10 -4 10 -3 10 -2 10 -1 10
(a)
=200 GeV s )/2 + X at + e + (e → p+p PHENIX data FONLL(total) e) → FONLL(c e) → FONLL(b e) → c → FONLL(b (GeV/c) T p 0 1 2 3 4 5 6 7 8 9 10 0.5 1 1.5 2 2.5 3 DATA/FONLL (b)FIG. 3: (a) Invariant differential cross sections of electrons from heavy-flavor decays. The error bars (bands) represent the statistical (systematic) errors. The curves are the FONLL calculations (see text). (b) Ratio of the data and the FONLL calculation. The upper (lower) curve shows the theoretical upper (lower) limit of the FONLL calculation. In both panels a 10% normalization uncertainty is not shown.
used; at intermediate pT (1.6 < pT < 2.6 GeV/c) the
converter method on the PH dataset is used; and at high pT (pT > 2.6 GeV/c) the cocktail method on the PH
dataset is used.
The data are compared with a fixed-order-plus-next-to-leading-log (FONLL) pQCD calculation [13, 14]. The top curve in Fig. 3 shows the central values of the FONLL calculation. The contributions of charm and beauty are also shown. For pT > 4 GeV/c, the beauty
contribu-tion becomes dominant. In Fig. 3 (b), the ratio of the data to the FONLL calculation is shown. The ratio is nearly pTindependent over the entire pTrange. Fitting
to a constant for 0.3 < pT< 9.0 GeV/c yields a ratio of
1.72 ± 0.02stat± 0.19sys Similar ratios are observed in
charm production at high pTat the Tevatron [2]. The
up-per limit of the FONLL calculation is compatible with the data. Recently STAR reported [15] that non-photonic electron production in p + p at √s = 200 GeV is 5.5 times larger than predicted by the same FONLL calcu-lation. We do not observe such a large discrepancy. We note that the photonic electron background in our spec-trometer is approximately 1/10 that of STAR due to the small amount of conversion material in the PHENIX ac-ceptance.
The total charm cross section is derived by integrat-ing the heavy-flavor electron cross section for pT > 0.4
The systematic error is obtained by integrating the up-per and lower systematic error limits of the differen-tial cross sections, since the systematic errors are es-sentially coherent. The cross section is then extrapo-lated to pT = 0 using the spectrum shape predicted
by FONLL: dσe(pT > 0)/dy = 10.9 ± 1.1 ± 3.8 µb.
We have assigned 10% to the systematic uncertainty of the extrapolation, and have subtracted contribution from beauty and beauty cascade decays (0.1µb). We de-termine the charm production cross section, dσc¯c/dy =
123 ± 12 ± 45 µb, by using a c → e total branching ra-tio of 9.5 ± 1.0%, calculated using the following charmed hadron ratios: D+/D0
= 0.45 ± 0.1, Ds/D0= 0.25 ± 0.1,
and Λc/D0= 0.1±0.05. The rapidity distribution of
elec-trons is broader than that of D mesons due to decay kine-matics. A correction to this effect (7%) has been applied. Using the rapidity distribution from HVQMNR [16] with CTEQ5M [17] PDF, the total charm cross section is de-termined to be σc¯c = 567 ± 57stat± 224sysµb. We have
assigned 15% systematic error to the extrapolation. This result is compatible with our previous measurement [4] (920 ± 150 ± 540 µb) and the value derived from Au+Au collisions [12] (622 ±57±160 µb per NN collisions). The FONLL cross section (256+400
−146µb) is compatible with the
data within its uncertainty. STAR has reported a some-what larger value in d+Au [5] (1.3 ± 0.2 ± 0.4 mb per N N collisions). Although the data extend to high pTwhere the beauty contribution is expected to be
dom-inant, the present analysis does not separate charm and beauty contributions. The beauty cross section predicted by FONLL is 1.87+0.99−0.67µb, and the upper FONLL curve is consistent with the data.
In conclusion, we have measured single electrons from heavy-flavor decays in p + p collisions at√s = 200 GeV. The new data reported here provide a crucial baseline for the study of heavy quark production in hot and dense matter created in Au+Au collisions. The agreement
be-tween the data and the FONLL pQCD calculation within the theoretical and the experimental uncertainties sug-gests that a reliable extraction of gluon polarization from heavy-flavor production in polarized p + p collisions is at-tainable.
We thank the staff of the Collider-Accelerator and Physics Departments at BNL for their vital contribu-tions. We acknowledge support from the Department of Energy and NSF (U.S.A.), MEXT and JSPS (Japan), CNPq and FAPESP (Brazil), NSFC (China), MSMT (Czech Republic), IN2P3/CNRS, and CEA (France), BMBF, DAAD, and AvH (Germany), OTKA (Hungary), DAE (India), ISF (Israel), KRF and KOSEF (Korea), MES, RAS, and FAAE (Russia), VR and KAW (Swe-den), U.S. CRDF for the FSU, US-Hungarian NSF-OTKA-MTA, and US-Israel BSF.
∗ Deceased
† PHENIX Spokesperson: zajc@nevis.columbia.edu [1] M. Cacciari (2004), hep-ph/0407187.
[2] D. Acosta et al., Phys. Rev. Lett. 91, 241804 (2003). [3] S. S. Adler et al., Phys. Rev. Lett. 96, 032301 (2006). [4] S. S. Adler et al., Phys. Rev. Lett. 96, 032001 (2006). [5] J. Adams et al., Phys. Rev. Lett. 94, 062301 (2005). [6] K. Adcox et al., Nucl. Instrum. Meth. A499, 469 (2003). [7] CERN Program Library.
[8] K. Adcox et al., Phys. Rev. Lett. 88, 192303 (2002). [9] S. S. Adler et al., Phys. Rev. Lett. 96, 202301 (2006). [10] V. Ryabov et al. (2005), hep-ex/0510017.
[11] S. S. Adler et al., to be published.
[12] S. S. Adler et al., Phys. Rev. Lett. 94, 082301 (2005). [13] M. Cacciari et al., Phys. Rev. Lett. 95, 122001 (2005). [14] M. Cacciari, private communication.
[15] B. I. Abelev (2006), nucl-ex/0607012.
[16] M. L. Mangano, P. Nason, and G. Ridolfi, Nucl. Phys. B405, 507 (1993).