Active Database Interface for Video Search
by
Zachary Collins
Submitted to the Department of Electrical Engineering and Computer
Science
in partial fulfillment of the requirements for the degree of
Master of Engineering in Electrical Engineering and Computer Science
at the
MASSACHUSETTS INSTITUTE OF TECHNOLOGY
May 2020
c
○ Massachusetts Institute of Technology 2020. All rights reserved.
Author . . . .
Department of Electrical Engineering and Computer Science
May 12, 2020
Certified by . . . .
Michael Stonebraker
Adjunct Professor
Thesis Supervisor
Accepted by . . . .
Katrina LaCurts
Chairman, Master of Engineering Thesis Committee
Active Database Interface for Video Search
by
Zachary Collins
Submitted to the Department of Electrical Engineering and Computer Science on May 12, 2020, in partial fulfillment of the
requirements for the degree of
Master of Engineering in Electrical Engineering and Computer Science
Abstract
Surveillance video is abundant in urban areas and can often be vital to police when conducting investigations. Currently, the only means investigators have of finding a suspect in video is to watch it from beginning to end. This can be tedious and waste numerous man hours that could be expended elsewhere. Survq is a system that aids police detectives by automatically identifying key features of video using novel machine learning algorithms. These features are then used to filter video to those that match a suspect description. In this paper, we present the interface used for investigation and how it was designed with this use case and underlying system in mind.
Thesis Supervisor: Michael Stonebraker Title: Adjunct Professor
Acknowledgments
Professor Michael Stonebraker and Professor Michael Caffarella for their guidance and mentorship throughout the completion of this research. Aaron Sipser for his work on the video ingest component of the system. Tao Sun for his work on the feature identification components of the system. Jenna McClellan for her work on project infrastructure. Finally, Professor Bharat Barghava and the rest of the Purdue University group for their continuous help on this project.
Contents
1 Introduction 13
2 Related Work 15
2.1 Video Querying and Annotation . . . 15
2.2 Interfaces for Surveillance Querying . . . 15
2.3 Trigger Systems and Active Databases . . . 16
3 System Architecture 17 3.1 Ingestion System . . . 17
3.2 Retrieval System . . . 19
4 User Interface Design 21 4.1 Creation . . . 21 4.2 Investigation . . . 24 4.2.1 Details . . . 24 4.2.2 Viewpoints . . . 25 4.2.3 Filtering Mechanisms . . . 27 4.2.4 Sharing . . . 28 4.3 Alerts . . . 29 4.4 Progress Monitoring . . . 30 5 SQL Translation 33 5.1 Querying Relevant Video . . . 33
5.1.2 Handling Location and Time . . . 34
5.2 Triggers . . . 35
6 User Studies 37 7 Future Directions 39 7.1 Automatic Incident Creation . . . 39
7.2 Additional Video Features . . . 39
7.3 Additional Investigation Tools . . . 41
7.4 Offloading Trigger Function Computation . . . 41
7.5 Additional User Studies . . . 41
8 Conclusion 43
List of Figures
3-1 High level system diagram of Survq. The ingestion component is high-lighted in red. The retrieval component is highhigh-lighted in blue. . . 18
4-1 Section of the creation page where the user inputs high level details of the incident they are registering . . . 22
4-2 Section of the creation page where the user inputs the time they are interested in searching through . . . 22
4-3 Section of the creation page where the user inputs the identifying fea-tures of the suspect they are interested in . . . 23
4-4 Section of the creation page where the user chooses the region of in-terest by selecting a county. . . 23
4-5 Section of the creation page where the user selects the region of interest by marking a map. The icons displayed show known locations of CCTV cameras . . . 24
4-6 The investigation page. The video player is displayed large and takes up most of the page . . . 24
4-7 The details sidebar of the investigation page. Clicking the eye causes it to collapse . . . 25
4-8 The map viewpoint. This shows clusters of video based on where they were recorded geographically . . . 26
4-9 The timeline viewpoint. This shows clusters of video based on the time they were recorded . . . 27
4-10 The list viewpoint. This shows all the videos compactly so users can quickly look through it . . . 27 4-11 Option to mark a video as important on the investigation page . . . . 28 4-12 An example workflow of a user on Survq . . . 28 4-13 A sample csv file that can be exported from Survq . . . 29 4-14 The home page of the Survq application. Clicking on a notification
brings the user to the investigation page for that incident . . . 30 4-15 An example video tagged as new . . . 30 4-16 The progress bar on the investigation page. The top is what is seen
when there is still video queued. The bottom is what is seen when all video has been processed . . . 31
5-1 A sample frame of surveillance video. The camera is located on State Street in West Lafayette, Indiana . . . 34
6-1 The prompt that was given to users when conducting the user study . 38
7-1 A sample incident report used by police officers when conducting in-vestigations . . . 40
List of Tables
6.1 Average score given by users on a variety of usability questions. Scores range from 1 (Unclear) to 5 (Clear). . . 38
Chapter 1
Introduction
In most cities, video cameras monitor activity from light poles, store fronts, police cruisers and public buses. These video sources are useful to police detectives when investigating incidents. However, there is usually no convenient way for investigators to get information from video other than manually searching it from beginning to end. Many man hours are wasted on this tedious process each day. When a suspect appears in a video clip, many questions arise. Who are they? Where are they going? Where are they coming from? What are they up to? It can be difficult to connect related video clips and piece together this information. Video can come from many locations and in various formats. This makes it hard to centralize searching.
In conjunction with Purdue University, the Database Group of MIT has built Survq, a system to aid police investigators in searching through video clips for relevant information on suspects. More generally, it is a query engine for video data. Video is first ingested from a variety of sources in a variety of formats. Novel machine learning methods are applied to small segments of video to mark them with properties of interest. Video segments that match the criteria of a user’s search can then be returned, saving the time that would be required for manual search.
For Survq to be truly helpful to investigators, it must be easy to use. Users need a way to play back video and gather more details about the people detected. It is important to have mechanisms of saving where and when the video was recorded. This can help connect related video segments and help track the movement of an
involved suspect. Investigative work can often happen in real time. This means video data could be captured during an investigation. Alerting users of new video with desired features is obviously important. Bidirectional communication between the interface and the database is necessary to keep the system reactive even if users are offline.
We present the design and implementation of an interface for supporting inves-tigative work. Initial user studies have demonstrated that Survq shows promise in fulfilling the needs of investigators.
Chapter 2
Related Work
2.1
Video Querying and Annotation
Searching video by its content is a task that has been tackled with a variety of approaches. Song et al. presented a semi-automatic video annotation system that utilized an active learning based method for object classification [15]. Nguyen et al. attempted to learn a joint embedding space between human language and video frames to search for matching content generically [9]. Blazeit performed object annotation on video using CNNs. They optimized to support aggregation and limit querying [6]. NoScope employed video annotation models that short circuit at detection time, alleviating the computational demands of video processing at scale [7].
2.2
Interfaces for Surveillance Querying
Others have tried applying video searching techniques to create interfaces for investi-gating annotated, surveillance video. DOTS was a system designed in 2007 to monitor live, security camera feeds and track the people in them. It was designed to operate on a single office space [3]. A group from the University of Belfast built a surveillance interface in 2012 centered around event detection. Events were presented as a list of alerts linking to relevant video clips [8]. Schindler et al. created an interface in 2018 to search video for events by indexing on detected sounds and objects. [14]. They
did not focus on the interface demands for real time reaction and response.
2.3
Trigger Systems and Active Databases
Active database systems are important for many applications. Much work has been done to make event driven systems efficient and effective [17]. Sunrise is a distributed in memory event driven database that was implemented twenty years ago to provide real time event feedback for telecommunication systems [1]. A group from the Israel Institute of Technology built a language that made specifying data driven events easier. [2]. This has been an important area of focus for a while. Our goal is to find a set of optimizations and tools that will work well for a generic Postgres instance and web application.
Chapter 3
System Architecture
Survq can be divided into two major components - an ingestion and a retrieval sys-tem. The ingestion system uploads raw video data to cloud storage, runs a processing framework to determine properties about the video and inserts metadata into a gres database [5]. The retrieval system consists of a user interface and a series of Post-gres triggers needed for bidirectional communication between it and said database. While the scope of this thesis was on the retrieval component, knowing the high level architecture of the entire system is important in understanding the motivation behind many of the design decisions made. A system diagram is shown in Figure 3-1.
3.1
Ingestion System
Ingestion of video can come from a wide variety of sources. This includes CCTV cameras, smartphones and laptop webcams. Video and geolocation data are uploaded to a web server. All video is kept internally consistent by segmenting it into one minute chunks in mp4. The video is then uploaded to flat storage on the Google Cloud Platform [11]. Metadata for each segment is stored in our relational Postgres database [5]. This includes time, location, a link to the video, and an id for the device. Requests for feature extraction on the video segments are established by inserting a request into Postgres.
Figure 3-1: High level system diagram of Survq. The ingestion component is high-lighted in red. The retrieval component is highhigh-lighted in blue.
the database, feature detection servers download the video for processing. A given video segment is sampled at one frame per second, equating to about 60 frames per request. People are identified using the YOLO object detection framework [13]. Key features of people are determined using custom algorithms. Right now, only clothing color and gender are detected, but the system can be arbitrarily extended to any feature or set of features if given the correct machine learning model. Every frame of a given video segment is marked with important features so it can be queried later on. The computing power and resources needed to process hundreds of cameras worth of video is expensive. As a result, processing is deferred to prioritize what is currently being requested by users.
There are some important characteristics of this ingest component that must be reflected in the retrieval system and associated user interface
∙ Video is segmented into one minute chunks and is marked on a per frame basis. This will determine how results are filtered and aggregated
∙ Video processing is deferred. Users must know whether or not video for a query has been processed or if they are still waiting for results
∙ Results can come in when users are not actively using the application. Alerts 18
or notifications must be given to the client later on so they know what is new
3.2
Retrieval System
The retrieval system includes the interface used to watch video and the interactions it has with the database. The interface was designed with investigation in mind. Users walk through a form-based page to insert what they are looking for. This includes location, suspect features and a window of time. Upon submission, an incident is created. Users are redirected to a page where they can perform the investigation. Each incident has an associated query that is used to find relevant video. Users can watch, filter and export the results. More details on how these pages were designed are given in Chapter 4
It is important that users receive notifications when new matching results are found. This must be true even when the application is not in use. Therefore, the retrieval system maintains bidirectional communication with the database. When video properties match the criteria of an incident, a notification record is inserted into Postgres and an alert is fired from it to the user interface. To send these notifications, Postgres triggers are set up on incident creation. More information on these triggers is described in Chapter 5.
Chapter 4
User Interface Design
There are two important actions that a user of the Survq interface will want to take. Creating an incident and investigating an incident. A user creating an incident must log many important details in a way that is not tedious or confusing. A user investigating an incident must be able to easily watch and share video. How video is related may not be initially clear, thus finding ways to visualize patterns is incredibly useful to investigators. Since processing is deferred and investigation may be done as new video is captured, alerting users of unseen content is vital. Here we outline how the design of the user interface satisfies these requirements.
4.1
Creation
For someone who knows SQL, creating a query to search for video may not be com-plicated. Most of the users of Survq will not have that expertise. It is therefore important that we have a robust means for them to fill out all of the information necessary for video retrieval. Fields can often conflict. For example, it is important to know what time an incident was reported. However, relevant video may be present over a very different time frame. To make it clear what field a user is filling out, Survq prompts the user with questions like those shown in 4-1.
Users are first asked to input high level information about an incident. This includes an identifiable name or case number, a detailed description about the
asso-Figure 4-1: Section of the creation page where the user inputs high level details of the incident they are registering
Figure 4-2: Section of the creation page where the user inputs the time they are interested in searching through
ciated event and the date and time of when the event was reported. We then ask the user when they want to search video for, giving them the flexibility to decide if they want a complete day or an hour’s worth of video. Making it apparent how these time values are different was something we found important in our initial attempts at having a user interact with the interface [10]. The query time selector is shown in Figure 4-2.
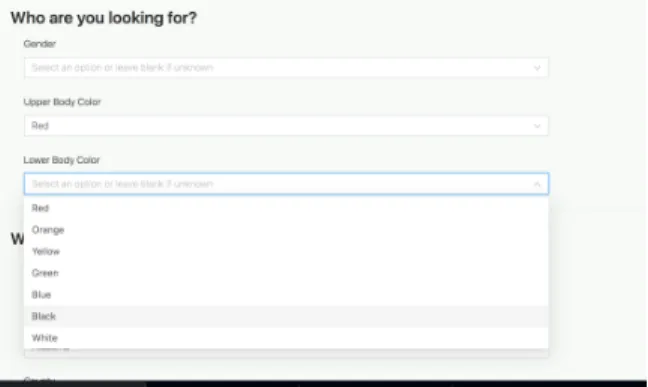
Users are then asked who they are interested in finding. They are given a series of drop downs used to select features about a suspect. This includes gender, upper body color and lower body color. Selectors can be added or changed as new features are incorporated. The current selectors are shown in Figure 4-3
Users must then specify the location of interest. With numerous video sources coming into the system at once, it is important to isolate the region that the in-vestigator thinks the suspect could have been seen. We have two tools for selecting location.
∙ The user can select a county. This is simple and can be defaulted to the county 22
Figure 4-3: Section of the creation page where the user inputs the identifying features of the suspect they are interested in
Figure 4-4: Section of the creation page where the user chooses the region of interest by selecting a county.
of the user’s current location. This method of selection is shown in Figure 4-4
∙ The user can draw a region on a map. This takes more time but can allow the user to isolate their search to a smaller set of cameras. This method of selection is shown in Figure 4-5.
The map users draw a desired region in has icons to show known camera locations. This enables users to make informed decisions about what region they actually want to query video from. Officers are not always familiar with the exact location of all video sources [10].
The process of filling out all the information becomes straightforward. Users first read a short question to understand what they are inputting. They then use a selector designed to make that choice easy and pleasant to log. Once all the questions are answered, the details of the incident are recorded and a robust SQL query can be constructed with no pain placed upon the user.
Figure 4-5: Section of the creation page where the user selects the region of interest by marking a map. The icons displayed show known locations of CCTV cameras
Figure 4-6: The investigation page. The video player is displayed large and takes up most of the page
4.2
Investigation
After creating an incident, users are redirected to a page for performing an investiga-tion. They can immediately begin searching or return to it at a later time. Video is the focal point of this page. While machine learning models do much of the searching by filtering video clips, it is still important for a user to go through and pick out what is relevant to the case they are working on. As such, the video player is large and takes up the majority of the page. The investigation page has many tools for filtering and aggregating video in interesting ways. The page is shown in Figure 4-6.
4.2.1
Details
Investigators need to be able to see details pertaining to the incident they are in-vestigating. This includes a description, a date, suspect characteristics and other metadata. It will remind them of what is being queried and keep them informed if
Figure 4-7: The details sidebar of the investigation page. Clicking the eye causes it to collapse
they want to make any changes to the search criteria. These details are packed with information but are not the main focus of the user. Often times the user who created the incident (and knows all of the details) will be doing the investigating as well. These details should not take up unnecessary space and become a distraction. As a result, they were put in a collapsible side bar so they can be moved out of the way at any time. The details section is shown in Figure 4-7.
4.2.2
Viewpoints
The investigation page offers three ways to view the video results for an incident. A list view, a map view and a timeline view. Each aggregates and presents the data uniquely. These can be incredibly useful in allowing the investigator to pick up patterns and better understand how video segments are related to one another.
Map
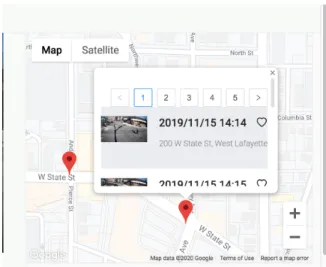
The map viewpoint displays video segments geographically. Locations are clustered into groups within a small radius of one another. They are displayed on a map as pins. Clicking on a pin pulls up a small list of the video segments that occurred there. Video can then be scrolled though and selected. This view can help officers track a
Figure 4-8: The map viewpoint. This shows clusters of video based on where they were recorded geographically
suspect that moves between cameras. This can help discover the path a suspect had taken. It will help investigators understand where a suspect was going, where a suspect was coming from, or where additional information can be found. The map viewpoint is shown in Figure 4-8.
Timeline
The timeline viewpoint aggregates video segments temporally. Groups are created by splitting the video into a fixed number of buckets of even length over the time between the earliest and latest segments. Clicking on a bucket pulls up a small list of the video segments similar to that of the map view. This viewpoint can help officers understand the order a set of events occurred in. They can see who was at a location at different times. They may also see suspects later in multiple video clips, clarifying how long they were at or near a certain location. The timeline viewpoint is shown in Figure 4-9.
List
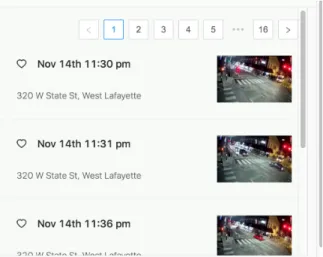
The list viewpoint is a generic compilation of all the relevant video in the system. It is displayed compactly so the user can quickly sift through everything. This is useful for doing a first pass through the video. If an investigator is unsure of where to start,
Figure 4-9: The timeline viewpoint. This shows clusters of video based on the time they were recorded
Figure 4-10: The list viewpoint. This shows all the videos compactly so users can quickly look through it
this viewpoint can help them go through what is available and find that initial clip to investigate. The list viewpoint is shown in Figure 4-10.
4.2.3
Filtering Mechanisms
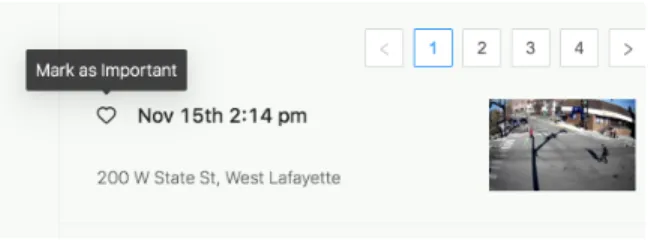
While Survq can filter most of the video for the user, it’s likely only a subset of the returned clips will be relevant to the incident. Users can mark video as important as they search through. This is shown in Figure 4-11. Users are able to later filter down to the videos they’ve marked so only those are present within the various viewpoints.
A sample workflow a user might take when using the system is shown in Figure 4-12. (1) The user creates an incident and is redirected to the investigation page for that incident. (2) The user selects the viewpoint that best matches their needs so they can sift through the video. They may start with the list view so they can
Figure 4-11: Option to mark a video as important on the investigation page
Figure 4-12: An example workflow of a user on Survq
quickly go through everything. (3) The user marks video as important when they notice qualities of interest. (4) The user selects a new viewpoint to look through the filtered version of the video with a new perspective, repeating the process from (2). They may now use the map or timeline views to detect interesting patterns amongst the video they know they care about.
4.2.4
Sharing
At some point, the investigating officer will be content with the video they have marked. While they may have been fine using Survq, it is important they have a way to share the selected video clips with others. There exists an export button on the investigation page that downloads a CSV file containing links to each of the videos that were marked important. This makes it easy to share important videos across a team. An example CSV file is shown in 4-13.
Figure 4-13: A sample csv file that can be exported from Survq
4.3
Alerts
An important quality of Survq is that video can come in at any time. Processing is deferred and the system may be used for real time investigative work. This makes it very likely that results come in both
∙ As the user is interacting with the results on the investigation page ∙ While the user is offline, waiting for video to be processed
Alerting users of new results ensures that they don’t have to place constant at-tention on the application. An icon in the details sidebar presents the option to subscribe to an incident for notifications. The creator of an incident is automatically subscribed. We present subscribed users notifications in two ways to combat the two aforementioned scenarios.
∙ New video is marked on the investigation page with a bright red "new" tag. This shows them what has been seen and what has not.
∙ New results are listed on the home page so they can be seen when offline users return to the application.
Figure 4-14 shows the notifications that are listed on the home page. Each no-tification lists the number of new video segments for each of the incidents they are following. Clicking on a notification brings them to the investigation page for that incident. Figure 4-15 shows the "new" tags that are displayed on the video in the investigation page. Clicking the small close button on the right side signifies that is has been seen and is no longer new.
Figure 4-14: The home page of the Survq application. Clicking on a notification brings the user to the investigation page for that incident
Figure 4-15: An example video tagged as new
4.4
Progress Monitoring
Although users are alerted when new video is available to view, it can be useful for users to also understand how much video is present but has not been processed. If there is a lot of unprocessed video, they may want to wait a few minutes before starting to investigate. A progress bar is displayed at the top of the page. While on the investigation page, the application polls the database every few seconds to update the value of the progress bar. Hovering over the progress bar displays a detailed message to help new users understand what the value refers to. It also encourages users to follow the incident for future notifications. The progress bar is shown in Figure 4-16.
Figure 4-16: The progress bar on the investigation page. The top is what is seen when there is still video queued. The bottom is what is seen when all video has been processed
Chapter 5
SQL Translation
Like many applications, the Survq interface gets all of its data and performs all of its actions by interacting with its database. Almost any action the user takes is translated to a SQL query on the back end server. Data is queried and any needed modifications are made. This is not novel, however, some characteristics of how the Survq interface interacts with its database keep the system scalable and event-driven.
5.1
Querying Relevant Video
Survq was designed to support the simultaneous ingestion of hundreds of video feeds. This leads to a lot of data very quickly. When querying for video, we want to eliminate possibilities efficiently so that queries are fast. Even with perfect video, it is likely our models for classification will make mistakes. We want to support cameras of varying types and quality but we also want to be sure that the results we give to users are actually relevant. This section describes how querying in the system was done to meet these requirements.
5.1.1
Matching Characteristics
Surveillance video from CCTV cameras is not of incredible quality. A sample frame from a camera used by West Lafayette police can be seen in Figure 5-1. Even for
Figure 5-1: A sample frame of surveillance video. The camera is located on State Street in West Lafayette, Indiana
humans, the task of determining the correct color of clothing in this video can be challenging. Our feature detection models are not correct in every single frame. We still want to be confident that returned video truly matches the request of the user and isn’t full of misclassifications. When querying for a video segment, we ensure that at least three frames have people with the desired characteristics before considering it a match. This helps guarantee that the model picked up something it could confidently label.
5.1.2
Handling Location and Time
Location and time are very important search filters. Even if there are thousands of video segments entering the system each day, only a small fraction of them likely match an incident’s time and region. Being able to record and manipulate the time and location associated with video segments is key to eliminate possibilities and keep querying fast.
Videos segments are marked with a start time upon insertion into the database. Since all of the video segments ingested by the system are segmented to be roughly a minute in length, it is easy to know the approximate end of a video clip as well. Users mark a search window when creating an incident in the interface. Checking for overlap amongst video segments and these search windows is straightforward.
Postgis geometry types were used to store location information [12]. Video seg-ments are marked by converting the latitude and longitude of the source to a Postgis
Point. Incidents maintain a Postgis MultiPolygon structure that is either created from the region drawn on the map (through the Google Maps react library) or grabbed from a predefined list of polygons for each county. Videos are checked to match if their Point is contained in the incident’s MultiPolygon with the ST_COVERS command.
Matching video within the desired region of an incident is returned to the inter-face. To visualize these points, we need location information to be returned as well. To avoid constantly converting between Postgis types and conventional latitude and longitude, videos are grouped together in Postgres at query time. Segments within a small radius are clustered with the ST_ClusterWithin command. A mapping of cluster centroid to video records is returned to the interface in addition to the match-ing video. Domatch-ing so eliminates the need to process geography types on the front end when constructing the map viewpoint. It also reduces the number of times we need to convert back and forth between Postgis types.
5.2
Triggers
Postgres triggers allow the Survq interface to maintain bidirectional communication. Upon creation of an incident, a trigger to detect for matching video is created. A trigger function for every incident will be run every time a video has been processed. This is a lot for a system maintaining hundreds of video feeds. As a result, the triggers were designed to place as little impact on database performance as possible.
Each trigger is on the request table through which video processing status is communicated. When processing on a video segment has completed and the status is updated, a trigger for each incident is fired to check if the detected characteristics match. Similar to querying, the first information that is checked is location and time. If one of those is incompatible, the video is not relevant to the incident and can be immediately overlooked. This avoids the need to check every single frame if we know early on it is not a match.
If the video does match, we have to check the results of each processed frame. If there are enough frames with the desired characteristics, we have confidence the
video is relevant to the incident and fire an alert. Subscribed users for the incident are looked up in the database. Notify messages are sent to web socket channels specific to each user. This allows a webserver to only subscribe to the alerts for users they have an active connection with. An alerted web server will send a socket message to the appropriate client. Notifications are stored in the database so inactive users can retrieve them on return to the application.
Chapter 6
User Studies
Due to the COVID-19 lockdown, it was difficult to gather officers from various police departments to use the application. Two officers, Troy Greene of the West Lafayette, IN Police Department [4] and Gerry Palmer of the Chesterfield, NH Police Department [10] looked at the system. Both expressed positive thoughts about how the interface could improve officers’ ability to conduct investigative work. We could not, however, get enough police officers to gather presentable metrics.
Although the target audience was not readily accessible, we still wanted to test the general usability of the interface as a video querying system. We had people use the application to create and investigate an incident on West Lafayette CCTV footage. Users were given the prompt displayed in Figure 6-1. Upon completion, they responded to a series questions asking how clear different aspects of the interface were. They rated each component with a score of 1 (Unclear) to 5 (Clear). The study was conducted with a small sample of 3 users. The results are displayed in Figure 6.1. In general, users quickly understood how to use the application. We found a few challenges that will be alleviated with some small modifications (e.g. moving the export button, choosing a different pin type for map locations). Sentiment was positive overall.
Figure 6-1: The prompt that was given to users when conducting the user study
Was it clear what information you needed to input to create an incident? 5 Was it clear how to select the suspect characteristics you wanted? 4.67 Was it clear how to input the time interval you wanted to search through? 4
Was it clear how to select the region you wanted to search? 3.67 Was it clear how to watch the video you were returned on the investigation page? 4.67 Was it easy to sift through video with the list view? 4.33 Was it easy to sift through video with the map view? 3.67 Was it easy to sift through video with the timeline view? 3
Was it clear how to mark and filter important video? 4.75 Was it clear how to export video? 2.67
Table 6.1: Average score given by users on a variety of usability questions. Scores range from 1 (Unclear) to 5 (Clear).
Chapter 7
Future Directions
Survq and the user interface described have a lot of ways in which they can improve. In this section we describe a few ideas for potential improvement.
7.1
Automatic Incident Creation
While easy incident creation is an important feature that received a lot of attention, the end goal is to fully automate this process. Police departments already have means of recording information in police dispatch reports like the one shown in Figure 7-1. In general, it is inconvenient to have to input information multiple times. Natural language processing methods will be applied to police reports to extract suspect details and metadata about an event.
7.2
Additional Video Features
Clothing color and gender are useful characteristics that officers often list when de-scribing suspects. However, there are many more that are would be valuable to detect. The Lafayette police department gave us a list of 31 features they are interested in as shown in Table 7.1 [4]. It would be more compelling if our system used additional models to mark more of these features.
Figure 7-1: A sample incident report used by police officers when conducting investi-gations
White Black Hispanic Asian Male Female Tattoos Beard Bald Hair color Sandals Shoes Boots Jeans Pants Shorts T-shirt Baseball hat Jacket Tall
Shorts Walking Running Motorcycle Bicycle Truck Passenger car Skateboard Smoking Backpack Headphones
Table 7.1: Video properties of interest to law enforcement.
7.3
Additional Investigation Tools
Officers often take notes when performing investigations. Keeping everything cen-tralized to Survq will make it simple and convenient for users. Adding additional tools, like that for note-taking, would make the system more robust. Being able to leverage the information in notes with natural language processing methods could better enable the system to connect officers to other data sources.
7.4
Offloading Trigger Function Computation
An important realization is that a single Postgres instance is more than enough to support system use under the load of a hundred video feeds. However, for the system to scale beyond that, the execution of trigger functions would bottleneck progress. Trigger functions currently perform a lot of checks and eat up computational load that could be spent handling queries. Logic could be offloaded so that checks are performed on other servers. Load can be distributed by sharding our database with Citus [16], a distributed version of Postgres.
7.5
Additional User Studies
Due to the COVID-19 lockdown, it was difficult to gather users from our target audience to conduct a study. We were able to do a few informal user studies with some officers but have yet to conduct anything with presentable metrics. Ideally, the audience we had collected for the study in Chapter 6 would have consisted of investigators from various police departments. Even though the officers that have used the application have expressed positive sentiment [4] [10], we would like a better understanding of how well the interface can improve investigation.
Chapter 8
Conclusion
Survq is a system that aids officers by finding suspects in video. Novel machine learning methods are used to tag video with characteristics of interest. This enables users to query for video rather than manually searching through it. Much work was put into the user interface to make investigation easy and useful. Different viewpoints and aggregations allow users to detect patterns and relations amongst video that would be difficult to discern otherwise. A complex trigger system allows for bidirectional communication between the interface and database. This helps extend the system for real time use. While there are many ways in which the system can be improved upon, initial user studies and demonstrations have received positive feedback.
Bibliography
[1] Jerry Baulier, Stephen Blott, Henry F. Korth, and Abraham Silberschatz. A database system for real-time event aggregation in telecommunication. In VLDB, 1998.
[2] Opher Etzion. Pardes: A data-driven oriented active database model. SIGMOD Rec., 22(1):7–14, March 1993.
[3] Andreas Girgensohn, Don Kimber, Jim Vaughan, Tao Yang, Frank Shipman, Thea Turner, Eleanor Rieffel, Lynn Wilcox, Francine Chen, and Tony Dunnigan. Dots: Support for effective video surveillance. In Proceedings of the 15th ACM International Conference on Multimedia, MM ’07, page 423–432, New York, NY, USA, 2007. Association for Computing Machinery.
[4] Troy Greene. personal communication, January 2020.
[5] The PostgreSQL Global Development Group. Documentation PostgreSQL 10.3, 2018.
[6] Daniel Kang, Peter Bailis, and Matei Zaharia. Blazeit: Optimizing declarative aggregation and limit queries for neural network-based video analytics. PVLDB, 13(4):533–546, 2019.
[7] Daniel Kang, John Emmons, Firas Abuzaid, Peter Bailis, and Matei Za-haria. Optimizing deep cnn-based queries over video streams at scale. CoRR, abs/1703.02529, 2017.
[8] D Kieran and W Yan. A framework for an event driven video surveillance system. 2010 7th IEEE International Conference on Advanced Video and Signal Based Surveillance, 2010.
[9] Huy Nguyen, Tomo Miyazaki, Yoshihiro Sugaya, and Shinichiro Omachi. Multi-ple visual-semantic embedding for video retrieval from query sentence, 04 2020.
[10] Gerry Palmer. personal communication, March 2020.
[11] Google Cloud Platform. Documentation. https://cloud.google.com/docs.
[12] Postgis. Documentation v3.1. https://postgis.net/documentation/.
[14] Alexander Schindler, Andrew Lindley, Anahid Jalali, Martin Boyer, Sergiu Gordea, and Ross King. Multi-modal video forensic platform for investigating post-terrorist attack scenarios, 04 2020.
[15] Yan Song, Xian-Sheng Hua, Li-Rong Dai, and Meng Wang. Semi-automatic video annotation based on active learning with multiple complementary predic-tors. In Proceedings of the 7th ACM SIGMM International Workshop on Multi-media Information Retrieval, MIR ’05, page 97–104, New York, NY, USA, 2005. Association for Computing Machinery.
[16] Citus Data Team. Documentation v9.2. http://docs.citusdata.com/en/v9.2/.
[17] Luis Vargas, Jean Bacon, and Ken Moody. Event-driven database information sharing. In Alex Gray, Keith Jeffery, and Jianhua Shao, editors, Sharing Data, Information and Knowledge, pages 113–125, Berlin, Heidelberg, 2008. Springer Berlin Heidelberg.