HAL Id: hal-01449339
https://hal.archives-ouvertes.fr/hal-01449339
Submitted on 30 Jan 2017
HAL is a multi-disciplinary open access
archive for the deposit and dissemination of
sci-entific research documents, whether they are
pub-lished or not. The documents may come from
teaching and research institutions in France or
abroad, or from public or private research centers.
L’archive ouverte pluridisciplinaire HAL, est
destinée au dépôt et à la diffusion de documents
scientifiques de niveau recherche, publiés ou non,
émanant des établissements d’enseignement et de
recherche français ou étrangers, des laboratoires
publics ou privés.
coastal ecosystems of an oceanic island
Clément Trystram, Karyne Rogers, Marc Soria, Sébastien Jaquemet
To cite this version:
Clément Trystram, Karyne Rogers, Marc Soria, Sébastien Jaquemet. Feeding patterns of two
sym-patric shark predators in coastal ecosystems of an oceanic island. Canadian Journal of Fisheries and
Aquatic Sciences, NRC Research Press, 2016, �10.1139/cjfas-2016-0105�. �hal-01449339�
ARTICLE
Feeding patterns of two sympatric shark predators in coastal
ecosystems of an oceanic island
Clément Trystram, Karyne M. Rogers, Marc Soria, and Sébastien Jaquemet
Abstract: Stomach contents and stable carbon and nitrogen isotope analyses (␦13C and␦15N) were used to investigate the trophic ecology of two apex predators, tiger sharks (Galeocerdo cuvier) and bull sharks (Carcharhinus leucas), from Reunion Island to describe their dietary habits at both the population and individual levels. In this oceanic island, the tiger and bull sharks were more piscivorous and teutophagous than noted in previous research from other localities. The␦13C values suggested that bull sharks depended on more neritic organic matter sources than tiger sharks, confirming a coastal habitat preference for bull sharks. Moreover, the total length of the bull shark influenced␦13C values, with smaller individuals being more coastal than larger individuals. All indicators suggest that there is a higher degree of similarity between individual tiger sharks compared with the more heterogeneous bull shark population, which is composed of individuals who specialize on different prey. These results suggest that the two species have different functions in these coastal habitats, and thus, they must be considered independently in terms of conservation and management.
Résumé : Les contenus stomacaux et des isotopes stables (␦13C et␦15N) ont été utilisés afin d’étudier l’écologie trophique du requin tigre (Galeocerdo cuvier) et du requin bouledogue (Carcharhinus leucas) a` l’île de La Réunion dans le but de décrire leurs habitudes alimentaires aux échelles populationnelle et individuelle. Dans cette étude, les requins tigre et bouledogue sont plus piscivore et plus teutophages que précédemment indiqué dans d’autres endroits. Le␦13C suggère que les requins bouledogue dépendent de sources de matière organique plus côtières que les requins tigre, confirmant l’aspect côtier de leur habitat. De plus, le␦13C est influencé par la taille des requins bouledogue avec les plus petits individus plus côtiers. Tous les indicateurs suggèrent une plus grande similitude entre les individus de requin tigre comparativement a` la population de requins bouledogues composée d’individus hétérogène, chacun étant spécialisé sur différentes proies. Ces résultats montrent que les deux espèces étudiées ont des fonctions différentes dans les habitats côtiers, montrant l’importance de les considérer indépendamment l’une de l’autre en terme de conservation et de gestion.
Introduction
Understanding the role of large predators in marine ecosystems is important, given that many of these populations are in steep decline, and therefore the critical ecological functions they provide are threatened (Heithaus et al. 2008;Estes et al. 2011). Both empirical and theoretical research supports the belief that large predatory sharks have a key role in marine ecosystem functioning via various processes, such as enhancing ecosystem connectivity due to their high mobility (McCauley et al. 2012) and the top-down pressure they exert on their prey through direct predation (Myers et al. 2007;Baum and Worm 2009;Heupel et al. 2014). Moreover, the presence of pred-ators leads to indirect behavioral effects such as risk avoidance, wherein herbivorous prey become more cautious, thus reducing her-bivore intensity, even in the absence of effective predation (Heithaus et al. 2009;Rizzari et al. 2014). However, all of these effects involve a high plasticity of predator ecological niches, resulting in unpredict-able consequences of predator loss on ecosystem dynamics and eco-logical interactions, including stock exploitation by human fisheries (Newman et al. 2006;Myers et al. 2007;Rizzari et al. 2014).
Tiger sharks (Galeocerdo cuvier) and bull sharks (Carcharhinus leucas) are two of the largest marine top-predators. Both species are wide-spread in tropical and subtropical coastal waters (Compagno 1984).
Bull sharks are one of the few truly euryhaline elasmobranchs and can often be found in freshwater as well as marine environments (Compagno 1984). Although not fully euryhaline, tiger sharks never-theless also exhibit a high level of tolerance for diverse habitats (Compagno 1984). While principally inhabitants of coastal environ-ments, they are known to undertake large-scale oceanic migrations (Werry et al. 2014;Lea et al. 2015). As such, these species are suitable models to test hypotheses about the physical and biological drivers of ecological niche plasticity.
Historically, the trophic ecology of tiger sharks and bull sharks has been studied mainly via analysis of their stomach contents (e.g.,
Rancurel and Intes 1982;Werry 2010;Bornatowski et al. 2014) and, more recently, through the use of nonlethal stable isotope tech-niques (Matich et al. 2011;Daly et al. 2013;Heithaus et al. 2013). Car-bon isotopic values (␦13C) vary between organic matter sources (with higher values for benthic algae than for phytoplankton) and habitats (inshore–offshore gradient, with lower values in offshore environ-ments), whereas the nitrogen isotopic value (␦15N) increases through the food chain (with the relative abundance of15N higher in consum-ers than in prey), providing a tracer of organic matter sources and serving as a proxy for trophic level (Peterson and Fry 1987). As tissue
Received 3 March 2016. Accepted 13 July 2016.
C. Trystram and S. Jaquemet. Université de La Réunion, UMR 9220 ENTROPIE (Université de La Réunion–CNRS–IRD), Avenue René Cassin CS 92003, 97744 Saint-Denis Cedex 9, Ile de La Réunion, France.
K.M. Rogers. National Isotope Centre, GNS Science, P.O. Box 31-312, Lower Hutt, New Zealand.
M. Soria. Institut de Recherche pour le Développement, IRD Réunion, UMR MARBEC (IRD–Ifremer–Univ. Montpellier–CNRS), Parc Technologique Universitaire, 2 rue Joseph Wetzell, 97492 Sainte-Clotilde, Ile de La Réunion, France.
Corresponding author: Clément Trystram (email:clement.trystram@gmail.com).
Copyright remains with the author(s) or their institution(s). Permission for reuse (free in most cases) can be obtained fromRightsLink.
Can. J. Fish. Aquat. Sci. 00: 1–12 (0000)dx.doi.org/10.1139/cjfas-2016-0105
Can. J. Fish. Aquat. Sci. Downloaded from www.nrcresearchpress.com by Couperin on 09/14/16
turnover requires more time than digestion, stable isotopes repre-sent a longer-term average of dietary habits (turnover rates of muscle and blood are approximately 1 year and 7.5 months, respectively, in large shark species;MacNeil et al. 2006;Logan and Lutcavage 2010;
Malpica-Cruz et al. 2012). Although stable isotopes can provide in-formation about long-term dietary habits, they provide much less information about prey taxonomy. Using stable isotope analyses in combination with traditional stomach content analyses forms a robust tool for investigating the trophic ecology of animals (e.g.,
Fisk et al. 2002;Polo-Silva et al. 2013).
Despite both tiger and bull sharks being widely distributed, only a handful of studies have directly compared their trophic ecologies (Matich et al. 2011), and to our knowledge, no study has made inter-species comparisons of the two sharks in the same location and at the same time.Matich et al. (2011)suggested contrasting patterns of individual specialization between these two species (studied in two distinct areas) that result in different functional roles in marine food webs. The presence of these two species in the waters around Re-union Island provides a unique opportunity to explore the relation-ships between these two apex predators.
Reunion Island is a young oceanic island of volcanic origin that lies to the east of Madagascar and within the Madagascar regional hotspot of biodiversity. The geomorphology of the island is char-acterized by the absence of an island shelf, with the exception of the leeward west coast, where it extends up to 5 km offshore. This isolated system is ideal to study tiger and bull shark ecology at a fine spatial scale.
Stomach contents and two tissue types (blood and muscle) with different turnover rates were analyzed using stable isotopes to ascertain the trophic ecology of these two shark species through the following questions: (1) Are they generalist or specialist forag-ers at the population level? (2) Is there overlap in their trophic niches? (3) Are their foraging habits dependent on individual length, body condition, capture season, or sex? (4) Do they exhibit trophic specialization at the individual level (i.e., are individuals homogeneous or heterogeneous)?
Methods
Sample collection and preparation
Muscle and (or) whole blood and (or) stomach content samples from 31 bull sharks (C. leucas) and 65 tiger sharks (G. cuvier) were collected from individuals caught almost exclusively by local fish-erman along the island shelf (⬃160 km2;Fig. 1) between Saint-Paul and Saint-Gilles on the west coast of Reunion Island between Au-gust 2012 and December 2014.
Only individuals older than 2 years of age (i.e., body lengths >200 cm for tiger sharks and >110 cm for bull sharks;Branstetter and Stiles 1987;Branstetter et al. 1987) were included in the study to negate any artifacts of maternal enrichment influences due to slow muscle turn-over rates (Olin et al. 2011). Additional blood samples were collected from live animals during tagging programs (Blaison et al. 2015). All samples were kept in a cool box following collection and thereafter frozen at –20 °C in the laboratory until further analysis.
The prey items retrieved from stomachs were counted, weighed to the nearest 0.01 g, identified to the lowest possible taxonomic level using identification keys adapted to taxonomic groups and (or) to anatomical parts (cephalopod beaks, teleost otoliths, and so forth;
Clarke 1986;Smith and Heemstra 1986;Smale et al. 1995), and then compared with species lists for the area around Reunion (Letourneur et al. 2004;Durville et al. 2009) and our own reference collection. Paired and unpaired otoliths, beaks, and exoskeleton fragments (cephalothorax and abdomen) were used to assess the number of digested fish, cephalopods, and crustaceans, respectively.
To characterize the trophic habitat of Reunion Island sharks, 36 samples of sedimentary organic matter (SOM) were collected between November 2012 and August 2014 at depths ranging from 10 m to 100 m along six inshore–offshore transects. Sixty samples
of particulate organic matter (POM) were also collected at the same time. POM samples were obtained by filtering 5 L of subsurface sea-water through precombusted (4 h at 450 °C) Whatman GF/F filters (25 mm). Filters were then stored in a cool box and brought back to the laboratory, where they were oven-dried at 50 °C for 24 h (Lorrain et al. 2003). Prior to carbon and nitrogen isotope analysis of the organic matter, subsamples of POM and SOM were treated with 1 mol·L–1HCl to remove inorganic carbon (Kolasinski et al. 2011). Published POM and SOM values collected by the same method on the fringing reef of Reunion Island in 2006 and 2007 were used to com-plement the baseline values of the study area (Kolasinski et al. 2011). All samples intended for stable isotope analyses, except POM samples, were freeze-dried at <50 Pa and < –40 °C for 48 h and then ground into a fine, homogeneous powder using an automated grinder. Approximately 0.5 mg of muscle and blood were weighed and packed into tin capsules. Isotopic composition (with a preci-sion of 0.1‰ for␦13C and 0.1‰ for␦15N) and carbon percentage and nitrogen percentage content were measured at the Stable Isotope Laboratory, GNS Science, Lower Hutt, New Zealand, using an Isoprime isotope ratio mass spectrometer interfaced to an EuroEA elemental analyzer in continuous-flow mode (EA-IRMS). The re-sults were expressed in conventional delta notation (␦), according to the following equation (Peterson and Fry 1987):
(1) X⫽ [(Rsample/Rstandard)⫺ 1] 1000
where Rsampleand Rstandardare the fractions of heavy to light iso-topes in the sample and standard, respectively. The␦13C and␦15N
Fig. 1. Map of the fringing reef and particulate organic matter (POM)
and sedimentary organic matter (SOM) sampling sites (solid stars) along Reunion Island’s western leeward coast. Inside reef results (open star) were obtained fromKolasinski et al. (2011).
Can. J. Fish. Aquat. Sci. Downloaded from www.nrcresearchpress.com by Couperin on 09/14/16
isotopes were measured relative to the international standards of Vienna PeeDee Belemnite (VPDB) for carbon and atmospheric air for nitrogen.
Some chemical effects (lipid and urea concentrations) could affect isotopic values, leading several researchers to propose chemi-cal extraction or mathematichemi-cal correction (Hussey et al. 2012a). How-ever, the higher variability in results and interpretations (Logan and Lutcavage 2010;Hussey et al. 2012a) has led others to recommend that no chemical treatment be applied when the C/N ratio (proxy of lipid contents) is low (Post et al. 2007). In our case, the C/N ratio was low (<3.5) and constant between tissue types; therefore, no chemical extraction was undertaken (Matich et al. 2011;Vaudo and Heithaus 2011;Malpica-Cruz et al. 2013).
Diet and trophic niche widths
Prey importance was expressed as the relative numerical abundance (%N, number of individual prey divided by the total number of consumed prey), relative mass abundance (%W), and oc-currence (%O, number of stomachs containing the given prey divided by the total number of stomachs, expressed as a percentage). The trophic niche width (TNW) of each population was calculated using the Shannon diversity index (Bolnick et al. 2002):
(2) TNW⫽ ⫺
兺
k⫽1
S
pkln(pk)
where S is the number of prey families, and p is the proportional numerical abundance of each prey family (%N). This index varies from 0 to ln(S). The Piélou equitability was then calculated as TNW/ln(S), with values varying between 0 (diet dominated by one specific prey type) and 1 (all prey were of equal importance).
Stable isotopes were used to calculate several metrics based on the adaptation of a community index (Layman et al. 2007a) ap-plied at the species scale using each individual as a sampling unit. The mean distance to centroid (CD) provides a measure of the aver-age degree of trophic diversity, which can then be divided into ex-ploited trophic-level diversity (␦15N range: NR) and organic matter source diversity (␦13C range: CR). The mean nearest neighbor dis-tance (MNND) provides a measure of trophic similarity between in-dividuals. Total isotopic niche assessments have previously been determined using the minimum convex hull area (from␦15N–␦13C isotopic plots) that contain all individuals, although it is highly bi-ased by outliers (i.e., individuals with extreme positions;Layman et al. 2007b). Kernel-based estimators are robust for small sample sizes and are less sensitive to outliers but are still capable of consid-ering outliers as part of the overall distribution (Fieberg 2007). Anal-ogous to home range, 95% kernel area was used to assess total isotopic niche (e.g.,Franco-Trecu et al. 2014). The 95% kernel area was generated using the “ks” package of the statistical software R (Duong 2007).
Moreover, the meaningful trophic niche width (i.e., that is likely to be important for a randomly chosen individual) was represented by the standard ellipse corrected for small sample size (SEAc), introduced byJackson et al. (2011)as a bidimensional equivalent of unidimensional mean and variance. Applied SEAc on non-Gaussian distribution could lead to misinterpretation because this representation is based on the bivariate normal distribution hypothesis. If required, outliers were removed one by one until an isotopic normal distribution was obtained. SEAcis independent from sample size, allowing comparison between species with dif-ferent sample sizes (Jackson et al. 2011). Except for kernel area, all other isotopic metrics were calculated using “SIAR”, a statistical software package using R (Parnell and Jackson 2011). As isotopic values are expressed in ‰, the kernel area and SEAcare expressed in ‰2because these indices represent an area extent on the iso-topic biplot.
Evaluation of sampling effort
Sampling effort was evaluated using cumulative curves generated by plotting cumulative observations (number of prey families or the 95% isotopic kernel area) against sampling effort (number of prey-containing stomachs or isotopic value). For stomach contents, indi-vidual ranking was randomized 100 times to eliminate bias (Cortés 1997). For stable isotopes, bootstrap analyses (100 random selections) were performed to examine the mean 95% isotopic kernel area across varying sample sizes. Asymptotic curves were then fitted to the observed cumulative prey curves to assess their theoretical diet diversity and breadth (Dengler 2009). To determine if a curve had reached an asymptote, the slope of a linear regression based on the last four endpoints was statistically compared with zero (Bizzarro et al. 2007). If the slope was not zero, the asymptote was not reached, whereas if the slope was zero, the cumulative curve was considered to reach an asymptote.
Niche overlap
The mean carbon and nitrogen isotope values in muscle and blood samples from both tiger sharks and bull sharks were deter-mined. Differences between species were tested with a Student t test for independent samples for normally distributed data or a Mann–Whitney–Wilcoxon signed rank test for non-normally dis-tributed data. Finally, the area of overlap between the two species’ SEAcwas calculated to assess the extent of isotopic niche overlap between the two species and obtain an interpretable value similar to previous indices.
Similarities between predator species diets were quantified with Czekanowski index (Cxy;Bolnick et al. 2002):
(3) Cxy⫽ 1 ⫺ 1 2
兺
i⫽1 S |pxi⫺ pyi|where S is the number of prey families, and pxand py are the proportional numerical abundances of prey families consumed by species x and y, respectively. Cxyvaries between 0 (complete
parti-tion) and 1 (complete overlap). Analogously with Morisita–Horn index, a Cxygreater than 0.6 will be considered as significant
over-lap (Zaret and Rand 1971).
Length, body condition, year, capture season, and sex effect
The body condition was determined using a ratio based on a measurement of each individual shark’s circumference at the base of the first dorsal fin divided by fork length. The capture season was defined based onConand et al. (2007)monitoring of sea-surface tem-peratures (winter: May–October; summer: November–April). The data were tested for normality using a Jarque–Bera test (Thadewald and Büning 2007). The correlation between two quantitative vari-ables (effect of body condition and fork length on carbon and ni-trogen isotopic values) was tested using a Pearson or Kendall test depending on normality of the variables. The effects of year, capture season, and sex on carbon and nitrogen isotopic values were tested using Student or Mann–Whitney tests depending on variable nor-mality. All statistical analyses were carried out using R 3.1.2 for Win-dows with a significant p level set at 0.05.
Individual specialization
Isotopic values can be used to determine individual feeding stability over time. When more than one isotopic value per indi-vidual is available (e.g., two tissue types), it is possible to separate the total variation into the following two components: the mean sum of square within (MSW) and between (MSB) individuals (Bolnick et al. 2002;Matich et al. 2011). These indices were calculated using the following equations:
Can. J. Fish. Aquat. Sci. Downloaded from www.nrcresearchpress.com by Couperin on 09/14/16
(4) MSW⫽ 1 N(K⫺ 1)
兺
k⫽1 K兺
j⫽1 N (xjk⫺ x¯j) 2 (5) MSB⫽ 1 N⫺ 1兺
j⫽1 N (x¯j⫺ x¯) 2where N is the number of individuals, K is the number of tissues, xjkis the isotopic value (␦13C or␦15N) of tissue k measured on
the jth individual, x¯jis the individual isotopic mean, and x¯ is the
population isotopic mean. Therefore, MSW + MSB represents the total variation, and MSW
MSW⫹MSB(hereinafter IS) measures the rela-tive degree of individual stability, ranging from 0 (constant diet) to 1 (diet change through time). The calculation was performed using two tissues with high turnover rates: muscle (turnover⬃1 year) and whole blood (turnover⬃7.5 months;Malpica-Cruz et al. 2012), so the assessed stability only covered a short time frame (⬃5 months).
An adaptation of the Czekanowski index allows a dietary over-lap calculation between each individual and the overall popula-tion. The mean proportional similarity between individuals and the population (PSI) provided a measure of individual similarity (Bolnick et al. 2002): (6) PSI⫽ 1 N
兺
i⫽1 N冉
1⫺ 1 2兺
j⫽1 S |pij⫺ pj|冊
where N is the number of individuals (stomach number), S is the number of prey categories, pijis the number of jth prey category
individuals found in the ith stomach, and pjis the proportion of
the jth resource category in the population’s niche. Calculated at the individual level, PSI (ranging from 0, a specialist, to 1, a generalist) allowed a statistical comparison between G. cuvier and C. leucas.
Results
Dietary composition
The stomach contents of 24 bull sharks and 58 tiger sharks were analyzed; 16 (67%) and 30 (52%) stomachs were found to contain prey, respectively. The prey items that were identified to the fam-ily level represented 55% and 70% of all prey found in bull and tiger shark stomachs, respectively.
The bull sharks we analyzed fed on three major prey groups, representing 13 prey families, with the most common prey con-sisting of teleosts, represented by 10 identified families, followed by cephalopods and elasmobranchs (Table 1). Indigestible items, such as plastic bags, were found in 25% of bull shark stomachs.
Tiger sharks consumed a wider variety of prey that consisted of eight major prey categories represented by 22 families. The most common prey items were teleosts and cephalopods, followed by birds. Marine turtles, crustaceans, elasmobranchs, land mammals, and sea stars were also recorded in rare instances (Table 1). Indigest-ible items, such as plastic bags, hooks, sand, and vegetables were found in 27% of tiger shark stomachs.
Cumulative curve analyses suggested that C. leucas could con-sume up to 15 prey families and G. cuvier up to 26 prey families, as assessed by asymptote ordinates. The slope of linear regressions performed on the four last points of cumulative curves were sig-nificantly different from 0 (p < 0.05 in both cases), while being very low (0.08 for G. cuvier and 0.07 for C. leucas), demonstrating that the number of C. leucas and G. cuvier stomachs included in the analyses were close to the optimal number necessary for describ-ing the diet (Fig. 2A).
Overall, the stomach content compositions of both species var-ied greatly among individuals, as indicated by the large standard deviations for each parameter compared with the mean values
(Table 2). Thus, the mean number of prey per stomach, the mean mass of the stomach contents, and the mean individual mass of the prey items identified from the stomach contents did not differ significantly between species (Mann–Whitney test, all p > 0.05;
Table 2). The number of prey families found per tiger shark stom-ach (2.4 ± 1.1) was significantly higher than those found in bull shark stomachs (1.8 ± 1.5, Mann–Whitney test, p = 0.043); however, Shannon indices based on numerical abundance (TNW) were quite similar between tiger sharks (2.25) and bull sharks (2.41).
Characterization of organic matter sources
In the study area, POM␦13C values were lower than SOM␦13C values (Welch’s t test, p < 0.001), whereas POM displayed more similar␦15N values than SOM (Welsh’s t test, p = 0.057;Fig. 3A). Organic matter previously sampled from the fringing reef exhib-ited more positive␦13C values and lower␦15N values than organic matter sampled from outside the reef in this study (Fig. 3A). Thus, the organic matter sources exhibited an overall␦13C range of 8.3‰ between nearshore waters and deeper waters.
Shark isotopic niche
Cumulative curve analyses indicated that the maximal isotopic niche (assessed using the kernel approach) for bull sharks would be 4.83‰2 for muscle and 3.97‰2for blood, whereas for tiger sharks, the isotopic niche would extend to 5.93‰2for muscle and 6.76‰2 for blood. Moreover, these analyses indicated that the numbers of individuals included in this study were not sufficient to describe the isotopic diversity for both species given that their cumulative prey curves did not reach an asymptote (all slopes of linear regressions performed on the four last points were signifi-cantly different from 0, p < 0.05 for all test;Fig. 2B). Thus, their isotopic niche sizes appear to be slightly underestimated.
All isotopic niche metrics calculated for both muscle and blood (CR, NR, CD, and 95% kernel) were found to be larger for tiger sharks than for bull sharks (Table 3), whereas CD did not statisti-cally differ between species or tissues (Kruskal test, p = 0.42). The slightly higher mean trophic diversity (assessed by the mean dis-tance to centroid, CD) of tiger sharks compared with bull sharks could be due to the larger range of values for both carbon iso-topes (CR) and nitrogen isoiso-topes (NR). Tiger shark CR represented 63% of the total range of␦13C values for the organic matter sources originating from coral reef and coastal waters, whereas bull shark CR covered 36% of the␦13C value range of organic matter sources (Fig. 3A). The isotopic niche estimates were higher for G. cuvier than for C. leucas using both a kernel approach and unbiased standard ellipse, SEAc. Outliers not included in the calculation of the SEAc(see Materials and methods) had more negative ␦13C values for tiger sharks and less negative␦13C values for bull sharks (Figs. 3Band3C). Finally, the tiger shark population was more homogeneous than the bull shark population and exhibited lower MNNDs (Table 3).
Niche overlap
Bull sharks exhibited carbon isotopic values that were signif-icantly 13C-enriched compared with tiger sharks (Mann– Whitney–Wilcoxon test, p < 0.001 in both tissues;Table 3). Bull shark muscle was slightly15N-enriched compared with tiger shark muscle (Student test, p < 0.001), whereas the two species had similar blood ␦15N values (Student test, p = 0.06). These differences suggested a niche partitioning between the two species, with no SEAcoverlap (Figs. 3Band3C).
This niche partition is also observed with the Czekanowski di-etary overlap index calculated using only the identified prey fam-ilies found in the stomach contents, which was under the 0.6 threshold (Cxy= 0.34).
Length, body condition, year, capture season, and sex effect
Tiger sharks sampled in this study were significantly longer than bull sharks (total length = 333 ± 34 cm and 268 ± 39 cm,
Can. J. Fish. Aquat. Sci. Downloaded from www.nrcresearchpress.com by Couperin on 09/14/16
respectively; Mann–Whitney test, p < 0.001). For tiger sharks, carbon and nitrogen stable isotopes measured in muscle and blood showed no fork length, body condition, seasonal, annual, or sex effects (all tests p > 0.05). In contrast, bull shark muscle ␦13C was affected by fork length␦13C (Pearson test, r = –0.54; p = 0.002). A seasonal effect was also observed in whole blood
␦13C (Student test, p = 0.016), switching from –15.43‰ ± 0.29‰ for individuals caught in the summer to –14.97‰ ± 0.49‰ for animals caught in the winter. Year, body condition, and sex did not affect C. leucas carbon and nitrogen isotopic values (all tests p > 0.05). The␦13C difference between blood and muscle (⌬␦13C
blood–muscle) was positively correlated with fork length
Table 1. Stomach content composition of bull sharks (Carcharhinus leucas) and tiger sharks (Galeocerdo cuvier) caught along the western coast of
Reunion Island, expressed in terms of percentage of number (%N), mass (%W), and occurrence (%O) of prey categories.
Bull sharks Tiger sharks
Branch Family Species %N %W %O %IRI %N %W %O %IRI
Other 8.93 0.73 25.00 1.44 7.43 0.20 26.67 1.47
Aves 6.76 7.77 33.33 3.50
Phasianidae Gallus gallus 4.73 7.56 23.33 5.86
Sternidae Anous sp. 2.03 0.21 10.00 0.46
Echinodermata Goniasteridae Anthenoides sp. 0.68 0.04 3.33 0.05
Mammalia 1.35 0.01 6.67 0.07
Canidae Canis lupus familiaris 0.68 0.48 3.33 0.08
Tenrecidae Tenrec ecaudatus 0.68 0.17 3.33 0.06
Chelonii 2.70 0.14 10.00 0.21
Cheloniidae Chelonia mydas 1.35 0.13 6.67 0.20
Eretmochelys imbricata 0.68 0.00 3.33 0.05 NI 0.68 0.00 3.33 0.05 Cephalopoda 8.93 6.49 31.25 2.86 26.35 5.30 46.67 10.69 NI 0.68 0.02 3.33 0.05 Octopoda 3.57 2.31 12.50 0.01 0.68 0.00 3.33 0.05 Teuthida 5.36 4.18 18.75 0.03 25.00 5.27 43.33 26.78 Crustacea 2.03 0.00 10.00 0.15 Paguroidea 0.68 0.02 3.33 0.05 Isopoda 0.68 0.00 3.33 0.05
Raninidae Ranina ranina 0.68 0.02 3.33 0.05
Elasmobranchii 3.57 0.00 12.50 0.27 2.02 7.22 10.00 0.67 NI 0.68 0.23 3.33 0.06 Torpedinidae 3.57 0.05 12.50 0.01 0.68 5.82 3.33 0.44 Sphyrnidae 0.68 1.17 3.33 0.13 NI 1.35 0.32 6.67 0.08 Teleostei 78.57 92.73 93.75 95.44 49.32 78.33 90.00 83.15 Acanthuridae Brachycentron sp. 1.79 0.18 6.25 0.00 NI 1.79 0.00 6.25 0.00 Balistidae 5.36 1.51 12.50 0.01 0.68 0.20 3.33 0.06 Batrachoididae 1.79 0.08 6.25 0.00
Carangidae Caranx ignobilis 1.35 3.23 6.67 0.62
Caranx sexifaciatus 1.79 20.14 6.25 0.02
NI 1.79 21.30 6.25 0.02 4.73 5.73 10.00 2.14
Selar crumenophthalmus 1.79 0.08 6.25 0.00
Chanidae Chanos chanos 10.71 4.21 12.50 0.03
Coryphaenidae Coryphaena hippurus 0.68 4.67 3.33 0.36
Diodontidae 4.73 5.23 13.33 2.71 Fistulariidae Fistularia sp. 0.68 0.02 3.33 0.05 NI 1.79 0.09 6.25 0.00 6.76 0.31 20.00 2.89 Holocentridae Myripristis sp. 1.79 0.00 6.25 0.00 Sargocentron sp. 0.68 0.04 3.33 0.05 Istiophoridae 1.35 0.00 6.67 0.18
Lutjanidae Aprion virescens 0.68 10.26 3.33 0.74
Lutjanus sp. 3.57 22.47 12.50 0.06
Monacanthidae 0.68 1.70 3.33 0.16
Mullidae Parapeneus barberinus 5.36 2.65 6.25 0.01
Parapeneus sp. 1.79 1.95 6.25 0.00
NI 35.71 16.25 81.25 0.73 19.59 26.39 50.00 46.95
Ostraciidae Lactoria cornuta 0.68 0.43 3.33 0.08
Scaridae 0.68 5.23 3.33 0.40
Scombridae Gymnosarda unicolor 1.79 1.81 6.25 0.00
Katsuwonus pelamis 0.68 2.18 3.33 0.19
NI 3.38 9.49 13.33 3.50
Thunnus albacares 0.68 2.40 3.33 0.21
Tetraodontidae 0.68 0.80 3.33 0.10
Total 56 25 816 g 16 148 63 352 g 30
Note: “Total” summarizes the number of prey identified, the cumulative mass of stomach contents, and the number of stomachs containing identifiable prey.
NI, not identified; IRI, %O(%N + %W), expressed as percentage.
Can. J. Fish. Aquat. Sci. Downloaded from www.nrcresearchpress.com by Couperin on 09/14/16
(r = 0.66; p < 0.001), with longer individuals exhibiting larger intertissue isotopic differences.
Individual specialization
Individual prey specialization was assessed by comparing car-bon and nitrogen isotopes of paired muscle and blood from each of the 22 bull and 49 tiger sharks. Both bull and tiger sharks showed significant isotopic differences between blood and mus-cle (⌬␦13C
blood–muscle= 0.77‰ ± 0.24‰, Student test, p < 0.001, ⌬␦15N
blood–muscle= 0.21‰ ± 0.24‰, Student test, p < 0.001 for bull sharks;⌬␦13C
blood–muscle= 0.80‰ ± 0.40‰, Student test, p < 0.001, ⌬␦15N
blood–muscle= 1.05‰ ± 0.39‰, Mann–Whitney test, p < 0.001 for tiger sharks).
Individual specialization was evaluated using both stable isotopes and stomach contents through the indices IS and PSI, respectively, with higher values indicating greater similarity between individuals. Both methods provided consistent results, with the bull shark pop-ulation being more heterogeneous than the tiger shark poppop-ulation. Actually, bull shark IS ranged from 14% (using␦15N values) to 57% (using␦13C values), whereas tiger shark IS ranged from 59% (using ␦15N values) to 38% (using␦13C values). Moreover, bull shark PSI (0.15 ± 0.13) was significantly lower than tiger shark PSI (0.29 ± 0.18) (Mann–Whitney test, U = 90, p = 0.02).
Discussion
Although bull sharks and tiger sharks have a long history of interaction with humans (Burgess 2016) and are thought to have important roles in ecosystem functioning (Heithaus et al. 2008), only a handful of studies have explored their foraging ecology to any great extent (a compilation of studies focusing on stomach content analyses is presented inTable 4). The limited amount of research on these species is mainly due to the difficulties of
study-ing large and scarce predators, particularly in marine systems. The goal of this study was thus to improve our understanding of the factors influencing trophic niche plasticity. Considering the difficulty to investigate the trophic ecology of these predators, the novelty lies in the use of both stomach content and stable isotope analyses to concomitantly compare two sympatric populations. The description of tiger and bull shark trophic niches was achieved by investigating their pattern of individual specialization. Difficul-ties related to sampling large, mobile, and scarce animals coupled with their opportunistic feeding behavior led to a lower level of statistic robustness as demonstrated by cumulative curves even though our sample size in this study was comparable to those of previous studies.
Dietary habits at Reunion Island confirms the
opportunistic feeding behaviour of tiger and bull sharks
In this study, both tiger and bull sharks were found to be more piscivorous than previously reported (Table 4). Similarly, the dietary contribution of cephalopods was high for both species (based on stomach content found in 47% of tiger shark stomachs and 31% of bull shark stomachs). Such a high proportion of cephalopod con-sumption by sharks has previously only been reported once, in tiger sharks from South Africa (Smale and Cliff 1998), but cephalopods have never been known to exceed 5.8%O of the bull shark diet (Table 4). In contrast with previous studies, turtles, crustaceans, other elasmobranchs, sea snakes, and marine mammals were less abundant or absent in the sharks we analyzed (Table 4). The key difference between the diets of these two species at Reunion Island compared with other localities is likely to be related to the local composition of available prey communities rather than predator selectivity; indeed, both species were considered opportunist be-cause their diets differed regionally. The main prey of tiger sharks have been shown to vary considerably based on location, from
te-Fig. 2. Cumulative prey curves based on (A) stomach contents and (B) stable isotopes. The number of consumed prey families was used as the
taxonomic richness. The dashed lines in panel A represent asymptotic model and associated asymptote ordinate.
Table 2. Stomach-based trophic niche metrics.
C. leucas G. cuvier Statistics
N stomach 16 30
N prey 56 148
Mean TL (min.–max.) 227.1 (178–267) 279.8 (206–336) U = 44.5; p = 0.0001 Mean prey number per stomach 3.5±2.9 4.9±3.2 U = 168; p = 0.096 Mean prey mass (g) 496.5±1170.4 618.8±1231.2 U = 2949; p = 0.33 Mean stomach content mass (g) 1719.1±3528.1 2208.3±2681.4 U = 117; p = 0.17 Taxonomic richness per stomach 1.8±1.5 2.4±1.1 U = 104; p = 0.043
Prey family equitability 0.87 0.70
TNW 2.41 2.25
PSI 0.15±0.13 0.29±0.18 U = 90; p = 0.02
Note: The values are given as the mean ± standard deviation. N stomach, sample size; N prey, number of
prey; TL, predator total length; TNW, total niche width; PSI, individual similarity index. Mean taxonomic richness per stomach is expressed in terms of number of prey families.
Can. J. Fish. Aquat. Sci. Downloaded from www.nrcresearchpress.com by Couperin on 09/14/16
leost fish to sea snakes (in New Caledonia and Eastern Shark Bay), marine turtles (Western Shark Bay), and crustaceans (Northern Ha-waiian Island) (Table 4). Interestingly, some tiger sharks have been shown to travel long distances between abovementioned locations (Lowe et al. 2006;Heithaus et al. 2007;Werry et al. 2014), and thus their diets differ between different locations. These large-scale move-ments between locations highlight the tiger shark’s adaptability to local resource availability. Euryhaline bull sharks can switch be-tween freshwater piscivorous diets and estuary- and marine-based diets (Werry 2010) and demonstrate opportunistic foraging strate-gies, inspecting boats and shore anglers to feed on bait or hooked fish (McCord and Lamberth 2009) or associating with scombrids to feed on anchovy (Pinault and Wickel 2013).
Although the Shannon indices were quite comparable between the two shark species (2.25 for tiger sharks and 2.41 for bull sharks), tiger sharks consumed a wider range of prey (22 prey families belong-ing to eight major prey groups) than bull sharks (13 prey families belonging to three major prey groups). The higher number of prey families consumed by tiger sharks was shown to be independent from sample size (16 versus 30 stomachs containing food for bull and tiger sharks, respectively) because tiger shark’s cumulative prey curve was above that for bull sharks for any given sampling effort. Therefore, the number of prey families potentially consumed by bull sharks (estimated at 15 prey families) is predicted to be less than the number of prey families potentially consumed by tiger sharks (esti-mated at 26 prey families). At the population level, tiger sharks from
Fig. 3. Biplot representing individual carbon and nitrogen stable isotope ratios measured in (A) tiger sharks, bull sharks, and organic matter
sources. POM and SOM are presented as the mean ± standard deviation; reef values were obtained fromKolasinski et al. (2011). (B) Shark muscle and (C) shark blood, illustrating the 95% kernel contour and standard ellipse area (SEAc). Outliers were included in the kernel calculation but not in the SEAcrepresentation.
Can. J. Fish. Aquat. Sci. Downloaded from www.nrcresearchpress.com by Couperin on 09/14/16
Reunion Island would have a larger dietary range than bull sharks in accordance with previous studies (Table 4).
The consumption of a wider range of prey coupled with the fact that C. leucas and G. cuvier did not feed on the same fish families (mostly Fistularidae and Diodontidae found in G. cuvier stomachs and Chanidae and Mullidae in C. leucas stomach) led to a clear trophic niche segregation of these two species, as demonstrated by the low overlap index (equal to 0.34) well below the 0.6 thresh-old of a significant overlap.
In limited coastal environments, tiger and bull sharks reduce the competition for resources
Both stomach contents and stable isotope tiger shark metrics had slightly higher values than bull shark metrics. This observa-tion suggests a higher mobility of tiger sharks than bull sharks and is supported by evidence that tiger sharks undertake large-scale offshore migration (Lowe et al. 2006;Heithaus et al. 2007;
Werry et al. 2014) while bull sharks seem less mobile (but see
Heupel et al. 2015). Tiger sharks appeared to exploit both a greater diversity of organic matter sources and trophic levels. Moreover, bull sharks exhibited higher␦13C values in both muscle and blood than tiger sharks. As carbon isotope values vary between pelagic and benthic organic matter sources, carbon isotopic ratios could be considered as a proxy of feeding distance to shore (France 1995;
Cresson et al. 2012). The difference in␦13C values suggests a seg-regation of trophic habitats between the two species, with bull sharks depending more on neritic production. This trophic niche partitioning agreed with the higher presence rate of tagged bull sharks (30% ± 9%) than tiger sharks (3.2% ± 0.7%) tracked by the network of listening stations deployed along the west coast of Reunion Island (Blaison et al. 2015), as well as with published data (coastal–pelagic tiger sharks and coastal, estuarine, and riverine bull sharks;Werry et al. 2011;Lea et al. 2015).
Both populations exhibited ranges of isotope values compara-ble to the enrichment between a prey and its consumer (i.e., the difference between the individual presenting the lowest values and the individual presenting the highest values was about one trophic level:⬃1‰ ␦13C,⬃2‰ ␦15N;Hussey et al. 2010;Olin et al.
2013).
However, both tiger and bull sharks analyzed in this particular study presented a narrower isotopic niche width than has been previously found (Matich et al. 2011;Daly et al. 2013;Heithaus et al. 2013); for instance, 18 bull sharks sampled in Mozambique had a ␦13C range of 6‰ (Daly et al. 2013), whereas our study of 27 bull sharks sampled in Reunion Island had a␦13C range of only 2.5‰. Nevertheless, the extrapolation from the isotopic niche to the trophic niche depends on the isotopic range of food and nutrient
sources (Newsome et al. 2007). In fact, the␦13C values of both bull sharks and tiger sharks covered 30% and 63% of the range of organic matter sources, respectively, demonstrating a high diver-sity of resource use in the coastal ecosystems of Reunion Island. Thus, the␦13C range difference between that found in this study and the scientific literature is probably due to the lower diversity of organic matter sources around Reunion Island compared with the large continental shelves offshore of other locations, such as Mozambique, Australia, and Florida, which experience strong flu-vial (containing freshwater and terrestrial) inputs.
Bull sharks do not exhibit the same foraging strategies over time
At the intraspecific level, bull shark␦13C values were influenced by individual fork length (longer individuals had more negative ␦13C
musclevalues) and capture season (␦13Cbloodvalues were greater between November and May than between April and October). The seasonal influence on␦13C may result either from a baseline seasonal variation or small-scale seasonal movement along the inshore– offshore gradient or a baseline seasonal variation. The body length effect on␦13C suggested that smaller bull sharks derived their energy from resources that depend on coastal primary production, as was found in another empirical study from eastern Australia (Werry et al. 2011). It is important to note, however, that this length effect was detected only in individuals longer than 205 cm (length at ma-turity is approximately 204 cm;Cruz-Martínez et al. 2004). Conse-quently, this result demonstrated that mature individuals are not homogeneous and that foraging shifts occur not only between immature and mature stages but also within the mature stage. Further sampling of juveniles and subadults would be necessary to explore ontogenetic trophic shifts and confirm this trend. The absence of length and seasonal effects on the blood and muscle isotope values for tiger sharks suggests that dietary shifts in this species are limited across adulthood and that individuals exploit the coastal environment of Reunion Island similarly all year round.
Individual specialization is higher in bull sharks compared with tiger sharks
Tiger and bull shark populations displayed almost identical iso-topic niches (assessed by SEAc) despite tiger sharks consuming a higher diversity of prey families. The two following hypotheses could explain this finding: (i) a greater isotopic redundancy of tiger shark prey (interpretable in terms of functional redundancy by ex-trapolation) and (or) (ii) a greater dietary similarity among tiger sharks than among bull sharks. It is not possible to delineate be-tween these hypotheses without sampling prey for stable isotope
Table 3. Metrics quantifying isotopic niche.
Tiger shark (G. cuvier) Bull shark (C. leucas)
Tissue Muscle Blood Muscle Blood
N
Mean fork length (min.–max.; cm) 333 (246–402) 333 (246–402) 268 (205–325) 272 (205–325)
Mean␦13C (‰) –16.91±0.68 –16.13±0.82 –15.79±0.55 –15.15±0.51 CR (‰) 4.10 5.21 2.58 2.53 Mean␦15N (‰) 11.96±0.71 12.97±0.62 12.54±0.60 12.69±0.57 NR (‰) 2.96 2.47 2.2 2.04 C/N 2.90±0.13a 2.84±0.26a 3.02±0.09b 2.97±0.18b TA (‰2) 5.84 6.33 3.90 3.35
CD (‰) 0.78±0.59a 0.84±0.72a 0.67±0.44a 0.60±0.42a
MNND ± SD (‰) 0.16±0.17 0.20±0.27 0.27±0.34 0.24±0.28
95 K (‰2) 4.18 4.64 2.82 2.51
SEAc(‰2) 0.63 0.64 0.48 0.61
Note: N, number of samples; CR and NR, ranges of␦13C and␦15N values, respectively; TA, convex hull area;
CD, mean distance to centroid; MNND, mean nearest neighbor distance; 95 K, 95% kernel area; SEAc, standard
ellipse area. Letters indicate statistically significant differences by a Kruskal–Wallis test coupled with Mann– Whitney multiple comparisons.
Can. J. Fish. Aquat. Sci. Downloaded from www.nrcresearchpress.com by Couperin on 09/14/16
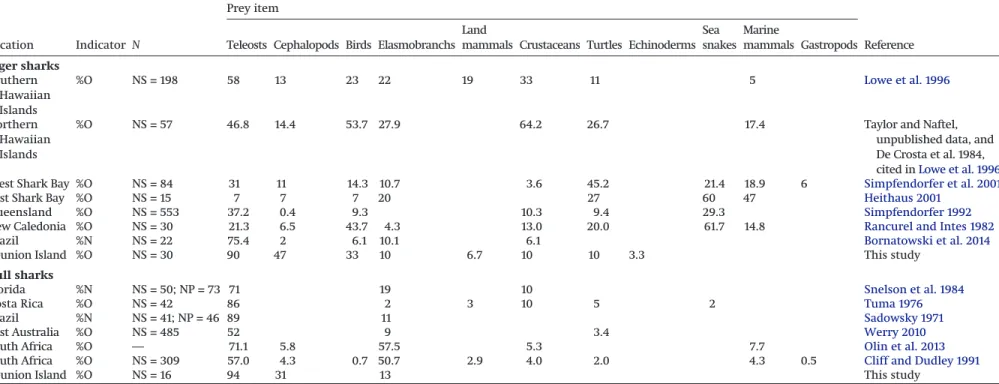
Table 4. A global review of the dietary composition of tiger sharks (Galeocerdo cuvier) and bull sharks (Carcharhinus leucas) from previous studies expressed as a percentage of occurrence (%O) and number (%N).
Prey item
Location Indicator N Teleosts Cephalopods Birds Elasmobranchs Land
mammals Crustaceans Turtles Echinoderms Sea snakes
Marine
mammals Gastropods Reference Tiger sharks Southern Hawaiian Islands %O NS = 198 58 13 23 22 19 33 11 5 Lowe et al. 1996 Northern Hawaiian Islands
%O NS = 57 46.8 14.4 53.7 27.9 64.2 26.7 17.4 Taylor and Naftel, unpublished data, and De Crosta et al. 1984, cited inLowe et al. 1996
West Shark Bay %O NS = 84 31 11 14.3 10.7 3.6 45.2 21.4 18.9 6 Simpfendorfer et al. 2001
East Shark Bay %O NS = 15 7 7 7 20 27 60 47 Heithaus 2001
Queensland %O NS = 553 37.2 0.4 9.3 10.3 9.4 29.3 Simpfendorfer 1992
New Caledonia %O NS = 30 21.3 6.5 43.7 4.3 13.0 20.0 61.7 14.8 Rancurel and Intes 1982
Brazil %N NS = 22 75.4 2 6.1 10.1 6.1 Bornatowski et al. 2014
Reunion Island %O NS = 30 90 47 33 10 6.7 10 10 3.3 This study Bull sharks
Florida %N NS = 50; NP = 73 71 19 10 Snelson et al. 1984
Costa Rica %O NS = 42 86 2 3 10 5 2 Tuma 1976
Brazil %N NS = 41; NP = 46 89 11 Sadowsky 1971
East Australia %O NS = 485 52 9 3.4 Werry 2010
South Africa %O — 71.1 5.8 57.5 5.3 7.7 Olin et al. 2013
South Africa %O NS = 309 57.0 4.3 0.7 50.7 2.9 4.0 2.0 4.3 0.5 Cliff and Dudley 1991
Reunion Island %O NS = 16 94 31 13 This study
Note: NS, number of stomachs; NP, number of prey.
Pagination
not
final
(cite
DOI)
/
Pagination
provisoire
(citer
le
DOI)
al. 9 Published by NRC Research PressCan. J. Fish. Aquat. Sci. Downloaded from www.nrcresearchpress.com by Couperin on 09/14/16
analysis, but other clues derived from both stomach contents and stable isotopes indicated that there was a higher degree of similarity in prey items among tiger shark individuals than among bull shark individuals. The feeding niche of bull sharks was more equitably partitioned between individuals who specialized on different prey than that of tiger sharks, as suggested by a lower taxonomic richness per stomach coupled with higher equitability at the population scale. In a theoretical case, if each individual feeds on unique prey, with key differences from one individual to another, then pooling all individuals would result in a good equitability at the population level, with very low taxonomic diversity per stomach. Furthermore, the bull shark mean overlap between each individual and the popu-lation average diet (expressed as PSI) was significantly lower than in tiger sharks. This indicated that tiger shark individuals’ diet was more similar to each other than diet within bull shark individuals, which were composed of heterogeneous individuals. Isotopically, smaller isotope nearest neighbor distances and a greater ratio of intertissue to interindividual difference (the IS index) also suggested a greater similarity between generalist tiger shark individuals (Bolnick et al. 2002;Layman et al. 2007a). Based on both stable isotopes and stomach contents, the IS based on two high turnover rates tissues (i.e., measuring diet stability between 1 year and several months before catch) to the PSI based on the individual’s last meals were consistent.
Dietary resources (in term of species number and biomass) are an important parameter affecting individual specialization; the higher the diversity of resources (number of prey species), the higher the individual predator specialization (Araújo et al. 2011). Moreover, in the case of resource scarcity (low biomass), individuals who specialize on a narrow range of prey demonstrated higher for-aging efficiency than those exploiting more diverse resources (Bolnick et al. 2003). In Reunion Island, a high number of species and low biomass compared with other localities in the Indian Ocean (Chabanet et al. 2002,2016;Pinault et al. 2013) would be expected to promote individual specialization, especially for neritic bull sharks that forage chiefly on coastal fish in these small coastal ecosystems. This pattern of heterogeneous bull sharks and homogeneous tiger sharks in terms of diet has been observed in geographically distinct populations (Florida and Australia, respectively), which could thus be interpreted as being context-dependent (Matich et al. 2011). Our results demonstrated different feeding patterns between two sympa-tric apex predator populations in a ressympa-tricted habitat area, suggest-ing that difference in individual specialization is not only context-dependent but also species-context-dependent. Further assessment of bull and tiger shark relative abundance in the region is needed to esti-mate intensity of inter- and intraspecific competition and thus their importance in coastal ecosystems. Moreover, sampling potential prey for stable isotopes would help to both quantify long-term shark diet through mixing models and the trophic environment of the studied shark population.
Caution should be taken when interpreting the results of multitis-sue stable isotope analyses, as physiological (tismultitis-sue-specific discrimi-nation factor) and chemical (lipid and urea concentration) effects could lead to intertissue isotopic differences even with a constant diet (Hussey et al. 2012b). Indeed, trophic discrimination factors (i.e., differences between prey and consumer) depend on consumer spe-cies, diet quality, and tissue type (Malpica-Cruz et al. 2012;Caut et al. 2013). No controlled feeding experiments have ever been performed on tiger and bull sharks, and published studies on other species do not provide any applicable generalizations (such as correction fac-tors between muscle and blood;Malpica-Cruz et al. 2012;Caut et al. 2013). The trend that emerges from these studies suggests a reduc-tion in␦13C
blood–musclevalues with treatment, with no effect on ni-trogen isotopes, which would exacerbate the observed degree of individual dissimilarity without affecting differences between tiger shark and bull shark populations.
This study was the first to examine the trophic ecology of the sympatric tiger shark and bull shark populations in an isolated oceanic island using both stomach content and multitissue stable
isotope analyses. The results of this study demonstrated the clear segregation in the foraging niches of these two apex predators, even for individuals caught in the same area during the same time period, underlining the existence of mechanisms that moderate trophic competition between the two shark species in coastal habi-tats with limited food resources. This further suggests that the two species have different functions in these coastal habitats and, as such, must be considered independently in terms of conservation and management. Further research on other coastal and oceanic predators (such as giant trevally (Caranx ignobilis) and yellowfin tuna (Thunnus albacares)), prey availability, and relative abundance of tiger and bull sharks in the region would help to better understand their ecological functions.
Acknowledgements
This study was carried out under the scientific program CHARC (Connaissances de l’écologie et de l’habitat de deux espèces de re-quins côtiers a` La Réunion) with financial support from the Com-mission of the European Communities (FEDER fund), the French Government, and the Regional Council of Reunion Island. This work was also supported in part by the Western Indian Ocean Marine Science Association (WIOMSA), under a MARG ii Grant (contract 4/2012). The views expressed herein are those of the authors and do not necessarily reflect the views of WIOMSA and Swedish Interna-tional Development Cooperation Agency. CT was also supported by the Europe Social Fund through a PhD grant delivered by Regional Council of Reunion Island. The authors are grateful to the fishermen of Reunion Island, A. Blaison, B. Reche (veterinarian), D. Guyomard (Comité Régional des Pêches Maritimes et des Elevages Marins de La Réunion), and the numerous other individuals who participated in sample collection.
References
Araújo, M.S., Bolnick, D.I., and Layman, C.A. 2011. The ecological causes of indi-vidual specialisation. Ecol. Lett. 14(9): 948–958. doi:10.1111/j.1461-0248.2011. 01662.x. PMID:21790933.
Baum, J.K., and Worm, B. 2009. Cascading top-down effects of changing oceanic predator abundances. J. Anim. Ecol. 78(4): 699–714. doi:10.1111/j.1365-2656. 2009.01531.x. PMID:19298616.
Bizzarro, J.J., Robinson, H.J., Rinewalt, C.S., and Ebert, D.A. 2007. Comparative feeding ecology of four sympatric skate species off central California, U.S.A. Environ. Biol. Fishes, 80: 197–220. doi:10.1007/s10641-007-9241-6.
Blaison, A., Jaquemet, S., Guyomard, D., Vangrevelynghe, G., Gazzo, T., Cliff, G., Cotel, P., and Soria, M. 2015. Seasonal variability of bull and tiger shark presence on the west coast of Reunion Island, western Indian Ocean. African J. Mar. Sci. 37(2): 199–208. doi:10.2989/1814232X.2015.1050453.
Bolnick, D.I., Yang, L.H., Fordyce, J.A., and Davis, J.M. 2002. Measuring individual-level resource specialization. Ecology, 83(10): 2936–2941. doi:10. 1890/0012-9658(2002)083[2936:MILRS]2.0.CO;2.
Bolnick, D.I., Svanbäck, R., Fordyce, J.A., Yang, L.H., Davis, J.M., Hulsey, C.D., and Forister, M.L. 2003. The ecology of individuals: incidence and implications of individual specialization. Am. Nat. 161(1): 1–28. doi:10.1086/343878. PMID: 12650459.
Bornatowski, H., Braga, R.R., Abilhoa, V., and Corrêa, M.F.M. 2014. Feeding ecol-ogy and trophic comparisons of six shark species in a coastal ecosystem off southern Brazil. J. Fish Biol. 85(2): 246–263. doi:10.1111/jfb.12417. PMID: 24919949.
Branstetter, S., and Stiles, R. 1987. Age and growth estimates of the bull shark,
Curcharhinus zeucas, from the northern Gulf of Mexico. Environ. Biol. Fishes,
20(3): 169–181. doi:10.1007/BF00004952.
Branstetter, S., Musick, J.A., and Colvocoresses, J.A. 1987. A comparison of the age and growth of the tiger shark (Galeocerdi cuvieri), from off Virginia and from the northwetsern Gulf of Mexico. Fish. Bull. 85(2): 269–279.
Burgess, G.H. 2016. ISAF statistics on attacking species of shark [online]. Avail-able from https://www.flmnh.ufl.edu/fish/isaf/contributing-factors/species-implicated-attacks/.
Caut, S., Jowers, M.J., Michel, L., Lepoint, G., and Fisk, A.T. 2013. Diet- and tissue-specific incorporation of isotopes in the shark Scyliorhinus stellaris, a North Sea mesopredator. Mar. Ecol. Prog. Ser. 492: 185–198. doi:10.3354/meps10478. Chabanet, P., Bigot, L., Naim, O., Garnier, R., Tessier, E., and Moyne-Picard, M.
2002. Coral reef monitoring at Reunion island (Western Indian Ocean) using the GCRMN method. In Proceedings of the Ninth International Coral Reef Symposium, Bali, 23–27 October 2000. pp. 873–878.
Chabanet, P., Bigot, L., Nicet, J.-B., Durville, P., Massé, L., Mulochau, T., Russo, C., Tessier, E., and Obura, D. 2016. Coral reef monitoring in the Iles Eparses,
Can. J. Fish. Aquat. Sci. Downloaded from www.nrcresearchpress.com by Couperin on 09/14/16
Mozambique Channel (2011–2013). Acta Oecol. 72: 62–71. doi:10.1016/j.actao. 2015.10.010.
Clarke, M.R. 1986. A handbook for the identification of cephalopods’ beaks. Clarendon Press, Oxford.
Cliff, G., and Dudley, S.F.J. 1991. Sharks caught in the protective gill nets off Natal, South Africa. 4. The bull shark Carcharhinus leucas Valenciennes. S. Afr. J. Mar. Sci. 10: 253–270. doi:10.2989/02577619109504636.
Compagno, L.J.V. 1984. Sharks of the World. Vol. 4, Part 2, Carcharhiniformes. Fao Species Catalogue. In Food and Agriculture Organisation of the United Nations Fisheries Synopsis, Rome.
Conand, F., Marsac, F., Tessier, E., and Conand, C. 2007. A ten-year period of daily sea surface temperature at a coastal station in Reunion Island, Indian Ocean (July 1993 – April 2004): patterns of variability and biological responses. W. Ind. Ocean J. Mar. Sci. 6(1): 1–16. doi:10.4314/wiojms.v6i1.48222. Cortés, E. 1997. A critical review of methods of studying fish feeding based on
analysis of stomach contents: application to elasmobranch fishes. Can. J. Fish. Aquat. Sci. 54(3): 726–738. doi:10.1139/f96-316.
Cresson, P., Ruitton, S., Fontaine, M.-F., and Harmelin-Vivien, M. 2012. Spatio-temporal variation of suspended and sedimentary organic matter quality in the Bay of Marseilles (NW Mediterranean) assessed by biochemical and iso-topic analyses. Mar. Pollut. Bull. 64(6): 1112–1121. doi:10.1016/j.marpolbul.2012. 04.003. PMID:22541382.
Cruz-Martínez, A., Chiappa-Carrara, X., and Arenas-Fuentes, V. 2004. Age and growth of the Bull Shark, Carcharhinus leucas, from southern Gulf of Mexico. J. Northw. Atl. Fish. Sci. 35: 367–374. doi:10.2960/J.v35.m481.
Daly, R., Froneman, P.W., and Smale, M.J. 2013. Comparative feeding ecology of bull sharks (Carcharhinus leucas) in the coastal waters of the southwest Indian Ocean inferred from stable isotope analysis. PLoS ONE, 8(10): e78229. doi:10. 1371/journal.pone.0078229. PMID:24205168.
Dengler, J. 2009. Which function describes the species-area relationship best? A review and empirical evaluation. J. Biogeogr. 36: 728–744. doi:10.1111/j.1365-2699.2008.02038.x.
Duong, T. 2007. ks: Kernel density estimation and kernel discriminant analysis for multivariate data in R. J. Stat. Softw. 21(7): 1–16. doi:10.18637/jss.v021.i07. Durville, P., Mulochau, T., Barrere, A., Quod, J., Quero, J., and Ribes, S. 2009. Inventaire des poissons récoltés lors de l’éruption volcanique d’avril 2007 du piton de la Fournaise (île de La Réunion). Ann. la société des Sci. Nat. 9(9): 948–956.
Estes, J.A., Terborgh, J., Brashares, J.S., Power, M.E., Berger, J., Bond, W.J., Carpenter, S.R., Essington, T.E., Holt, R.D., Jackson, J.B.C., Marquis, R.J., Oksanen, L., Oksanen, T., Paine, R.T., Pikitch, E.K., Ripple, W.J., Sandin, S.A., Scheffer, M., Schoener, T.W., Shurin, J.B., Sinclair, A.R.E., Soulé, M.E., Virtanen, R., and Wardle, D.A. 2011. Trophic downgrading of planet Earth. Science, 333: 301–306. doi:10.1126/science.1205106. PMID:21764740. Fieberg, J. 2007. Kernel density estimators of home range: smoothing and the
autocorrelation red herring. Ecology, 88(4): 1059–1066. doi:10.1890/06-0930. PMID:17536721.
Fisk, A.T., Tittlemier, S.A., Pranschke, J.L., and Norstrom, R.J. 2002. Using anthropogenic contaminants and stable isotopes to assess the feeding ecol-ogy of greenland sharks. Ecolecol-ogy, 83(8): 2162–2172. doi:10.1890/0012-9658 (2002)083[2162:UACASI]2.0.CO;2.
France, R.L. 1995. Carbon-13 enrichment in benthic compared to planktonic algae: foodweb implications. Mar. Ecol. Prog. Ser. 124: 307–312. doi:10.3354/ meps124307.
Franco-Trecu, V., Aurioles-Gamboa, D., and Inchausti, P. 2014. Individual trophic specialisation and niche segregation explain the contrasting population trends of two sympatric otariids. Mar. Biol. 161(3): 609–618. doi:10.1007/s00227-013-2363-9.
Heithaus, M.R. 2001. The biology of tiger sharks, Galeocerdo cuvier, in Shark Bay, Western Australia: sex ratio, size distribution, diet, and seasonal changes in catch rates. Environ. Biol. Fishes, 61: 25–36. doi:10.1023/A:1011021210685. Heithaus, M.R., Wirsing, A.J., Dill, L.M., and Heithaus, L.I. 2007. Long-term
move-ments of tiger sharks satellite-tagged in Shark Bay, Western Australia. Mar. Biol. 151(4): 1455–1461. doi:10.1007/s00227-006-0583-y.
Heithaus, M.R., Frid, A., Wirsing, A.J., and Worm, B. 2008. Predicting ecological consequences of marine top predator declines. Trends Ecol. Evol. 23(4): 202– 210. doi:10.1016/j.tree.2008.01.003. PMID:18308421.
Heithaus, M.R., Wirsing, A.J., Burkholder, D., Thomson, J., and Dill, L.M. 2009. Towards a predictive framework for predator risk effects: the interaction of landscape features and prey escape tactics. J. Anim. Ecol. 78(3): 556–562. doi:10.1111/j.1365-2656.2008.01512.x. PMID:19076259.
Heithaus, M., Vaudo, J., Kreicker, S., Layman, C., Krützen, M., Burkholder, D., Gastrich, K., Bessey, C., Sarabia, R., Cameron, K., Wirsing, A., Thomson, J., and Dunphy-Daly, M. 2013. Apparent resource partitioning and trophic struc-ture of large-bodied marine predators in a relatively pristine seagrass ecosys-tem. Mar. Ecol. Prog. Ser. 481: 225–237. doi:10.3354/meps10235.
Heupel, M., Knip, D., Simpfendorfer, C., and Dulvy, N. 2014. Sizing up the eco-logical role of sharks as predators. Mar. Ecol. Prog. Ser. 495: 291–298. doi:10. 3354/meps10597.
Heupel, M.R., Simpfendorfer, C.A., Espinoza, M., Smoothey, A.F., Tobin, A., and Peddemors, V. 2015. Conservation challenges of sharks with continental scale migrations. Front. Mar. Sci. 2: 1–7. doi:10.3389/fmars.2015.00012. Hussey, N.E., Brush, J., McCarthy, I.D., and Fisk, A.T. 2010.␦15N and␦13C
diet-tissue discrimination factors for large sharks under semi-controlled condi-tions. Comp. Biochem. Physiol. A. Mol. Integr. Physiol. 155(4): 445–453. doi: 10.1016/j.cbpa.2009.09.023. PMID:19800980.
Hussey, N.E., MacNeil, M.A., Olin, J.A., McMeans, B.C., Kinney, M.J., Chapman, D.D., and Fisk, A.T. 2012a. Stable isotopes and elasmobranchs: tissue types, methods, applications and assumptions. J. Fish Biol. 80(5): 1449– 1484. doi:10.1111/j.1095-8649.2012.03251.x. PMID:22497393.
Hussey, N.E., Olin, J.A., Kinney, M.J., McMeans, B.C., and Fisk, A.T. 2012b. Lipid extraction effects on stable isotope values (␦13C and␦15N) of elasmobranch
muscle tissue. J. Exp. Mar. Biol. Ecol. 434-435: 7–15. doi:10.1016/j.jembe.2012. 07.012..
Jackson, A.L., Inger, R., Parnell, A.C., and Bearhop, S. 2011. Comparing isotopic niche widths among and within communities: SIBER — Stable Isotope Bayes-ian Ellipses in R. J. Anim. Ecol. 80(3): 595–602. doi:10.1111/j.1365-2656.2011. 01806.x. PMID:21401589.
Kolasinski, J., Rogers, K., Cuet, P., Barry, B., and Frouin, P. 2011. Sources of particulate organic matter at the ecosystem scale: A stable isotope and trace element study in a tropical coral reef. Mar. Ecol. Prog. Ser. 443: 77–93. doi: 10.3354/meps09416.
Layman, C.A., Arrington, D.A., Montaña, C.G., and Post, D.M. 2007a. Can stable isotope ratios provide for community-wide measures of trophic structure? Ecology, 88(1): 42–48. doi:10.1890/0012-9658(2007)88[42:CSIRPF]2. 0.CO;2. PMID:17489452.
Layman, C.A., Quattrochi, J.P., Peyer, C.M., and Allgeier, J.E. 2007b. Niche width collapse in a resilient top predator following ecosystem fragmentation. Ecol. Lett. 10(10): 937–944. doi:10.1111/j.1461-0248.2007.01087.x. PMID:17845294. Lea, J.S.E., Wetherbee, B.M., Queiroz, N., Burnie, N., Aming, C., Sousa, L.L.,
Mucientes, G.R., Humphries, N.E., Harvey, G.M., Sims, D.W., and Shivji, M.S. 2015. Repeated, long-distance migrations by a philopatric predator targeting highly contrasting ecosystems. Sci. Rep. 5: 1–11. doi:10.1038/srep11202. Letourneur, Y., Chabanet, P., Durville, P., Taquet, M., Teissier, E., Parmentier, M.,
Quéro, J., and Pothin, K. 2004. An updated checklist of the marine fish fauna of Reuin Island, South-Western Indian Ocean. Cybium, 28(3): 199–216. Logan, J.M., and Lutcavage, M.E. 2010. Stable isotope dynamics in elasmobranch
fishes. Hydrobiologia, 644(1): 231–244. doi:10.1007/s10750-010-0120-3. Lorrain, A., Savoye, N., Chauvaud, L., Paulet, Y.-M., and Naulet, N. 2003.
Decar-bonation and preservation method for the analysis of organic C and N con-tents and stable isotope ratios of low-carbonated suspended particulate material. Anal. Chim. Acta, 491: 125–133. doi:10.1016/S0003-2670(03)00815-8. Lowe, C.G., Wetherbee, B.M., Crow, G.L., and Tester, A.L. 1996. Ontogenic dietary shifts and feeding behavior of the tiger shark, Galeocerdo cuvier, in Hawaiian waters. Environ. Biol. Fishes, 47: 203–211. doi:10.1007/BF00005044. Lowe, C.G., Wetherbee, B.M., and Meyer, C.G. 2006. Using acoustic telemetry
monitoring techniques to quantify movement patterns and site fidelity of sharks and giant trevally around French Frigate shoals and Midway atoll. Atoll Res. Bull. 543: 281–303.
MacNeil, M.A., Drouillard, K.G., and Fisk, A.T. 2006. Variable uptake and elimi-nation of stable nitrogen isotopes between tissues in fish. Can. J. Fish. Aquat. Sci. 63(2): 345–353. doi:10.1139/f05-219.
Malpica-Cruz, L., Herzka, S.Z., Sosa-Nishizaki, O., and Lazo, J.P. 2012. Tissue-specific isotope trophic discrimination factors and turnover rates in a marine elasmobranch: empirical and modeling results. Can. J. Fish. Aquat. Sci. 69(3): 551–564. doi:10.1139/f2011-172.
Malpica-Cruz, L., Herzka, S.Z., Sosa-Nishizaki, O., and Escobedo-Olvera, M.A. 2013. Tissue-specific stable isotope ratios of shortfin mako (Isurus oxyrinchus) and white (Carcharodon carcharias) sharks as indicators of size-based differ-ences in foraging habitat and trophic level. Fish. Oceanogr. 22(6): 429–445. doi:10.1111/fog.12034.
Matich, P., Heithaus, M.R., and Layman, C.A. 2011. Contrasting patterns of individual specialization and trophic coupling in two marine apex predators. J. Anim. Ecol. 80(1): 294–305. doi:10.1111/j.1365-2656.2010.01753.x. PMID:20831730. McCauley, D.J., Young, H.S., Dunbar, R.B., Estes, J.A., Semmens, B.X., and
Micheli, F. 2012. Assessing the effects of large mobile predators on ecosystem connectivity. Ecol. Appl. 22(6): 1711–1717. doi:10.1890/11-1653.1. PMID:23092009. McCord, M., and Lamberth, S. 2009. Catching and tracking the world’s largest
Zambezi (bull) shark Carcharhinus leucas in the Breede Estuary, South Africa: the first 43 hours. Afr. J. Mar. Sci. 31(1): 107–111. doi:10.2989/AJMS.2009.31.1. 11.782.
Myers, R.A., Baum, J.K., Shepherd, T.D., Powers, S.P., and Peterson, C.H. 2007. Cascading effects of the loss of apex predatory sharks from a coastal ocean. Science, 315(5820): 1846–1850. doi:10.1126/science.1138657. PMID:17395829. Newman, M.J.H., Paredes, G.A., Sala, E., and Jackson, J.B.C. 2006. Structure of
Caribbean coral reef communities across a large gradient of fish biomass. Ecol. Lett. 9: 1216–1227. doi:10.1111/j.1461-0248.2006.00976.x. PMID:17040324. Newsome, S.D., Martinez del Rio, C., Bearhop, S., and Philips, D.L. 2007. A niche for isotopic ecology. Front. Ecol. Environ. 5(8): 429–436. doi:10.1890/ 060150.01.
Olin, J.A., Hussey, N.E., Fritts, M., Heupel, M.R., Simpfendorfer, C.A., Poulakis, G.R., and Fisk, A.T. 2011. Maternal meddling in neonatal sharks: implications for interpreting stable isotopes in young animals. Rapid Com-mun. Mass Spectrom. 25(8): 1008–1016. doi:10.1002/rcm.4946. PMID:21452377. Olin, J.A., Hussey, N.E., Grgicak-Mannion, A., Fritts, M.W., Wintner, S.P., and Fisk, A.T. 2013. Variable␦15N diet-tissue discrimination factors among sharks: