Does product design really determine 80% of manufacturing cost?
Texte intégral
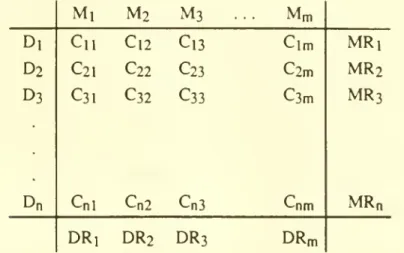
Figure

Documents relatifs
All companies involved in the user group of this project indicate a clear need to support their engineers with methods and software tools enabling assessment of assembly complexity
As a consequence, it is possible that the simultaneous occurrence of both the linking and the updating processes be responsible for the in- creased reading times at the region
La reconnaissance de ce tronçon nouveau du drain sud, tout en relançant les perspectives de progression, a permis de faire des observations très importantes sur la circulation
on the geometrical tolerance allocation... The choice of the assembly techniques directly impacts the activity cost of the assembly process plan. It also indirectly im- pacts
The United States is building three 40-ton, 8-T, superconducting toroidal field (TF) coils for evaluation in the international Large Coil Task (LCT)./l/ Coils by
Le dispositif d'attelage à boule doit être monté dans des emplacements prévus a ce but par le fabricant de voiture.. Instructions
properties such as stiffness and strength needed for developing the analytical models that were used for the investigation. With the advent of high-speed computers
using a species pool with medium niche differences and medium fitness values at the species 600.
