DATA-DRIVEN MODELING OF AIR TRAFFIC FLOWS FOR
ADVANCED AIR TRAFFIC MANAGEMENT
Mayara Condé Rocha Murça and R. John Hansman
This report is based on the Doctoral Dissertation of Mayara Condé Rocha Murça submitted to the Department of Aeronautics and Astronautics in partial fulfillment
of the requirements for the degree of Doctor of Philosophy at the Massachusetts Institute of Technology.
The work presented in this report was also conducted in collaboration with the members of the Doctoral Committee:
Prof. R. John Hansman (Chair) Prof. Hamsa Balakrishnan
Dr. Tom G. Reynolds
Report No. ICAT-2019-04 April 2019
MIT International Center for Air Transportation (ICAT) Department of Aeronautics & Astronautics
Massachusetts Institute of Technology Cambridge, MA 02139 USA
Data-Driven Modeling of Air Traffic Flows for
Advanced Air Traffic Management
by
Mayara Condé Rocha Murça
Submitted to the Department of Aeronautics and Astronautics on August 23, 2018, in partial fulfillment of the
requirements for the degree of
Doctor of Philosophy in Aeronautics and Astronautics
Abstract
The Air Traffic Management (ATM) system enables air transportation by ensuring a safe and orderly air traffic flow. As the air transport demand has grown, ATM has become increasingly challenging, resulting in high levels of congestion, flight delays and environmental impacts. To sustain the industry growth foreseen and enable more efficient air travel, it is important to develop mechanisms for better understanding and predicting the air traffic flow behavior and performance in order to assist human decision-makers to deliver improved airspace design and traffic management solutions. This thesis presents a data-driven approach to modeling air traffic flows and analyzes its contribution to supporting system level ATM decision-making. A data analytics framework is proposed for high-fidelity characterization of air traffic flows from large-scale flight tracking data. The framework incorporates a multi-layer clustering analysis to extract spatiotemporal patterns in aircraft movement towards the identification of trajectory patterns and traffic flow patterns. The outcomes and potential impacts of this framework are demonstrated with a detailed characterization of terminal area traffic flows in three representative multi-airport (metroplex) systems of the global air transportation system: New York, Hong Kong and Sao Paulo.
As a descriptive tool for systematic analysis of the flow behavior, the framework allows for cross-metroplex comparisons of terminal airspace design, utilization and traffic perfor-mance. Novel quantitative metrics are created to summarize metroplex efficiency, capacity and predictability. The results reveal several structural, operational and performance dif-ferences between the metroplexes analyzed and highlight varied action areas to improve air traffic operations at these systems.
Finally, the knowledge derived from flight trajectory data analytics is leveraged to de-velop predictive and prescriptive models for metroplex configuration and capacity planning decision support. Supervised learning methods are used to create prediction models capa-ble of translating weather forecasts into probabilistic forecasts of the metroplex traffic flow structure and airport capacity for strategic time horizons. To process these capacity fore-casts and assist the design of traffic flow management strategies, a new optimization model for capacity allocation is developed. The proposed models are found to outperform currently used methods in predicting throughput performance at the New York airports. Moreover,
when used to prescribe optimal Airport Acceptance Rates in Ground Delay Programs, an overall delay reduction of up to 9.7% is achieved.
Thesis Supervisor: R. John Hansman
Acknowledgments
The author would like to thank the support from the Aeronautics Institute of Technology (ITA), the Brazilian Air Force (FAB), the Brazilian Federal Agency for Support and Eval-uation of Graduate Education (CAPES) and the Latin American Scholarship Program of American Universities (LASPAU). In addition, the author would like to thank the members of the doctoral committee, Prof. John Hansman, Prof. Hamsa Balakrishnan and Dr. Tom Reynolds, for all the guidance and feedback throughout the development of the research, as well as the thesis readers, Dr. James Jones and Prof. Carlos Müller, for their technical and editorial comments. The author also thanks all the collaborators, especially Richard DeLaura and Dr. Lishuai Li, for providing data and valuable insights.
Contents
1 Introduction 25
1.1 Motivation . . . 25
1.2 Thesis Objectives . . . 29
1.3 Methodological Approach . . . 29
1.4 Background and Related Literature . . . 32
1.4.1 An Overview of Air Traffic Management . . . 32
1.4.2 Challenges in Metroplex Air Traffic Management . . . 36
1.4.3 Optimization Models for Air Traffic Management . . . 39
1.4.4 Data Analytics for Air Traffic Management . . . 43
1.4.5 Data-Driven Modeling of Air Traffic Flows . . . 45
1.4.6 Data-Driven Modeling of Airport Capacity . . . 49
1.5 Contributions of the Thesis . . . 53
1.6 Organization of the Thesis . . . 56
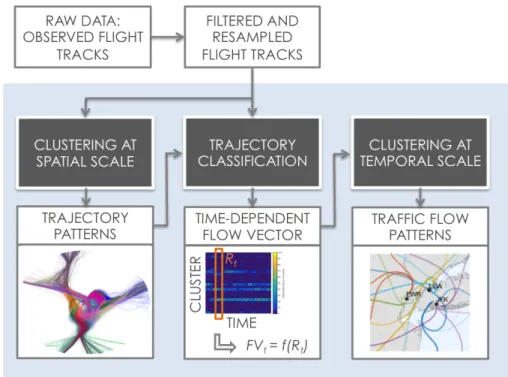
2 Flight Trajectory Data Analytics Framework for Characterization of Air Traffic Flows 57 2.1 Overview of Methodological Approach . . . 57
2.2 Dataset Description . . . 58
2.3 Clustering at Spatial Scale: Trajectory Clustering . . . 59
2.3.1 Trajectory Representation . . . 62
2.3.2 Trajectory Similarity Assessment . . . 62
2.3.3 Trajectory Clustering Method . . . 63
2.4 Trajectory Classification . . . 67
2.4.1 Matching Flight Trajectories with Learned Trajectory Patterns . . . . 69
2.4.2 Identifying Non-Conforming Trajectories . . . 72
2.4.3 Flow Identification . . . 77
2.5 Clustering at Temporal Scale: Time-Dependent Flow Vector Clustering . . . 78
3 Comparative Analysis of Terminal Area Operations in Multi-Airport Sys-tems 81 3.1 Case Studies . . . 81
3.1.1 New York Multi-Airport System . . . 84
3.1.2 Hong Kong Multi-Airport System . . . 86
3.1.3 Sao Paulo Multi-Airport System . . . 87
3.2 Data Description . . . 89
3.3 Characterization of Structural Differences through the Analysis of Terminal Area Route Structures . . . 89
3.3.1 Identification of Trajectory Patterns . . . 89
3.3.2 Identification of Route Intersections . . . 93
3.4 Characterization of Operational Differences through the Analysis of Traffic Flow Dynamics . . . 97
3.4.1 Identification of Metroplex Flow Patterns . . . 97
3.4.2 Identification of Metroplex Flow Interactions . . . 112
3.5 Characterization of Performance Differences . . . 115
3.5.1 Efficiency . . . 115
3.5.2 Capacity . . . 121
3.5.3 Predictability . . . 127
3.6 Discussion . . . 130
4 Data-Driven Approach for Metroplex Configuration and Capacity Plan-ning 133 4.1 Metroplex Configuration and Airport Capacity Planning Framework . . . 134
4.2.1 Terminal Aerodrome Forecast (TAF) . . . 135
4.2.2 Arrival Route Status and Impact (ARSI) Forecast . . . 136
4.2.3 Hourly Airport Reports . . . 136
4.2.4 Flight Tracks . . . 137
4.3 Prediction Models and Features . . . 137
4.4 Prediction of Traffic Flow Patterns . . . 140
4.4.1 Classification Models . . . 140
4.4.2 Performance Evaluation . . . 144
4.5 Prediction of Airport Arrival Capacity . . . 149
4.5.1 Regression Models . . . 149
4.5.2 Performance Evaluation . . . 155
4.6 Prescription of Airport Arrival Rates . . . 164
4.6.1 Ground Delay Programs . . . 164
4.6.2 AAR Planning Model . . . 165
4.6.3 Analysis of Impacts on GDP planning . . . 171
5 Conclusions and Future Work 179 5.1 Summary . . . 179
5.2 Future Research Directions . . . 182
A Trajectory Clustering Analysis Results - New York Metroplex 185
B Trajectory Clustering Analysis Results - Hong Kong Metroplex 193
List of Figures
1-1 Trajectories of arrival flights into JFK during two different time periods on
June 23, 2015 overlaid with the Standard Terminal Arrival Routes. . . 28
1-2 General ways by which data analytics affects decision-making. . . 30
1-3 Ways by which the flight trajectory data analytics framework can impact ATM. 31 1-4 Airport/airspace capacity influencing factors. . . 35
1-5 ATM functional structure. . . 36
1-6 Example spatiotemporal patterns in trajectory datasets [1]. . . 46
1-7 Example of typical runway configurations at JFK. . . 50
1-8 Capacity curves for two different runway configurations at JFK (data from 2013-2015). . . 51
1-9 View of thesis contributions in the context of the ATM decision-making process. 55 2-1 Schematic overview of flight trajectory data analytics framework for charac-terization of air traffic flows. . . 58
2-2 Resampled flight trajectory data. . . 63
2-3 Illustration of DBSCAN concepts. . . 65
2-4 Percentage of noise associated with the clustering output obtained with dif-ferent parameter settings (MinP ts, "). . . 67
2-5 Silhouette Index associated with the clustering output obtained with different parameter settings (MinP ts, "). . . 68
2-6 Silhouette Index versus number of clusters identified. . . 69
2-7 (a) Clusters of arrival trajectories. (b) Silhouette plot. . . 70
2-9 Example of dataset and resulting decision tree for classification. . . 71
2-10 Flow matrix for LGA arrivals on May 24, 2013. . . 78
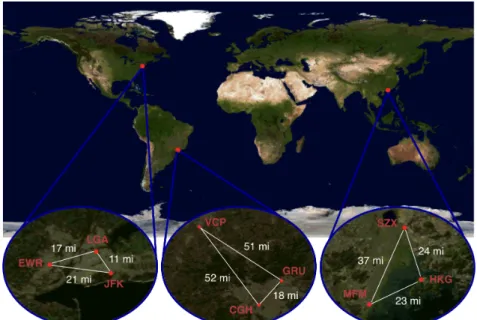
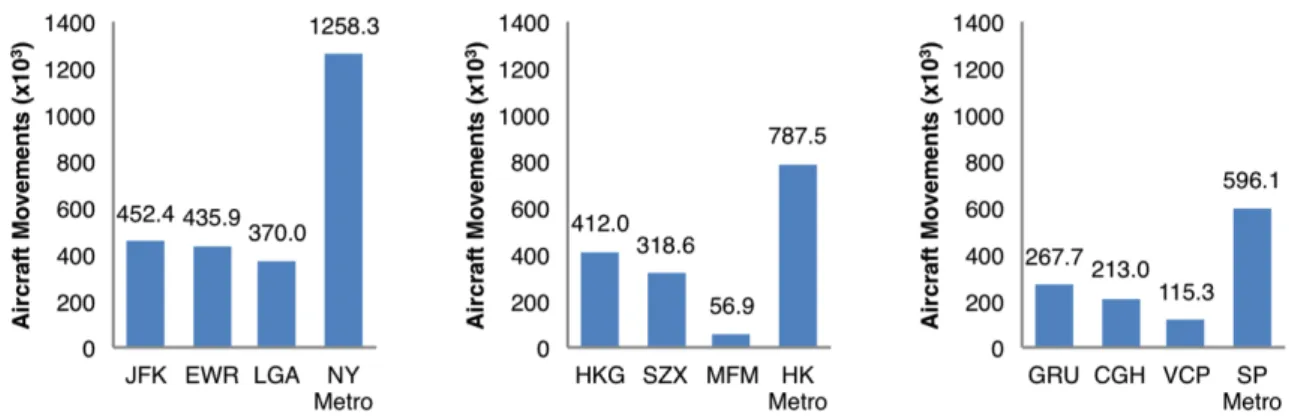
3-1 Location of airports in the New York, Hong Kong and Sao Paulo metroplexes. 82 3-2 Passenger movement by airport at the New York, Hong Kong and Sao Paulo metroplexes in 2016. . . 83
3-3 Aircraft movement by airport at the New York, Hong Kong and Sao Paulo metroplexes in 2016. . . 83
3-4 Arrival and departure trajectories for one day of terminal area operations in the New York, Hong Kong and Sao Paulo multi-airport systems. . . 83
3-5 Shared airspace regions between JFK and LGA [2]. . . 84
3-6 Runway infrastructure in the New York metroplex. . . 85
3-7 Runway infrastructure in the Hong Kong metroplex. . . 87
3-8 Runway infrastructure in the Sao Paulo metroplex. . . 88
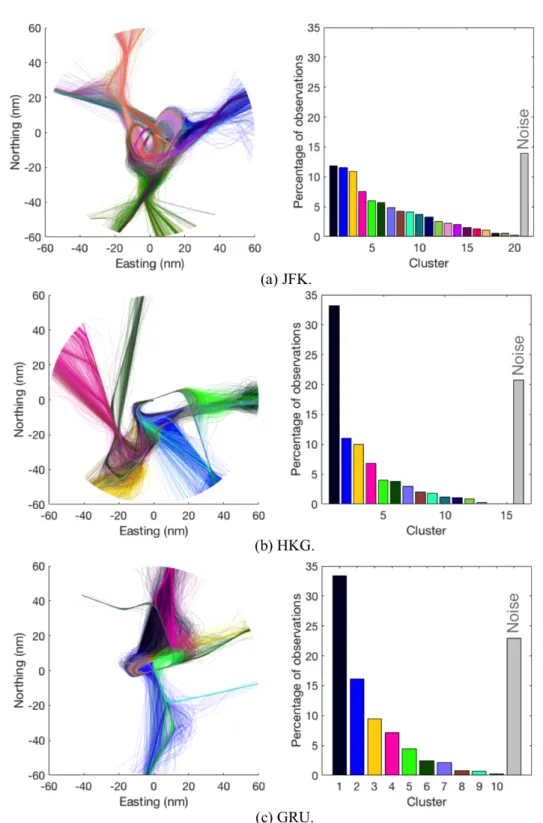
3-9 Clusters of arrival trajectories; each color represents one cluster; grey bar represents the percentage of noise observations. . . 90
3-10 Centroids of metroplex arrival trajectory clusters. . . 91
3-11 Centroids of metroplex departure trajectory clusters. . . 92
3-12 Example of different trajectory patterns from arrival fix to runway threshold 22 at LGA. . . 93
3-13 Characterization of trajectory tube intersections. . . 94
3-14 Example of intersection between JFK and LGA arrival trajectory tubes. . . . 96
3-15 Example of intersection between SZX and MFM arrival trajectory tubes. . . 97
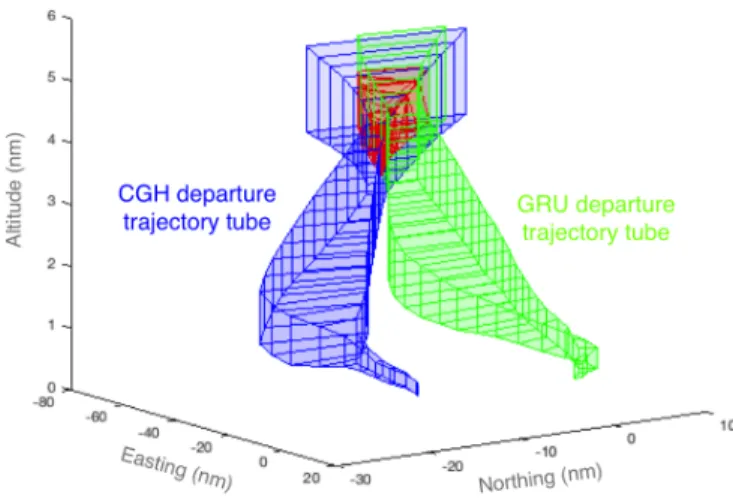
3-16 Example of intersection between GRU and CGH departure trajectory tubes. 97 3-17 Cumulative percentage of observations for the clusters of hourly flow vectors identified. . . 100
3-18 Most frequently observed New York MFPs. . . 102
3-19 Convention on flow direction. . . 102
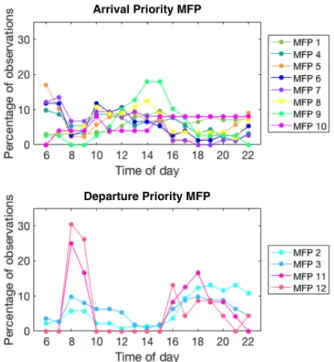
3-20 New York MFP frequency of occurrence by time of day. . . 105
3-22 Distribution of metroplex arrival and departure throughput for the New York
metroplex MFPs. . . 106
3-23 New York MFP frequency of occurrence under VMC and IMC. . . 107
3-24 Most frequently observed Hong Kong MFPs. . . 108
3-25 Hong Kong MFP frequency of occurrence by time of day. . . 109
3-26 Hong Kong MFP frequency of occurrence under VMC and IMC. . . 109
3-27 Most frequently observed Sao Paulo MFPs. . . 110
3-28 Sao Paulo MFP frequency of occurrence by time of day. . . 111
3-29 Daily demand pattern at GRU, based on data of 2017. . . 112
3-30 Sao Paulo MFP frequency of occurrence under VMC and IMC. . . 112
3-31 Trajectory tube intersections associated with flow dependencies in the New York metroplex. . . 114
3-32 Example of path stretch calculation. . . 116
3-33 Structural path stretch for arrivals. . . 117
3-34 Structural path stretch for arrivals by MFP. . . 117
3-35 Lateral and temporal traffic flow efficiency. . . 119
3-36 Distribution of traffic flow efficiency by MFP. . . 119
3-37 Average daily percentage of non-conforming arrival trajectories. . . 120
3-38 Example non-conforming arrival trajectories identified for a convective weather day at JFK, HKG and GRU. . . 121
3-39 New York metroplex arrival throughput as a function of the arrival demand in the terminal area. . . 122
3-40 Excess terminal area transit time as a function of the arrival demand. . . 122
3-41 Throughput-demand curves for the New York MFPs. . . 124
3-42 Delay-demand curves for the New York MFPs. . . 124
3-43 Throughput-demand curves for the Hong Kong MFPs. . . 125
3-44 Delay-demand curves for the Hong Kong MFPs. . . 125
3-45 Throughput-demand curves for the Sao Paulo MFPs. . . 125
3-46 Delay-demand curves for the Sao Paulo MFPs. . . 125 3-47 Metroplex arrival rates under persistent demand and associated level of delay. 126
4-1 Metroplex configuration and airport capacity planning framework. . . 135 4-2 Histogram of hourly airport arrival rates. . . 137 4-3 Forecasting procedure throughout the planning horizon. . . 140 4-4 Parameter sensitivity of RF model based on 5-fold cross validation
perfor-mance. (a) Impacts of the minimum size of leaf node on the classification error. (b) Impacts of the number of predictors to sample at each split on the classification error. . . 142 4-5 Statistically derived crosswind thresholds by MFP. . . 145 4-6 Statistically derived tailwind thresholds by MFP. . . 145 4-7 Multi-way classification accuracy of NN, RF and SVM traffic flow pattern
prediction models for forecast horizons of 1 h to 6 h. . . 146 4-8 Brier score of NN, RF and SVM traffic flow pattern prediction models for
forecast horizons of 1 h to 6 h. . . 147 4-9 Accuracy of traffic flow pattern forecasts for RF model and static model as a
function of the look-ahead time of the prediction. . . 148 4-10 Classification confusion matrix for traffic flow pattern predictions for a forecast
horizon of 3 h. . . 149 4-11 Parameter sensitivity of RF regression model based on 5-fold cross validation
performance. (a) Impacts of the minimum size of leaf node on the prediction error. (b) Impacts of the number of predictors to sample at each split on the prediction error. . . 152 4-12 NRMSE of BR, RF and GP capacity prediction models for forecast horizons
of 1 h to 6 h. . . 156 4-13 MAPE of BR, RF and GP capacity prediction models for forecast horizons of
1 h to 6 h. . . 156 4-14 Predictor importance estimates from RF model. . . 157 4-15 PC of BR, RF and GP capacity prediction models for 50%, 70% and 90%
confidence levels and forecast horizons of 1 h to 6 h. . . 158 4-16 NRMSE of alternative GP capacity prediction models for forecast horizons of
4-17 MAPE of GP model capacity predictions and baseline capacity estimates for JFK and forecast horizons of 1 h to 6 h. . . 161 4-18 MAPE of GP model capacity predictions and baseline capacity estimates for
EWR and forecast horizons of 1 h to 6 h. . . 161 4-19 MAPE of GP model capacity predictions and baseline capacity estimates for
LGA and forecast horizons of 1 h to 6 h. . . 162 4-20 Histogram of prediction errors for GP model predictions (for 3-h look-ahead
time) and baseline capacity estimates for JFK. . . 163 4-21 Histogram of prediction errors for GP model predictions (for 3-h look-ahead
time) and baseline capacity estimates for EWR. . . 163 4-22 Histogram of prediction errors for GP model predictions (for 3-h look-ahead
time) and baseline capacity estimates for LGA. . . 164 4-23 Expected delay costs and computational time as a function of the number of
capacity profiles. . . 172 4-24 Planned ground delay costs as a function of robustness parameter ↵. . . 173 4-25 Expected airborne delay costs as a function of robustness parameter ↵. . . . 173 4-26 Actual delay costs as a function of robustness parameter ↵. . . 174 4-27 Actual delay costs (averaged over all test cases) as a function of robustness
parameter ↵. . . 174 4-28 GDP delay cost predictability as a function of robustness parameter ↵. . . . 175 4-29 Optimized arrival rates as a function of robustness parameter ↵. . . 175 4-30 Difference between the revised and the initially planned ground delays as a
function of robustness parameter . . . 176 4-31 Difference between the revised and the initially expected airborne delays as a
function of robustness parameter . . . 176 4-32 Planned delay costs for revised and initial plans as a function of robustness
parameter (averaged over all test cases). . . 176 4-33 Actual delay costs for revised and initial plans as a function of robustness
parameter (averaged over all test cases). . . 176 4-34 Comparison between GDP costs resulting from data-driven and baseline AAR. 177
4-35 MAPE of GP model capacity predictions (averaged over planning horizon) for
GDP test cases. . . 178
A-1 JFK arrival trajectory clusters; each color represents one cluster. . . 186
A-2 JFK arrival trajectories labeled as noise. . . 186
A-3 Centroids of JFK arrival trajectory clusters. . . 186
A-4 Distribution of JFK arrival trajectories by cluster; grey bar represents the percentage of noise. . . 186
A-5 JFK departure trajectory clusters; each color represents one cluster. . . 187
A-6 JFK departure trajectories labeled as noise. . . 187
A-7 Centroids of JFK departure trajectory clusters. . . 187
A-8 Distribution of JFK departure trajectories by cluster; grey bar represents the percentage of noise. . . 187
A-9 EWR arrival trajectory clusters; each color represents one cluster. . . 188
A-10 EWR arrival trajectories labeled as noise. . . 188
A-11 Centroids of EWR arrival trajectory clusters. . . 188
A-12 Distribution of EWR arrival trajectories by cluster; grey bar represents the percentage of noise. . . 188
A-13 EWR departure trajectory clusters; each color represents one cluster. . . 189
A-14 EWR departure trajectories labeled as noise. . . 189
A-15 Centroids of EWR departure trajectory clusters. . . 189
A-16 Distribution of EWR departure trajectories by cluster; grey bar represents the percentage of noise. . . 189
A-17 LGA arrival trajectory clusters; each color represents one cluster. . . 190
A-18 LGA arrival trajectories labeled as noise. . . 190
A-19 Centroids of LGA arrival trajectory clusters. . . 190
A-20 Distribution of LGA arrival trajectories by cluster; grey bar represents the percentage of noise. . . 190
A-21 LGA departure trajectory clusters; each color represents one cluster. . . 191
A-23 Centroids of LGA departure trajectory clusters. . . 191
A-24 Distribution of LGA departure trajectories by cluster; grey bar represents the percentage of noise. . . 191
B-1 HKG arrival trajectory clusters; each color represents one cluster. . . 194
B-2 HKG arrival trajectories labeled as noise. . . 194
B-3 Centroids of HKG arrival trajectory clusters. . . 194
B-4 Distribution of HKG arrival trajectories by cluster; grey bar represents the percentage of noise. . . 194
B-5 HKG departure trajectory clusters; each color represents one cluster. . . 195
B-6 HKG departure trajectories labeled as noise. . . 195
B-7 Centroids of HKG departure trajectory clusters. . . 195
B-8 Distribution of HKG departure trajectories by cluster; grey bar represents the percentage of noise. . . 195
B-9 SZX arrival trajectory clusters; each color represents one cluster. . . 196
B-10 SZX arrival trajectories labeled as noise. . . 196
B-11 Centroids of SZX arrival trajectory clusters. . . 196
B-12 Distribution of SZX arrival trajectories by cluster; grey bar represents the percentage of noise. . . 196
B-13 SZX departure trajectory clusters; each color represents one cluster. . . 197
B-14 SZX departure trajectories labeled as noise. . . 197
B-15 Centroids of SZX departure trajectory clusters. . . 197
B-16 Distribution of SZX departure trajectories by cluster; grey bar represents the percentage of noise. . . 197
B-17 MFM arrival trajectory clusters; each color represents one cluster. . . 198
B-18 MFM arrival trajectories labeled as noise. . . 198
B-19 Centroids of MFM arrival trajectory clusters. . . 198
B-20 Distribution of MFM arrival trajectories by cluster; grey bar represents the percentage of noise. . . 198
B-22 MFM departure trajectories labeled as noise. . . 199
B-23 Centroids of MFM departure trajectory clusters. . . 199
B-24 Distribution of MFM departure trajectories by cluster; grey bar represents the percentage of noise. . . 199
C-1 GRU arrival trajectory clusters; each color represents one cluster. . . 202
C-2 GRU arrival trajectories labeled as noise. . . 202
C-3 Centroids of GRU arrival trajectory clusters. . . 202
C-4 Distribution of GRU arrival trajectories by cluster; grey bar represents the percentage of noise. . . 202
C-5 GRU departure trajectory clusters; each color represents one cluster. . . 203
C-6 GRU departure trajectories labeled as noise. . . 203
C-7 Centroids of GRU departure trajectory clusters. . . 203
C-8 Distribution of GRU departure trajectories by cluster; grey bar represents the percentage of noise. . . 203
C-9 CGH arrival trajectory clusters; each color represents one cluster. . . 204
C-10 CGH arrival trajectories labeled as noise. . . 204
C-11 Centroids of CGH arrival trajectory clusters. . . 204
C-12 Distribution of CGH arrival trajectories by cluster; grey bar represents the percentage of noise. . . 204
C-13 CGH departure trajectory clusters; each color represents one cluster. . . 205
C-14 CGH departure trajectories labeled as noise. . . 205
C-15 Centroids of CGH departure trajectory clusters. . . 205
C-16 Distribution of CGH departure trajectories by cluster; grey bar represents the percentage of noise. . . 205
C-17 VCP arrival trajectory clusters; each color represents one cluster. . . 206
C-18 VCP arrival trajectories labeled as noise. . . 206
C-19 Centroids of VCP arrival trajectory clusters. . . 206
C-20 Distribution of VCP arrival trajectories by cluster; grey bar represents the percentage of noise. . . 206
C-21 VCP departure trajectory clusters; each color represents one cluster. . . 207 C-22 VCP departure trajectories labeled as noise. . . 207 C-23 Centroids of VCP departure trajectory clusters. . . 207 C-24 Distribution of VCP departure trajectories by cluster; grey bar represents the
List of Tables
1.1 Major airport/airspace dependency issues that affect metroplex operations [3]. 38
2.1 Non-conforming trajectory detection performance. . . 77
3.1 Number of trajectory tube intersections identified by pair of metroplex airports. 95 3.2 Results of the metroplex hourly flow vector clustering analysis. . . 101
3.3 Description of the New York MFPs. . . 103
3.4 Airport runway configurations associated with each New York MFP. . . 104
3.5 Description of the Hong Kong MFPs. . . 108
3.6 Airport runway configurations associated with each Hong Kong MFP. . . 109
3.7 Description of the Sao Paulo MFPs. . . 111
3.8 Airport runway configurations associated with each Sao Paulo MFP. . . 111
3.9 Number of flow crossings by MFP. . . 114
3.10 Metroplex arrival rates under persistent demand. . . 126
3.11 Comparison between empirical and baseline metroplex arrival rates for each New York MFP. . . 127
3.12 Daily capacity and structural path stretch variation. . . 128
3.13 NRMSE for the MFP throughput-demand curves. . . 129
4.1 Classification accuracy of NN model for various network architectures based on 5-fold cross validation performance. . . 141
4.2 Description of GDP events at JFK used as test cases. . . 171
B.1 DBSCAN parameter settings used for trajectory clustering. . . 193 C.1 DBSCAN parameter settings used for trajectory clustering. . . 201
List of Acronyms and Abbreviations
AAR Airport Acceptance Rate
ADS-B Automatic Dependent Surveillance - Broadcast
ANSP Air Navigation Service Provider
ARSI Arrival Route Status and Impact
ARTCC Air Route Traffic Control Center
ASPM Aviation System Performance Metrics
ATC Air Traffic Control
ATCSCC Air Traffic Control System Command Center
ATCT Air Traffic Control Tower
ATFM Air Traffic Flow Management
ATM Air Traffic Management
CDM Collaborative Decision-Making
CGH Sao Paulo/Congonhas Airport
CNS Communication, Navigation and Surveillance
CTOP Collaborative Trajectory Options Program
EDCT Expected Departure Clearance Time
EWR Newark International Airport
FAA Federal Aviation Administration
FCA Flow Constrained Area
GDP Ground Delay Program
GHP Ground Holding Problem
GRU Sao Paulo/Guarulhos International Airport
HKG Hong Kong International Airport
IATA International Air Transport Association
ICAO International Civil Aviation Organization
ILS Instrument Landing System
IMC Instrument Meteorological Conditions
JFK John F. Kennedy International Airport
LGA LaGuardia Airport
METAR Meteorological Terminal Aviation Routine Weather Report
MFM Macau International Airport
NAS National Airspace System
NASA National Aeronautics and Space Administration
NextGen Next Generation Air Transportation System
NEXTOR National Center of Excellence for Aviation Operations Research
RAPT Route Availability Planning Tool
RBS Ration-By-Schedule
SESAR Single European Sky ATM Research
STAR Standard Terminal Arrival Route
SZX Shenzhen Bao’an International Airport
TAF Terminal Aerodrome Forecast
TBO Trajectory-Based Operations
TFMS Traffic Flow Management System
TMI Traffic Management Initiative
TRACON Terminal Radar Approach Control
VCP Viracopos International Airport
Chapter 1
Introduction
1.1 Motivation
Air transportation is critical to promoting a nation’s economic growth and social develop-ment. As the fastest means for worldwide transportation, it is essential for global business and tourism. In 2017, aviation transported 4.1 billion passengers and 59.9 million tonnes of freight [4]. According to the latest study on the economic and social benefits of air transport, the industry supported 62.7 million jobs worldwide and its global economic impact (direct, indirect, induced and enabling) was estimated at US$ 2.7 trillion, equivalent to 3.5% of the world’s Gross Domestic Product, in 2014 [5]. The importance of the industry is expected to continue to increase over the next decades. The International Air Transport Association (IATA) expects the air traffic demand to double by 2035, reaching 7.2 billion passengers globally [6]. In the U.S., the Federal Aviation Administration (FAA) forecasts an average increase in system enplanements of 2.2% per year over the next 20 years [7].
Enabling air transportation over the years, Air Traffic Management (ATM) is the system of systems responsible for promoting a safe and orderly flow of aircraft through the airspace. Though serving the aviation needs since its beginning, this system has reached its operational limits. In 1983, the International Civil Aviation Organization (ICAO) first recognized the need for new air navigation systems and procedures in order to facilitate the civil aviation growth at a global scale [8]. Yet, present ATM systems are still limited by technologies and operational procedures from the past century, which constrain capacity and lead to
ineffi-ciencies such as unnecessary delays and emissions. Demand-capacity mismatches currently impose significant delays for passengers and costs for the airline industry and the economy as a whole. In the U.S., for example, 16.5% of all domestic flights were delayed by more than 15 minutes in 2016 [9]. In Europe, the percentage of delayed flights was 18.2% in 2015 [10]. According to a study developed by the FAA National Center of Excellence for Aviation Operations Research (NEXTOR), the annual cost of flight delays to the U.S. economy was estimated to be US$ 31.2 billion in 2007, including direct costs for airlines and passengers and indirect costs associated with demand and Gross Domestic Product losses [11].
In order to enable the foreseen air traffic growth sustainably and address future air trans-portation challenges, a global effort is currently underway towards the modernization and harmonization of ATM systems. In the U.S., the Next Generation Air Transportation System (NextGen) initiatives aim to achieve an in-depth transformation of the National Airspace System (NAS) that will increase safety and efficiency and reduce the environmental impacts of aviation [12]. Likewise, the Single European Sky ATM Research (SESAR) initiative co-ordinates and concentrates all EU research and development activities to define, develop and deploy the new generation of ATM system in Europe [13]. Similar programs have been created in Japan (CARATS [14]), Brazil (SIRIUS [15]), China (CAAMS [16]) etc.
Overall, these initiatives envision the deployment of new technologies for Communica-tion, Navigation and Surveillance (CNS) and ATM automation as well as new operational procedures that best leverage the on-going technological advancements. For example, digital data-link systems are expected to replace voice-based systems for faster and more accu-rate air traffic controller-pilot communication. Satellite-based navigation will enable more direct and efficient routes and provide more stringent navigational accuracy than ground-based navaids. Satellite-ground-based surveillance will complement radar-ground-based systems, allowing for greater coverage and increased precision in the monitoring and control of aircraft. New decision support systems will increase automation and enhance strategic and tactical traffic flow and airspace management. Taking advantage of all these capabilities, Trajectory-Based Operations (TBO) is envisioned to be the new concept of operations for future ATM, bringing together modern procedures to allow aircraft to follow precise 4D trajectories pre-negotiated between flight operators and Air Navigation Service Providers (ANSPs) towards increasing
the efficiency, predictability and flexibility in trajectory planning and execution [8, 17, 18]. Besides the implementation of new technologies and operational procedures, efficient use and management of air transport system data and information is key to achieve the desired transformation of ATM systems. Every day, large amounts of data are generated as air traffic operations occur, both at the planning and execution stages. Data types include environmen-tal conditions (e.g., weather reports), system state (e.g., air traffic control facility reports), flight demand (e.g., airline schedules, flight plans, surveillance tracks), etc. Furthermore, they are expected to become increasingly available and accessible as new technologies are deployed. For instance, flight trajectory data has become increasingly accessible with the ad-vent of new surveillance technologies. Historically, there has been limited sharing of this type of data by ANSPs for national security reasons. With Automatic Dependent Surveillance-Broadcast (ADS-B), open-source flight tracking data has become publicly available, making it possible for the first time to analyze aircraft movement at a global scale. The development of innovative ways to leverage the system raw data can play a key role in the ATM transfor-mation by providing means for better assessing and understanding operational performance, increasing the system predictive power and creating new decision support tools to assist the planning at strategic and tactical levels. It can help moving from a system that often works reactively and still much relies on experience, intuition and "golden rules" towards a system that is more intelligent, proactive and adaptive.
This research seeks to contribute to this goal by exploring the development of high-fidelity air traffic flow models from large-scale aircraft tracking data and analyzing their potential towards assisting ATM decision-making. Air traffic flows can be far more diverse and complex than what published routes and procedures alone suggest. For example, Figure 1-1 shows the trajectories for arrival flights into John F. Kennedy International airport (JFK) during two different time periods of one same day overlaid with the published Standard Terminal Arrival Routes (STAR). It is observed that the spatial distribution of the traffic does not fully match the STARs and it can vary reasonably over time. Knowledge about these spatiotemporal characteristics of the traffic is key for accomplishing ATM by informing various airspace management and traffic flow management related decisions, as exemplified below:
airspace for better design of sectors and routes.
• System capacity estimation: It supports the estimation of how much traffic can be accommodated in airspace resources; airspace capacity is a function of air traffic control complexity, which is a function of the flow structure and associated difficulty of control. • Demand estimation: It supports estimating the demand on airspace fixes, sectors or
larger airspace volumes.
• Design of traffic flow management strategies: It supports the design of flow manage-ment strategies to balance demand with capacity and reduce delays; critical regions of the airspace (more prone to see demand-capacity imbalances) can be more easily identified and become a target for flow adjustment programs.
• Tactical airspace management: It supports the allocation of staff and/or the tactical reconfiguration of the airspace to balance workload, increase capacity and throughput; periods of higher air traffic control complexity, with complex flow structure, can be more easily anticipated, indicating that changes in staffing or in the airspace structure may be necessary to have an expeditious flow.
Figure 1-1: Trajectories of arrival flights into JFK during two different time periods on June 23, 2015 overlaid with the Standard Terminal Arrival Routes.
Currently, this knowledge about the traffic flow behavior is primarily obtained through human experience. Based on the continuous observation of flight trajectories through air
traffic situation displays from surveillance systems, air traffic controllers and managers are able to form mental models and create abstractions of the traffic flow in a region. Conse-quently, they create an intuition about the location of major flows and about the time they tend to occur, which inform their decisions. This reliance on human experience/intuition sometimes yields inefficiencies as decisions tend to be taken based on local aspects rather than on a systems perspective. Moreover, it limits the capabilities of automated decision sup-port systems for air traffic management and hinders the implementation of more advanced operational concepts that require high-fidelity flow information.
Hence, there is a need to develop automated tools that can best characterize and predict the behavior of the traffic and be integrated into decision-support tools for ATM. It is worth mentioning that this need is even more patent in the envisioned TBO environment, where the less structured airspace resulting from more flexible trajectory planning will require more efforts to understand traffic flows.
1.2 Thesis Objectives
This thesis has two main objectives:
1. Investigate how operational data in the ATM system can be mined to automatically identify and predict air traffic flows;
2. Analyze the potential contribution of such knowledge towards obtaining a better un-derstanding of the traffic flow behavior and performance and supporting system-level decision-making in ATM.
1.3 Methodological Approach
This thesis leverages data analytics to achieve the objectives aforementioned. Hu et al. [19] define data analytics as the process of using algorithms to uncover information concealed in data, such as hidden patterns or unknown correlations, with a variety of purposes, such as to give advice, to diagnose and infer reasons for fault or to predict what will occur in
the future. Generally, data analytics can be classified in three levels according to the ways by which it can affect decision-making: descriptive, predictive and prescriptive [20]. These paths are illustrated in Figure 1-2. The first path is the most straightforward; descriptive analytics exploits historical data to diagnose, identify relevant explanatory factors for an event outcome and create insights for guiding future decisions. The second path leverages data to predict the most likely outcome of an event, which can be the state of a variable affecting the decision or even the decision itself. Finally, the third path leverages insights from data to develop realistic models that can prescribe actions to control the outcome of the decision for a given objective. Ultimately, data analytics can be described as the science of using data to build models, improve decisions, and add value to organizations and individuals [21].
Figure 1-2: General ways by which data analytics affects decision-making.
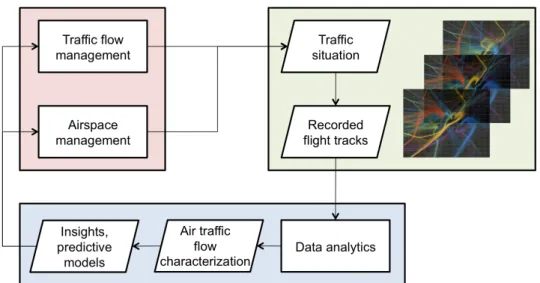
In this thesis, a flight trajectory data analytics framework is developed based on the application of machine learning methods to exploit flight tracking data and discover spatial and temporal patterns in the movement of aircraft through the airspace in order to pro-vide a high-fidelity characterization of air traffic flows. This characterization propro-vides the foundation for obtaining new insights about the traffic behavior and performance as well as for the development of predictive models to support airspace management and traffic flow
management decisions. The approach is illustrated in Figure 1-3.
Figure 1-3: Ways by which the flight trajectory data analytics framework can impact ATM. In order to demonstrate this data analytics framework and discuss its potential impacts on ATM decision-making, this thesis focus on terminal area operations, particularly of multi-airport (metroplex) systems. Large metropolitan regions are typically served by two or more significant airports, which are often closely located and share most of their surrounding airspace (terminal area). As a result of the high traffic density and the interdependent uti-lization of both airport and airspace resources, the metroplex terminal airspace tends to feature complex traffic dynamics. Besides, the terminal area phase has significant contri-bution to both individual flight and system level efficiency. The high density of aircraft converging in the terminal area along with the more constrained airspace structure often result in sub-optimal flight paths. These inefficiencies are even more pronounced in multi-airport systems because of the even higher traffic volume and the existence of inter-multi-airport flow interactions. Therefore, better understanding the dynamics and the performance of the traffic flows at the terminal area scale, especially for super dense and complex terminal airspace that characterize metroplex systems, has one of the greatest potential towards sup-porting airspace and traffic flow management decisions at the systems and enhancing system level ATM performance.
1.4 Background and Related Literature
1.4.1 An Overview of Air Traffic Management
The primary function of Air Traffic Management (ATM) is to ensure a safe and orderly flow of aircraft through the airspace. ATM can be generally subdivided in three distinct functions [22]:
• Air Traffic Control; • Airspace Management;
• Air Traffic Flow Management.
The main purpose of Air Traffic Control (ATC) is to guarantee safe separation between aircraft and between aircraft and obstacles and avoid collisions. ATC is also responsible for providing flight information services to aircraft, such as weather reports and updates on facility conditions, as well as alerting about aircraft in need of search and rescue. In order to enable the ATC activity, some elementary systems are required: communication, navigation, surveillance and flight and weather information. A detailed description of these systems can be found in [23].
Airspace Management concerns the allocation of the airspace to its various users and its design to provide ATC services. In general, the airspace is subdivided into regions that are assigned to different control facilities. The standard airspace and control structure [24] is composed of Control Tower, which is responsible for the traffic in the nearby airspace around airports and on their surface, Approach Control (called Terminal Radar Approach Control - TRACON - in the U.S.), which controls the terminal airspace (or terminal area) containing the arrival and departure procedures of one or more airports, and Area Control Center (called Air Route Traffic Control Center - ARTCC - in the U.S.), which is responsible for volumes of the airspace containing airways. These different regions of the airspace are further subdivided into sectors, which are individually controlled by an air traffic controller. In the U.S., the NAS contains 22 ARTCCs that are subordinated to a central control unit called Air Traffic Control System Command Center (ATCSCC). This airspace structure is
quite rigid and only shows some level of flexibility in terms of internal sectorization as sectors can be merged or split depending on traffic conditions.
Finally, Air Traffic Flow Management (ATFM) has the goal of matching demand with available capacity by adjusting the flows on a national or regional basis when imbalances are predicted to occur because of weather conditions, traffic volume or special events. In the NAS, ATFM is accomplished through different types of Traffic Management Initiatives (TMIs) issued at strategic (i.e., planning horizons of 2 to 8 hours) and tactical (i.e., real time to planning horizons of 2 hours) time frames. Common strategic TMIs include delaying aircraft on the ground at the origin airport via a Ground Delay Program (GDP) when capacity at the destination airport is reduced or via an Airspace Flow Program when the aircraft is planned to traverse a Flow Constrained Area (FCA), i.e., an airspace region that is impacted (primarily because of weather). Still at strategic time frame, flights can also be rerouted pre-departure to avoid congested or weather impacted areas. The National Playbook contains a set of alternative routes that have been pre-validated and coordinated with ARTCCs and that can be used in support of strategic rerouting. While airborne, flights are subject to tactical TMIs implemented in a more reactive way. For example, an aircraft may be tactically rerouted around weather or may be slowed down with a Miles-in-Trail restriction, a strategy commonly used to control arrival rates into an area through additional spacing at airspace fixes. Recently, efforts have been made to develop new ATFM strategies that integrate existing ones and provide a more flexible and efficient solution for airspace users. The Collaborative Trajectory Options Program (CTOP) is a new strategic TMI developed by the FAA that simultaneously assigns ground delays and/or reroutes around one or more FCAs after explicitly taking into account the priorities of flight operators under a Collaborative Decision-Making (CDM) approach [25]. The National Aeronautics and Space Administration (NASA) is also currently working towards the development of the Integrated Demand Management concept, which attempts to coordinate strategic and tactical flow scheduling by using a CTOP TMI to pre-condition the flows into the Time-Based Flow Management system so that an arrival schedule with lower delays can be built [26].
The planning and execution of the three functions described above is a complex task accomplished by the ATM system. The difficulty of ATM can be generally attributed to
three major factors:
High volume and heterogenous demand
In the U.S., an average of more than 42,000 flights operate per day, and more than 5,000 aircraft can be present in the sky at any given time [27]. Large hub airports serving dense metropolitan regions concentrate a significant part of the traffic; in 2016, 30 airports handled more than 70% of the revenue passenger enplanements [28]. Besides, the system has to deal with a variety of aircraft and mission types, including large commercial jets, small general aviation aircraft, rotorcraft, etc. The rise of unmanned and urban air mobility markets is expected to further increase the volume and heterogeneity of demand, accentuating the pressure over the system.
Dynamic system capacity
The difficulty of ATM can also be attributed to the dynamic behavior of system capacity. Knowledge of capacity is key for allocating demand to ATM resources efficiently, but the large number of capacity-determining factors and their dynamics makes it difficult to estimate flow rates precisely, especially for long time horizons. Figure 1-4 provides a decomposition of the factors that influence airport/airspace capacity and their interrelations. The uncertainty in system capacity can be largely attributed to the dynamic weather behavior. It can be observed that weather conditions plays a major role in determining achievable capacity, both indirectly by influencing the selection of an ATM configuration, and directly by impacting the throughput performance of a given ATM configuration.
Fragmented, multi-stakeholder and human-based decision-making
Additional complexity arises because ATM decisions are taken by multiple human decision-makers in multiple sub-systems dealing with different phases of a flight at different time horizons, requiring lots of coordination. Moreover, they have to accommodate interests from multiple stakeholders, including air traffic service providers, flight operators and passengers.
Figure 1-4: Airport/airspace capacity influencing factors.
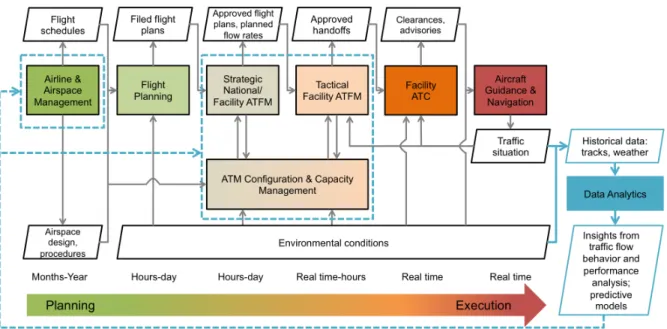
The ATM functional structure is summarized in the simplified diagram shown in Figure 1-5. The processes and information flows that occur throughout the life-cycle of a flight are indicated, as well as the time horizons associated with each particular process. At the long-term planning horizon ranging from months to years in advance, airline scheduling processes generates the flight schedules to meet the airline’s business goals, while strategic Airspace Management is accomplished by the ANSP to design the airspace and the opera-tional procedures. Closer to the flight departure date, which can range from hours to days in advance, airlines elaborate their flight plans describing in detail the proposed aircraft flight to realize the schedule. Flight plans are submitted to the ANSP central ATFM unit, which will approve or require adjustments, for instance, to mitigate an expected demand-capacity imbalance at a particular resource. Expected system capacity is a function of expected ATM configurations and forecast weather conditions at that time. At the tactical time horizon ranging from real time to hours in advance, tactical ATFM is accomplished at the facility level to adjust the flow rates in response to dynamic changes in weather conditions, ATM configuration and capacity. Finally, ATC delivers the final clearances and advisories to
as-sure the safe separations, while aircraft guidance systems enable the execution of the agreed trajectory plan.
Figure 1-5: ATM functional structure.
1.4.2 Challenges in Metroplex Air Traffic Management
A multi-airport system (also referred to as metroplex) can be defined as a set of two or more significant airports that serve commercial traffic in a metropolitan region, without regard to ownership or political control of individual airports [29]. Multi-airport systems have emerged worldwide as a response to congestion problems, allowing the air transportation system to scale and meet the increasing demand [30]. Bonnefoy (2008) identified two fundamental mechanisms governing the emergence of a multi-airport system historically: construction of a new airport in a region served by a single airport system, with partial or total transfer of traffic; or use of existing airports that were previously sub-utilized in the metropolitan region [30]. The second mechanism has been especially observed after the emergence of low-cost carriers. Through this scaling process, multi-airport systems have accommodated a significant portion of the global traffic and have become key nodes of the air transportation
system. Based on data of 2006, Bonnefoy (2008) identified the existence of 59 multi-airport systems worldwide, which handled 50% of the global passenger traffic.
With the emergence of multi-airport systems, the ATM system has to deal with increas-ing levels of complexity in the management of the traffic surroundincreas-ing these systems. The sharing of the terminal airspace results in operational interdependencies and interactions be-tween dense arrival and departure routes from the multiple airports in the same geographical area, creating a complex environment for traffic management. An extensive study developed by Ren et al. [31] and Clarke et al. [3] identified twelve major general metroplex depen-dency issues that impact their operations based on site visits, domain expert evaluation and qualitative analysis of four major U.S. multi-airport systems (Atlanta, Los Angeles, New York and Miami). These issues are listed in Table 1.1. For example, the use of arrival and departure routes by an airport tends to be dictated not only by its individual runway configuration, but also by the neighboring airport configuration. These interdependencies increase the impact and the workload associated with runway configuration changes (issues 3, 5). Besides, the sharing of airspace resources (arrival and departure fixes, path segments) creates flow interactions that affect the overall performance of the metroplex (issues 1, 2, 6, 7, 8, 11).
As mentioned previously, the difficulty of ATM can be generally attributed to three major factors: high volume; dynamic system capacity; and fragmented decision-making. At multi-airport systems, all of these factors are intensively present: metroplex airspace are the densest of all; metroplex interdependencies result in high variability in ATM configuration and performance; metroplex decisions have to be coordinated between facilities managing the individual airports and airspace. As a result, these systems are characterized by a complex operating environment for ATM. For instance, at the same time they are more reliant on ATFM to adjust demand with the more dynamic system capacity, their characteristics also make the planning of ATFM very challenging. Because there is higher uncertainty in the ATM configuration and its performance, estimating future capacity precisely is more difficult and the allocation of airport and airspace resources under uncertainty becomes more subject to inefficiencies.
Table 1.1: Major airport/airspace dependency issues that affect metroplex operations [3].
Metroplex issue Definition Impact
1 Multi-airport de-parture merge over common departure fix
Occurs when flights from at least two separate air-ports are procedurally merged over at least one com-mon departure fix.
Very high 2 Major volume-based
traffic flow
man-agement (ATFM)
restrictions
Occurs when a significant level of ATFM restric-tions due to demand-to-capacity overloads exist at airspace fixes or at airports.
Very high
3 Proximate-airport
con-figuration conflicts Occurs when an airport configuration change of oneof at least two proximate airports puts restrictions on flights flying to/from other proximate airport(s). This involves flows from one impacting another air-port’s flows, causing significant rerouting or delays.
High
4 Slow inter-airport
ground connectivity Occurs when inadequate surface transportation ofpassengers between airports cause significant delays and consequently limits the efficient use of airports by passengers.
High
5 Inefficient/high work-load airport configura-tion changes
Occurs when any major airport configuration change requires significant workload due to reasons, such as coordination of a large number of personnel, FAA facilities, and airports or sector reconfigurations.
High
6 Inefficient
multi-airport departure sequencing
Occurs when departure sequencing of flights from multiple airports requires conservative flight restric-tions.
High 7 Major secondary
air-port flow constraints Occurs when conflicts between a primary airport anda secondary airport lead to constraints on secondary airport flows. Typically, secondary airport traffic will be held below primary airport traffic flows or will be routed around the primary airport traffic patterns resulting in longer flight paths.
High
8 Inefficient flushing of
airport flows Occurs when ATC uses a flushing technique that con-strains other airport traffic flows in order to expedite one airport’s arrival or departure flights as a way to solve a particular congestion problem (e.g., airport arrival gridlock).
Medium
9 External special use airspace (SUA) causes flow dependencies
Occurs when SUA external to the TRACON con-stricts TRACON flows into narrow corridors and forces inter-airport traffic flow dependencies.
Medium 10 Terrain causes flow
de-pendencies Occurs when terrain internal to the TRACON con-stricts TRACON flows into narrow corridors and forces inter-airport traffic flow dependencies.
Medium 11 Severe limitations on
instrument procedures due to proximate air-port
Occurs when the use of instrument procedures is severely constrained due to the existence of a proxi-mate airport.
Low
12 Insufficient regional
airport capacity Occurs when there is generally not enough TRACONrunway capacity to efficiently serve the air traffic de-mand.
airspace are recognized to be key factors affecting the coupling of operations, the traffic dynamics and the overall performance of a metroplex. Yet, studies that investigate the in-terplay between these factors and their impacts on the traffic dynamics and performance are limited. Visual inspection of flight trajectory data has been used to qualitatively eval-uate airspace design and identify potentially constraining flow interactions [31]. Delay and fuel burn impacts of decoupled metroplex design and new traffic scheduling strategies have been assessed through simulation [3]. Donaldson and Hansman presented an empirical study aimed at quantifying capacity impacts associated with metroplex interactions [32]. Through-put performance at the airport level and at the system level for particular combinations of runway configurations in the New York metroplex were evaluated using operational data. Capacity discrepancies as great as 60 operations per hour were observed, emphasizing that terminal airspace flow interactions tend to be an important constraining factor driving the capacity of metroplex airports. In this thesis, we demonstrate the potential of the flight trajectory data analytics framework to provide a deeper understanding of the metroplex traffic behavior and performance and discuss how this understanding can be useful for ATM decision support at these systems.
1.4.3 Optimization Models for Air Traffic Management
There is a vast stream of literature dedicated to developing analytical models for optimization of ATM decisions towards assisting human decision makers. The area of ATFM has received particular attention given the complex decision-making nature of this ATM function and its impacts on system-level efficiency. The problem of adjusting air traffic flows in real time in order to balance demand with capacity was first modeled by Odoni [33] using optimization techniques. Since then, several models have been conceptualized for the flow management problem at different scales and considering various types of capacitated resources and control mechanisms.
At the national and strategic level, ATFM is typically concerned about regulating flights destined to a capacity-constrained airport or planned to traverse a capacity-constrained airspace region. The problem of regulation of traffic towards a capacity-constrained airport is the most discussed in the literature and it is commonly referred to as the Ground Holding
Problem (GHP). When demand exceeds capacity at an airport, the arrival traffic will be subject to delays. There are two primary mechanisms by which flight delays can be incurred: delays can be absorbed in the air, for example, when the aircraft is slowed down or put on a holding pattern; or delays can be absorbed on the ground if the departure time is postponed. Because airborne delays are typically more expensive than ground delays and there is an upper bound on the amount of time that a flight can be held in the air, ground delays are generally preferred from both an operating cost and a safety perspective. Nevertheless, as ground delays are strategic in nature and capacity cannot be predicted exactly a few hours in advance, a trade-off between ground and airborne delays will exist when the uncertain nature of capacity is accounted for. Several mathematical programming formulations for the GHP have been developed in order to determine the optimal allocation of ground delays that minimizes the expected overall delay costs. The first model formulations for the GHP were deterministic and static, i.e., capacity was assumed to be known with certainty and decisions were made once at the beginning of the planning horizon [34]. Stochastic and static models were proposed by Richetta and Odoni [35] and by Ball et al. [36] in order to account for uncertainty in the airport capacity profiles. In order to also incorporate the ability to revise decisions as updated capacity information becomes available during the planning horizon, dynamic models were proposed by Richetta and Odoni [37] and Mukherjee and Hansen [38]. Most of the GHP models consider that the planning horizon for capacity allocation is known a priori and determined by the ANSP in a centralized manner. Liu and Hansen [39] took an alternative approach and proposed stochastic GHP models based on deterministic queueing theory in order to optimize the duration of the ATFM plan. Instead of incorporat-ing uncertainty in the arrival rates, they assumed the existence of deterministically known normal and low capacity levels and introduced uncertainty on the time when the airport capacity moves from the low level to the normal level. In their models, the decision on the planning horizon was made to minimize the expected delay costs, which included unpre-dictability premiums associated with revisions due to early or late capacity recovery. A body of research has also been dedicated to developing decentralized (or "airline-driven") GHP models that incorporate individual flight operator’s preferences with respect to the design of the ATFM plan using voting mechanisms [40, 41, 42, 43]. The underlying motivation
for these studies is the fact that airlines have different recovery capabilities due to their operational characteristics and, therefore, they can have different risk tolerances regarding the design of the ATFM plan. For example, an airline that operates under higher flight frequency, lower load factors and more homogeneous fleet mix may have a higher recovery potential from disruption since it can more easily perform aircraft swaps or re-accommodate passengers. Such an airline would tend to be less risk tolerant and prefer a more predictable ATFM plan with longer duration in order to take advantage of its recovery capability [43]. By contrast, airlines with lower recovery potential might be willing to take more risks in or-der to take advantage of any extra capacity that may be realized (such as an early capacity recovery). These airlines would tend to prefer more aggressive ATFM plans with shorter duration.
The Air Traffic Flow Management Problem (TFMP) extended the GHP by considering that not only the airport but also the airspace can be capacity constrained and by introducing additional control mechanisms such as airborne delays, rerouting and cancellations. Two distinct modeling approaches have been pursued for the TFMP: Lagrangian approaches are aircraft-based and seeks to control departure times and traversing times throughout the airspace from origin to destination for each individual flight [44, 45, 46, 47, 48, 49]; whereas Eulerian approaches are flow-based and seeks to control aggregate flow rates at nodes and links of the air traffic route network [50, 51, 52, 53, 54].
At the regional and tactical level, ATFM also plays an important role in the regulation of the traffic at individual airports or terminal areas. Many analytical models have been derived for more efficient coordination of airport arrival and departure flows, with the objectives of minimizing delays and maximizing resource throughput while maintaining fairness among airspace users. Runway sequencing and scheduling models have been developed to determine the optimal sequence and schedule of runway usage by arrival and departure aircraft based on the safety requirements between specific aircraft types and their wake turbulence categories [55, 56, 57, 58]. Runway configuration selection models have been developed to optimally schedule airport runway configuration changes based on expected demand and meteorological conditions in order to best balance capacity with the demand of arrivals and departures [59]. Taxiway scheduling models have been created to schedule taxi operations and determine
the optimal routing in the taxiway system in order to prevent "stop-and-go" situations and minimize taxi times [60]. Finally, departure metering models have been developed to manage the demand of departures by holding aircraft at the gate, with engines off, until the right time for its release (i.e., the optimal time to leave the gate and reach the runway at its assigned slot for takeoff) towards minimizing taxi and runway delays and mitigating airport surface congestion [61, 62].
Besides traffic flow management, there has also been substantial research focused on developing analytical models for airspace management decision support. Several approaches have been derived for the problem of determining an efficient airspace sectorization given a particular air traffic situation. Some of them leverage the existing airspace structure to determine sector merging or splitting as a function of demand [63, 64, 65], whereas others focus on redesigning airspace boundaries from scratch [66, 67, 68, 69, 70, 71, 72]. In order to do so, a variety of methods have been used such as mathematical programming [63, 66, 67], computational geometry [68, 72], heuristics [69] and graph theory [71]. Common design objectives for an efficient sectorization were the balancing of monitoring workload among sectors (i.e., the workload associated with monitoring and conflict-avoidance tasks) and the minimization of coordination workload (i.e., the workload associated with hand-offs between sectors). Other design goals included the maximization of sector dwell times and the maximization of sector capacity.
Research in ATM has produced useful models to optimize the traffic flows and airspace configurations, showing efficient computational times on practical size instances and signif-icant potential towards improving the efficiency of air traffic operations. Yet, it is still ob-served a large gap between theory and practical implementation. One reason for the existing gap between theory and practice is the fact that many analytical models make assump-tions that do not hold under the high levels of dynamism and uncertainty that characterize the ATM operating environment, or require information that is not currently automatically available in the ATM system. For instance, models for airspace configuration management typically require detailed traffic information (e.g., dominant flows, critical points) that is not automatically generated by the current systems that support ATM. Models for large-scale air traffic flow optimization make simplistic assumptions about the air traffic route network
that typically do not match the actual spatial patterns of air traffic flows. Besides, they often assume airport and airspace capacities are deterministic and can be known in advance with certainty. Even more realistic models that account for the uncertain behavior of system capacity face barriers towards implementation. For example, most stochastic GHP models assume the uncertain airport capacity profiles can be represented in the form of scenario trees, in which capacity changes between few discrete states assumed to be known to the decision-maker [37, 38]. Yet, generating such scenarios in practice is not straightforward. Besides, actual capacity may be better represented as a continuous variable rather than with few discrete states. Other models assume that nominal and off-nominal capacity val-ues can be treated deterministically and the time of capacity recovery can be modeled with probability distributions [39, 43], but they lack of empirical validation.
1.4.4 Data Analytics for Air Traffic Management
Given the increasing amounts of operational data generated and recorded every day by the ATM system and the advancements in computational science, a field of research has emerged to investigate how data analytics can be leveraged to create useful information from the system raw data for advanced ATM. A broad range of studies have exploited the various types of data available in the ATM system for multiple different tasks, with the overarching goals of better measuring and predicting ATM performance and facilitating decision-support tool development. For example, a non-exhaustive list of topics addressed by these studies is presented below.
Data-driven modeling of air traffic flows
Work has been done to model air traffic flows from flight tracking data for performance assessment and monitoring, airspace design and traffic flow management purposes. For example, Gariel et al. [73] developed a framework for terminal airspace monitoring through the use of clustering techniques to learn nominal spatial trajectory patterns and to assess the conformance of flight trajectories. Sabhnani et al. [74] also applied clustering methods on flight trajectory data in order to identify en route sectors with highly structured traffic
patterns for airspace redesign purposes.
Data-driven modeling of airport and airspace capacity
Another stream of literature has focused on modeling airport and airspace capacity from weather forecast data for traffic flow management applications. For example, Provan et al. [75] used supervised learning to translate raw terminal aerodrome forecasts into probabilistic airport capacity predictions for strategic planning horizons. Pfeil and Balakrishnan [76] also applied machine learning methods on raw convective weather forecasts in order to generate probabilistic predictions of terminal area route blockage because of convective weather. Data-driven modeling of air traffic delays
Work has also been done to model the dynamics of delay from on-time performance records for prediction and control of air traffic delays. For example, Rebollo and Balakrishnan [77] applied clustering methods to identify characteristic delay states for the NAS and used su-pervised learning to develop prediction models that leverages this network state information to forecast departure delays for specific origin-destination pairs up to 24 h in the future. Data-driven modeling of aircraft performance
Another group of studies has been dedicated to model aircraft performance from flight recorder data for performance monitoring applications. For example, Li et al. [78] applied clustering techniques on flight recorder data to model nominal aircraft behavior and identify anomalous flights towards improved safety monitoring. Chati [79] developed data-driven models of aircraft engine performance also using operational data from flight recorders in order to predict a flight’s fuel burn directly from its trajectory for enhanced fuel efficiency assessment and monitoring.
A more detailed review of the literature on the topics of data-driven air traffic flow modeling and airport capacity modeling, which are relevant in the context of this thesis, are provided in the next two sections.
1.4.5 Data-Driven Modeling of Air Traffic Flows
The characterization of air traffic flows from aircraft tracking data can be framed as a problem of identification of spatial and temporal trends in the collective movement of aircraft through the airspace. Such problem appears in a variety of other domains in which the movement of objects tends to exhibit correlations in both spatial and temporal dimensions (e.g., vehicles in a road network). Therefore, this section will provide a broader review of works (not restricted to the air traffic domain) that aimed to investigate spatial and temporal patterns in the collective behavior of moving targets. Before doing so, we will first make important distinctions about types of spatial and temporal trends commonly investigated in trajectory data.
Figure 1-6 exemplifies spatiotemporal patterns in a general trajectory dataset [1]. Using the same terminology provided in [1], the following patterns are highlighted: a flock of three entities with similar spatial pattern over five time-steps; a periodic pattern for an individual entity, i.e., one entity repeats a specific spatial pattern with some periodicity; a meeting place where three entities remain for some period; and a frequent location where a single entity remains for some period. In this figure, the flock pattern provides a good illustration of the spatiotemporal patterns that we seek to mine for flow identification: a group of entities with similar spatial behavior during a period of time. A small distinction is that the entities do not have to be at the same location at exactly the same time. By contrast, they traverse the same sequence of locations within the same time interval. In summary, this thesis considers the following definition of flow:
Definition 1: A flow is a pattern in which entities move along the same paths/routes
in a spatial dimension, and the movements start/end within the same time interval.
Spatiotemporal Pattern Recognition in General Trajectory Data
The problem of discovering spatiotemporal patterns in actual trajectory datasets has re-ceived growing attention in the recent literature across a variety of domains. The increased
Figure 1-6: Example spatiotemporal patterns in trajectory datasets [1].
use of position sensing technologies (e.g., Global Positioning System (GPS)) has produced large amounts of data and created an opportunity to gain insights through trajectory data mining. Examples include tracking datasets of vehicles, people, animals, weather phenom-ena (e.g., hurricanes) etc, which are exploited for a variety of purposes. Analysis of vehicle trajectory patterns is used for traffic management in order to discover hot spots in a trans-portation network and support route planning. Analysis of pedestrian flows can help iden-tifying suspicious behavior in a monitored environment; it can also support urban planning and guide infrastructure investments. Scientists investigate animal movement behavior in order to identify regions frequently visited, investigate social structures within a group of animals and better understand migration patterns. Investigation of hurricane/cyclone move-ment patterns is performed to understand their behavior and increase the predictability of severe-weather events for improved disaster relief management.
Early approaches to spatial pattern data mining involved indexing trajectory databases and performing basic analysis such as nearest neighbor queries [1]. More recently, trajectory clustering has been extensively used for the identification of common trajectory patterns and outlier detection in such datasets. Antonini and Thiran [80] used hierarchical clustering to group trajectories of redundant targets associated with a person for automatic counting of pedestrians in video sequences. Fu et al. [81] also analyzed video surveillance data of