HAL Id: tel-00163394
https://tel.archives-ouvertes.fr/tel-00163394
Submitted on 17 Jul 2007
HAL is a multi-disciplinary open access archive for the deposit and dissemination of sci-entific research documents, whether they are pub-lished or not. The documents may come from teaching and research institutions in France or abroad, or from public or private research centers.
L’archive ouverte pluridisciplinaire HAL, est destinée au dépôt et à la diffusion de documents scientifiques de niveau recherche, publiés ou non, émanant des établissements d’enseignement et de recherche français ou étrangers, des laboratoires publics ou privés.
determinants of the growth of firms
Alex Coad
To cite this version:
Alex Coad. Empirical investigations into the characteristics and determinants of the growth of firms. Economics and Finance. Université Panthéon-Sorbonne - Paris I, 2007. English. �tel-00163394�
UNIVERSITE PARIS 1 PANTHEON-SORBONNE ECOLE DOCTORALE
SANT’ANNA SCHOOL OF ADVANCED STUDIES
DOCTORAT
SCIENCES ECONOMIQUES
COAD, Alexander Jean-Luc
EMPIRICAL INVESTIGATIONS INTO THE CHARACTERISTICS
AND DETERMINANTS OF THE GROWTH OF FIRMS
Thèse dirigée par:
Bernard PAULRE
(Univ. Paris 1 Panthéon-Sorbonne)
Giovanni DOSI
(Sant’Anna School of Advanced Studies, Pisa)
Soutenue à Paris le 23 avril 2007
JURY:
François GARDES
(Univ. Paris 1 Panthéon-Sorbonne)
Giulio BOTTAZZI
(Sant’Anna School of Advanced Studies, Pisa)
EMPIRICAL INVESTIGATIONS INTO THE CHARACTERISTICS
AND DETERMINANTS OF THE GROWTH OF FIRMS
A DISSERTATION
SUBMITTED TO THE S.ANNA SCHOOL OF ADVANCED STUDIES
IN PARTIAL FULFILLMENT OF THE REQUIREMENTS
FOR THE DEGREE OF
DOCTOR OF PHILOSOPHY
IN ECONOMICS AND MANAGEMENT
Alexander Jean-Luc Coad
April 2007
L’université de Paris 1 n’entend donner aucune approbation ni improbation aux opinions émises dans cette thèse. Ces opinions doivent être considérées comme propres à leur auteur.
Acknowledgements
I am especially grateful to my PhD supervisors, Bernard Paulr´e and Giovanni Dosi, who, surprisingly enough, always managed to make time to read my early drafts and discuss them with me despite their busy schedules. Indeed, many of the better ideas to be found in this thesis emerged from discussions with them.
I would also like to thank Peter Allen, Ashish Arora, Eric Bartelsman, Carlo Bianchi, Alan Blinder, Giulio Bottazzi, Thomas Brenner, Alessandra Canepa, Adrian Coad, Larry Chris-tiano, Michael Cohen, Paul David, Hadifa El-Younsi, Giorgio Fagiolo, Koen Frenken, Jean-Pierre Galavielle, Giovanni Gavetti, Paula Giuri, Marco Grazzi, Shane Greenstein, Bronwyn Hall, Nadia Jacoby, Dan Levinthal, Patrick Llerena, Alessandra Luzzi, Steve Machin, Franco Malerba, Luigi Marengo, Orietta Marsili, Peter Maskell, Mariana Mazzucato, Stan Metcalfe, Pierre Mohnen, Max Molinari, Jean-Marie Monnier, Richard Nelson, Luigi Orsenigo, Rekha Rao, Toke Reichstein, Angelo Secchi, Maider Saint-Jean, Martjin Smit, Marina-Eliza Spaliara, Fede Tamagni, Marco Valente, Larry White, Sid Winter, Ulrich Witt and Mahmut Yasar, for stimulating discussions and helpful comments.
More generally, I am also grateful to comments made by participants at presentations at Universit´e Paris 1 Panth´eon-Sorbonne, the Sant’Anna School of Advanced Studies, Pisa, the Evolutionary Economics group at the Max-Planck-Institute (Jena, Germany), the Universit`a di Pisa, UNU-Merit (Maastricht), and also conference participants at ESSID 2005, DRUID Summer conference 2006, the 4th Sant’Anna School PhD conference in Volterra (September 2006), the IKD-DIME London conference (December 2006), the Universit`a di Pisa conference in Lucca (January 2007), and ICEEE 2007.
Also I would like to thank Elda Andr´e, Annie Garnero, Nadine Hengel, Jean-Luc Outin, and Eric Zyla (Paris 1), Laura Ferrari and Luisa Martolini (Pisa), and Dani`ele Bastide (INSEE) for their kind help on administrative issues.
My frequent journeying between Paris and Pisa would not have been possible without fi-nancial support from the VINCI project run by the Universit´e Franco-Italienne. Furthermore, financial support from the Center for International Programs Abroad (CIPA) at Emory Uni-versity, Atlanta (GA), is gratefully acknowledged concerning a two month research visit at the end of 2005.
Contents
1 Introduction 5
I
Literature review
14
2 A Survey of Firm Growth 15
2.1 Introduction . . . 15
2.2 Empirical evidence on firm growth . . . 16
2.2.1 Size and growth rates distributions . . . 16
2.2.2 Gibrat’s Law . . . 21
2.2.3 Other determinants of firm growth . . . 30
2.2.4 Conclusion . . . 42
2.3 Theoretical contributions . . . 45
2.3.1 Neoclassical foundations – growth towards an ‘optimal size’ . . . 45
2.3.2 Penrose’s ‘Theory of the Growth of the Firm’ . . . 46
2.3.3 Marris and ‘managerialism’ . . . 48
2.3.4 Evolutionary Economics and the principle of ‘growth of the fitter’ . . . 49
2.3.5 Population ecology . . . 52
2.3.6 Conclusion . . . 53
2.4 Growth strategies . . . 54
2.4.1 Attitudes to growth . . . 54
2.4.2 Growth strategies – replication or diversification . . . 59
2.4.3 Internal growth vs growth by acquisition . . . 64
2.5 Growth of small and large firms . . . 65
2.5.1 Differences in growth patterns for small and large firms . . . 65
2.5.2 Modelling the ‘stages of growth’ . . . 67
2.6 Conclusion . . . 71
II
Regularities in the growth process
73
3 Corporate growth and industrial dynamics 74
3.1 Introduction . . . 74
3.2 Data description . . . 76
3.3 Aggregate properties . . . 76
3.3.1 Size distribution . . . 77
3.3.2 Growth rates distribution . . . 82
3.4 Sectoral properties . . . 84
3.4.1 Size distribution . . . 84
3.4.2 Distribution of growth rates . . . 89
3.5 Conclusion . . . 91
4 A closer look at autocorrelation 93 4.1 Introduction . . . 93 4.2 Literature review . . . 95 4.3 Database . . . 97 4.4 Analysis . . . 97 4.4.1 Summary statistics . . . 97 4.4.2 Regression analysis . . . 99
4.4.3 Does autocorrelation vary with firm size? . . . 100
4.5 Quantile regression analysis . . . 102
4.5.1 An introduction to quantile regression . . . 102
4.5.2 Quantile regression results . . . 104
4.5.3 Robustness across size groups . . . 105
4.5.4 Robustness to temporal disaggregation . . . 108
4.5.5 Robustness to sectoral disaggregation . . . 109
4.6 Summary and Conclusions . . . 110
III
Financial performance and growth
116
5 Theories of financial constraints 117 5.1 Introduction . . . 1175.2 A review of the three theories . . . 118
5.2.1 q theory . . . 118
5.2.2 Imperfect markets theory . . . 121
5.2.3 Evolutionary theory . . . 123
5.4 A comparison of the policy recommendations . . . 128
5.5 Conclusion . . . 129
6 Profits and growth 131 6.1 Introduction . . . 131
6.2 Database . . . 135
6.3 Methodology . . . 137
6.3.1 Sources of endogeneity in the regression of profits on growth . . . 137
6.3.2 An introduction to system GMM . . . 138
6.4 Analysis . . . 140
6.4.1 Non-parametric analysis . . . 140
6.4.2 Parametric analysis . . . 141
6.5 Conclusion . . . 147
IV
Innovation and growth
149
7 Innovation and growth 150 7.1 Innovation and Sales Growth – What do we know? . . . 1517.2 Methodology - How can we measure innovativeness? . . . 154
7.3 Database description . . . 156
7.3.1 Database . . . 156
7.3.2 Summary statistics and the ‘innovativeness’ index . . . 158
7.4 Quantile regression results . . . 160
7.5 Conclusions and Implications for Policy . . . 166
8 Innovation and market value 169 8.1 Introduction . . . 169
8.2 Database Description and Summary Statistics . . . 170
8.3 Quantile regression results . . . 173
V
Conclusion
177
Chapter 1
Introduction
The primary focus of this thesis is to advance our understanding of the phenomenon of firm growth. In our modern economy, industries are becoming more and more turbulent and the struggle between firms for market share is becoming increasingly fierce. The growing impor-tance of innovation, in particular, has been responsible for this. In addition, the development of financial institutions has enabled firms to accelerate their expansion projects with the sup-port of external finance. Globalization has forced firms to become aware of their overseas markets, as the struggle for customers can no longer be confined within national borders. More generally, the fast pace of the information age has changed the way firms operate, bring-ing customers closer to their suppliers. For all of these reasons, and more besides, we believe it is necessary to take a new look at the growth of firms.
It is instructive to place firm growth in a historical perspective. In the past, a large size was a prerequisite for security. Firms strove to become large in order to guarantee their future. The advantages of a large size were reinforced by the relatively backward state of financial markets. Large firms had the advantage of ‘deeper pockets’ into which they could delve during adverse business conditions. Another factor to be taken into consideration is that at the beginning of the twentieth century, the ‘Fordist’ brand of mass-production techniques was very much in vogue. During this period, the growth of firms was associated with economies of scale and lower unit costs. Furthermore, firms began to question the mono-product business model that had hitherto been the norm. In this vein, Du Pont de Nemours achieved legendary success by engaging in a diversified portfolio of activities arranged in the context of a decentralized and multidivisional organizational form. In addition, it was conjectured (e.g. by Schumpeter) that it was primarily the large firms that were willing and capable of investing in R&D laboratories. Large size was therefore considered to be a sign of the accomplishment of a firm’s aspirations, and as something of an ‘ultimate stage’ in a firm’s development.
In the present business climate, however, there is an emphasis on flexibility and ‘lean’ production. We are now in an age where downsizing and refocusing are celebrated strategies.
A capitalism based on mass production and standardization has given way to an organization of production based on customization and product differentiation. Improvements in financial markets, and the aversion of shareholders to diversified firms (and conglomerates in particu-lar) has brought on the disintegration of the large Chandlerian firm. Information Technology has played a role in this, allowing firms to increase the flexibility of their production lines. Indeed, there is evidence to suggest that the introduction of productivity-enhancing Infor-mation Technology has been accompanied by widespread organizational change (Brynjolfsson and Hitt, 2000). Furthermore, Information Technology has helped reduce transaction costs, thereby reducing the incentives for firms to be fully integrated along their respective ‘fili`eres’. In the context of the ‘make-or-buy’ dilemma, firms need to be less cautious about dealing with suppliers through the market mechanism, even if this means the outsourcing of services from far-away continents. The fast pace of change in markets has led to the emergence of a new stereotype – the lean, flexible firm whose competitive advantage rests on a focus on a small number of core competences.
In the light of this discussion, it is evident that we need to reconsider the subject of the growth of firms – a subject which still, arguably, remains dominated by the seasoned works of Gibrat (1931), Penrose (1959) and Marris (1964).
Early theoretical work into the size and growth of firms was placed in a comparative statics framework, and by reason of its static nature did not really deal with the dynamic phenomenon of growth. Firms were supposed to be at their ‘optimal size’; and if they weren’t there already, they were assumed to grow instantaneously to reach it. In this way, firm growth received a cursory treatment as an appendage to the optimal size theory. Firms were considered to grow only inasmuch as this enabled them to reach their optimal size. However, dissatisfaction with this theory of firm behavior has grown in recent decades. Notions of an ‘optimal size’ have been rejected in almost any interpretation of the phrase that one might subscribe to. Similarly, other theoretical contributions surveyed in Chapter 2 have not been helpful in describing the growth of firms. Instead, emphasis has been placed on the prevalence of uncertainty and bounded rationality in the context of a turbulent and restless economy. It is therefore our view that the evolution of the economy cannot be worked out from the armchair. Instead, our understanding of the growth of firms must progress through solid empirical analysis. This necessarily involves ‘getting one’s hands dirty’ and working with data. We feel obliged to reiterate an exhortation that is dated but nonetheless still very relevant: “The subject of organizational growth has progressed beyond abysmal darkness. It is ready for – and badly needs – solid, systematic empirical research directed toward explicit hypotheses and utilizing sophisticated statistical methods” (Starbuck, 1971: 126).
The choice of an empirical approach to research into firm growth has been bolstered by several recent trends in economic research. First, the development of longitudinal datasets,
which allow detailed analysis at the firm level, has been responsible for much of the recent progress in our understanding of firm behavior and industrial development. Second, econo-metric techniques have kept pace with the availability of increasingly informative datasets. Modern econometric work is able to deal with such complicated issues of endogeneity, un-observed time-invariant effects, and selection bias. The progress that has been made in this domain has been reflected by the number of Nobel memorial prizes awarded to econometri-cians in recent years. Third, steady increases in computational power have been able to match developments in databases and econometric techniques. Bootstrapping methods, for example, are particularly computationally intensive and their use has only become feasible thanks to developments in the performance of computers.
Care should be taken in choosing our empirical methodology, however. There are cer-tainly many pitfalls and limitations that accompany empirical work. In particular, in this thesis we consider it to be necessary to recognize the great heterogeneity that exists between firms, whether we consider productivity levels, profitability, or a large number of other key dimensions. As Griliches and Mairesse (1995: 23) explain:
“We also thought that one could reduce aggregation biases by reducing the heterogeneity as one goes down from such general mixtures as ’total manufacturing’ to something more coherent, such as ‘petroleum refining’ or the ‘manufacture of cement’. But something like Mandelbrot’s fractals phenomenon seems to be at work here also: the observed variability-heterogeneity does not really decline as we cut our data finer and finer. There is a sense in which different bakeries are just as much different from each other, as the steel industry is from the machinery industry.”
(See also Dosi and Grazzi (2006) for further evidence of pervasive heterogeneity of firms, even at finely disaggregated levels.) We should be cautious of notions of a ‘representative firm’ which might lead us to overlook this heterogeneity. The assumption of homogenous firms1 is not innocuous, and in our case it leads to a rather different characterization of
the underlying phenomenon. Indeed, the analyses presented in Chapters 4, 7 and 8 yield results that are qualitatively different from those that could be inferred from approaches that deal exclusively with ‘the firm on average’. In an attempt to deal with this issue of heterogeneity, much of our analysis employs quantile regression techniques, that are able to identify differential effects of the explanatory variables across the conditional distribution of
1Note however that there are subtle differences between the concepts of the ‘representative firm’ in
Mar-shall’s sense, and the concept of ‘representative firm’ employed in other models. MarMar-shall’s ‘representative firm’ refers to one single firm that has the same behaviour as the industrial sector. Other models, however, consider the representative firm to be some sort of ‘average firm’, and model industries as being composed of n such identical firms (i.e. n ‘clones’) that are in competition with each other.
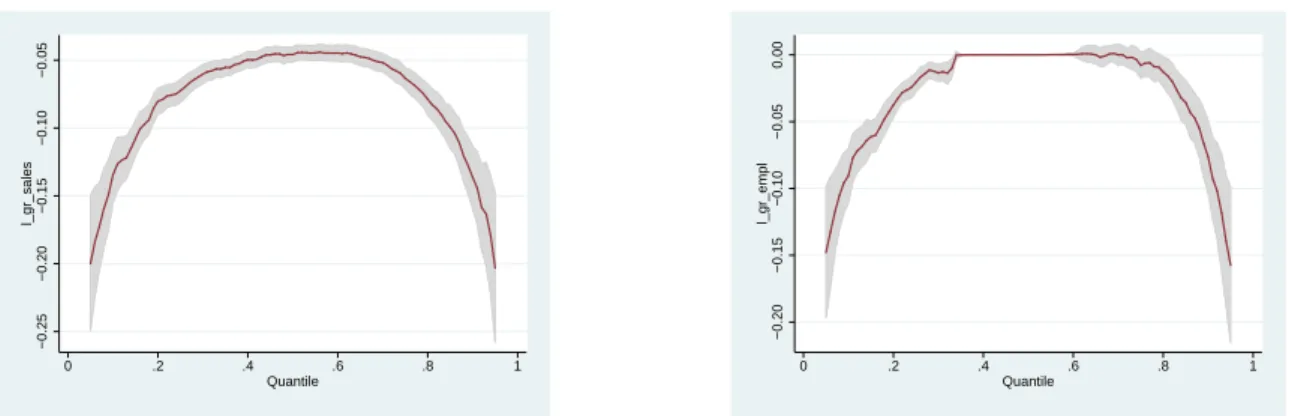
the dependent variable. Our results clearly indicate that a much richer appreciation of the underlying economic relationships is made possible only by allowing for heterogeneous effects. For these reasons the notion of the ‘representative firm’ has been qualified (if not discred-ited) in theoretical discourse; however it can still be seen to persist in a nuanced form in empirical work. Although, the hypothesis of the ‘representative firm’ in empirical research has largely escaped attention, it can be found implicitly in conventional regression estimators that focus on summary point estimates corresponding to ‘the average effect for the average firm’. This approach is particularly ill-suited for looking at the relationship between innovation and firm growth, for example, because innovating firms have fundamentally heterogeneous perfor-mance differences – a minority of firms doing spectacularly well whilst in most cases R&D efforts will yield nothing substantial. Whilst many economists would question the usefulness of calculating, for example, the average value of a patent (without further investigating the distribution of patents), it seems that empirical work to date has been quite content to con-sider the ‘average’ influence of innovation on firm growth. In this thesis, however, we concon-sider the influence of innovation on firm growth over the range of the conditional growth rate distri-bution. More generally, the focus of conventional regression estimators on ‘the average effect for the average firm’ is unhelpful because the ‘average firm’ is not representative. As is evident from the tent-shaped plots of growth rates (introduced into economics by Giulio Bottazzi, Gio-vanni Dosi, Angelo Secchi and colleagues; see Figures 2.3 and 2.4 on page 21 for an example) we see that the average firm does not grow very much at all. We argue that there is little point in trying to find the determinants of growth for the ‘average firm’, because this latter grows so little that its growth could be due to almost anything (hence the highly idiosyncratic component that is commonly found). Instead, it is just a handful of extreme-growth firms that are responsible for a disproportionate share of the turbulence and reallocation that drives industry dynamics. Focusing on the ‘average firm’ in the case of firm growth rates would be to misplace our attention. One of the main organizing themes of Chapter 7, and perhaps of the thesis in general, is that it is a heterogeneous minority of agents that is driving the process of industrial evolution.
Our empirical analysis is guided by the evolutionary perspective, for several reasons. First, this perspective explicitly recognizes the heterogeneity of firms (Paulr´e, 1997). At any time, we can expect there to be considerable diversity in the characteristics of firms. Whilst the least viable firms can be expected to be eliminated due to selection pressures, there will remain at any time a marked heterogeneity between the surviving firms, even among dimensions such as productivity and production methods. The importance of such an evolutionary vision of the economy has been further underlined by recent observations (referred to in the thesis) that selection pressures are rather weak. Second, evolutionary economics is based on what Sid Winter has called a ‘dynamics first! ’ approach. A dynamic view of firms and industries is
obviously an essential ‘point de d´epart’ for our study of the growth of firms. Third, evolution-ary economics embraces the phenomenon of innovation in a way that other perspectives are not able to do. The importance of firm-level innovative activity has grown tremendously over the last decades, and we need a theoretical framework that will take this into account. This is especially true given that Chapters 7 and 8 focus specifically on firm-level innovation. Fourth, the low rationality assumptions that form the basis of the evolutionary framework strike us as simply being far more judicious than the ‘Olympian’ rationality frequently assumed in the neoclassical paradigm. Uncertainty is unquestionably one of the basic features of the modern economy, and it seems to us to be one of the defining characteristics of firm growth. Indeed, in Chapter 5 we criticise the mainstream literature that takes the assumption of infinitely ratio-nal profit-maximizing firms as a foundation for its empirical work into firm-level investment patterns. Instead, we delve into evolutionary theory to obtain a guiding theory. In Chapter 6 we investigate the evolutionary principle of ‘growth of the fitter’ and it is astonishing to ob-serve that even this general principle, when taken literally, does not appear to hold. It seems that even evolutionary economics, which has genuinely mild rationality assumptions, may be overstating the capacity of the forces of economic selection.
A final motivation for basing our analysis in the evolutionary perspective is that it appears to be in accordance with the empirical facts. One of the few regularities that has emerged from research into the growth of firms is that Gibrat’s ‘law of proportionate effect’ appears to provide a better description of industrial development than any other alternative theory. Although Gibrat’s law is frequently criticised as having no theoretical content (due to the emphasis on purely stochastic shocks), on the contrary it is our view that Gibrat’s law does have a theoretical basis, and that it is not too far-fetched to consider that this basis is of an ‘evolutionary’ flavour. We have three reasons for making this association. First, Gibrat’s law emphasizes heterogeneity between firms that stems from the variance of the growth shocks. Second, Gibrat’s law accomodates the evolutionary principle of path dependency (i.e. the ‘history matters’ argument) by the fact that a firm’s current size is viewed as the mere amal-gamation of all previous growth shocks. Third, the stochastic nature of Gibrat’s law can be seen to emphasize the inherent uncertainty that permeates modern capitalism.
The analysis in this thesis inevitably presents only a partial description of the processes of industrial evolution. Among a large number of limitations, let us mention here three caveats that we believe to be the most important.
First, a major gap in the thesis concerns our deflection of questions relating to entries and exits of firms. These discrete events also have a substantial impact in shaping the evolution of industries. Nonetheless, it is our intuition that there is much that can be learnt just by concentrating the growth of firms. Selection can, in fact, be seen to operate through two mechanisms. One is selection via differential growth (i.e. the principle of ‘growth of the fitter’)
and the other is selection via exit (i.e. ‘survival of the fitter’). The first corresponds to Fisher’s fundamental equation (also known as ‘replicator dynamics’), whereas the second is perhaps closer to Baumol’s vision of contestable markets. The focus of this thesis is on the former. It can be expected that future work will not neglect these issues relating to entry and exit, although it must be acknowledged that a substantial body of literature already does focus on these issues.
A second major omission in our analysis is that we do not deal with growth by merger or acquisition in any great detail. These are rather peculiar modes of growth, corresponding to a transfer of productive capacity, rather than any objective increase in productive capacity. In our analysis of the French manufacturing industry (Chapters 3, 4 and 6), we have the unique possibility of separating these events from internal growth, because M&A events are coded for in the data and can thus be excluded. (In our analysis of US high-tech sectors in Chapters 7 and 8, however, it has not been possible to make the distinction between M&A and organic growth.)
A third caveat we should mention here is that our analysis does not include the very small firms that have only a small number (or indeed zero) employees. It was not possible to look at these cases given the nature of our databases. Although these firms represent a large part of the absolute number of business enterprises, it should be remembered here that their weighted share of economic activity is relatively small. Furthermore, these firms are quite different with respect to attitudes to growth – there is evidence that many small business managers are what we could call ‘lifestylers’2, who display a certain aversion to growth. For
such individuals, the enterprise is merely the guarantee of an independent way of life rather than being the apparatus of any serious attempt at ‘capitalist profit-maximisation’. As a consequence, the omission of these micro businesses does not appear to be a fatal flaw in our analysis.
Structure of the thesis This thesis is split into 5 parts. Part 1 aims to provide a reasonably comprehensive review of the literature to bring the reader up to date with the current state of knowledge about firm growth. Part 2 contains investigations into some basic features of growth rates and their autocorrelation structure. Part 3 focuses on the relationship between profits and growth. Part 4 attends to the influence of firm-level innovative activity on firm performance, and Part 5 concludes.
The ‘modular’ nature of the thesis is not simply due to the ‘Anglo-Saxon’ thesis design encouraged at many leading universities (including the Sant’Anna School of Advanced Stud-ies, Pisa) whereby a thesis consists of three articles rather than one coherent book. The main reason for the multipronged research strategy is that the growth of firms is very much a
faceted phenomenon, and there are gaps in the literature that are best addressed individually. Indeed, in our analysis we use two completely different databases for precisely this reason. The first database, obtained from the French Statistical Office (INSEE), contains information on virtually all French manufacturing firms with over 20 employees. The second database, which describes large firms in the US high-tech manufacturing industry, was constructed for the purposes of obtaining reliable quantitative indicators of innovation.
Chapter 2 opens the thesis by providing a lengthy survey of the ‘state of the art’ of research into firm growth. It certainly is not merely a perfunctory introductory chapter, but it is essential introduction to the analysis in the rest of the thesis. We need an up-to-date catalogue of empirical work in which we can situate our subsequent analysis. It is necessary to have a feel of what has already been done in order to appreciate the contribution of the following chapters. In addition, the literature review deliberately emphasizes the multifaceted nature of firm growth. The reason for this is that we want the reader to be aware that what we call an ‘observation’ in the ensuing econometric investigations (i.e. a percentage growth rate for a firm in a given year) is not just a ‘statistic’ but actually has a much deeper significance. Chapter 2 therefore aims to emphasize the multidimensional and qualitative aspects of firm growth which risk being overlooked in the subsequent statistical analysis. This is indeed one of the dangers of empirical work – one can get so accustomed to dealing with numbers that one may forget what the numbers actually represent. (This has lead some individuals to be unnecessarily apprehensive about empirical work in general.)
One of the main results that emerges from the literature review is that the random element of growth rates is predominant. Efforts to identify the determinants of firm growth have had a limited success, and the combined explanatory power of the explanatory variables (summarized by the R2 statistic) is typically low, usually below 10%. It may well be that, after reading the
survey of the empirical evidence, both the econometrician and the theorist feel like tearing their clothes in frustration and wailing “random, utterly random, everything is random!” Theory and evidence do not appear to concur, especially concerning the relationships between innovation and growth and financial performance and growth. Whilst theoretical models and survey evidence suggest that innovation has a key role in explaining the growth of firms, it appears that the empirical evidence has difficulty in identifying any such effect. Indeed, some studies fail to find any significant effect of innovation on firm growth. Another puzzling result concerns the relationship between a firm’s financial performance and its growth. Whilst the neoclassical and the evolutionary schools of thought can be considered to offer contrasting interpretations of any relationship between financial performance and growth, the empirical evidence suggests that the two series are, for practical purposes, quite independent. These are some of the issues we explore in the subsequent analysis.
on French manufacturing firms. We observe that firm growth seems to be largely independent of firm size, although the variance of growth rates tends to decrease with size. We also discover that the distribution of growth rates has fatter tails than both the Gaussian and the Laplace densities. This distribution is even fatter tailed than the corresponding distributions observed in the previous literature on Italian and US manufacturing industries.
Chapter 4 follows on from the preceding chapter by taking a closer look at growth rate autocorrelation patterns in the French manufacturing database. Although at the aggregate level we observe a small negative autocorrelation, this is to a certain extent a mere aggregation effect that is specific to the composition of the database. We explore the autocorrelation dynamics of firms along two key dimensions – size and growth rate. Considering first a firm’s size, we show that larger firms seem to experience positive feedback in their growth patterns, while the dynamics of smaller firms tend to display negative autocorrelation. It also appears that extreme-growth firms (that is, the fastest-growing or fastest-shrinking firms) are especially susceptible to negative autocorrelation. This latter result is especially true for small firms, but does not appear to be so important for the largest firms.
Chapter 5 serves as a theoretical discussion in which the empirical analysis in Chapter 6 can be framed. Chapter 5 documents how the mainstream literature, which can be traced back to the q theory of investment, tends to interpret any relationship between investment (which we take as a proxy for growth) and measures of financial performance such as ‘cash flow’ as a sign that financial constraints are preventing the economy from reaching its optimum. Although there are many possible interpretations, the most common way of explaining investment-cash flow sensitivities is in terms of financial constraints. Instead, we argue that the problem of financial constraints for firms has been exaggerated. We suggest that the financial constraints interpretation is an artefact of the modelling assumptions (the perfect rationality and profit-maximization hypotheses in particular). We construct an alternative interpretation basing ourselves on the evolutionary principle of ‘growth of the fitter’. In this view, selective pressures ensure that a firm’s growth depends on its financial performance.
Chapter 6 presents the empirical analysis of the relationship between firm growth and financial performance (or more precisely, scaled gross operating margin). We use a variety of techniques ranging from non-parametric scatterplots to panel data techniques, these latter being able to control for a variety of econometric issues such as endogeneity and unobserved firm-specific effects. Although our regressions yield a positive and significant coefficient, we conclude that the magnitude is small enough to be regarded as inconsequential in economic terms. Interestingly enough, however, we observe that growth has a positive effect on profit rates, and this effect seems to be larger than that of profits on growth.
Chapter 7 investigates the influence of innovation on growth, focusing on high-tech in-dustries in the US manufacturing sector. We begin by creating a composite ‘innovativeness’
variable using information from a firm’s recent history of patenting and R&D expenditures. Our analysis shows that the uncertainty of innovation is reflected in the growth patterns of innovating firms. Whilst some firms are seen to experience spectacular growth, this growth is strongly associated with their previous attempts at innovation. For many other firms, however, the influence of innovation on growth seems to be much less impressive.
Chapter 8 follows on from Chapter 7, albeit with a different measure for firm performance. Given that it may take a long time for innovation to materialize into the growth of sales of new products, the choice of a different proxy for firm performance might be warranted. We explain that the time lag between innovation and firm performance is likely to be shorter when a firm’s market value is used to measure post-innovation performance. It is nonetheless encouraging that we observe the same qualitative results as in the previous chapter, further emphasizing the heterogeneous effects of innovation on firm performance. Some firms achieve an astonishing success on the stock market, and their market value is strongly associated with their previous investments in innovation. For the firms with the lowest market values, however, it seems that their attempts at innovation are virtually ignored by the stock market. In Chapter 9 we share some concluding thoughts. Whilst we maintain that this thesis has made an important contribution to the literature, we also outline how future work might shed further light on the phenomenon of firm growth.
Part of this thesis comes from co-authored research. Chapter 3 was written with Giulio Bottazzi, Nadia Jacoby, and Angelo Secchi (see Bottazzi et al., 2005). Chapters 7 and 8 draws from ongoing work with Rekha Rao (see Coad and Rao, 2006a,b,c). In fact, a version of Chapter 8 has already been published in Economics Bulletin. Other chapters are currently beyond the initial ‘revise and resubmit’ stage of publication in journals. Chapter 4 (also available as Coad, 2006b) has received a second round ‘revise and resubmit’ from the Review
of Industrial Organization. Chapter 6 (also available as Coad, 2005) has been revised and
resubmitted to Structural Change and Economic Dynamics. Finally, Chapters 2 and 4 have made previous appearances as Coad (2007b) and Coad (2007a) respectively.
Part I
Literature review
Chapter 2
A survey of facts and theories relating
to the growth of firms
In order to appreciate the contribution of this thesis, it is necessary to review the work that has already been done in the domain of the growth of firms. This first chapter aims to provide an up-to-date and reasonably comprehensive survey for such purposes.
The present Chapter explains how theoretical work has often been unhelpful in explaining the growth of firms. Instead, we argue that progress in this particular area requires careful empirical work. In particular, it is emphasized that there are certain gaps in the literature concerning the relationship between innovation and growth, and between financial performance and growth. Although theoretical contributions have made bold claims on the nature of these relationships, empirical work has not risen to the challenge in a satisfactory way.
2.1
Introduction
The aim of this survey is to give a overview of research into the growth of firms, while also highlighting areas in need of further research. It is a multidisciplinary survey, drawing on contributions made in economics, management and also sociology.
There are many different measures of firm size, some of the more usual indicators being employment, total sales, value-added, total assets, or total profits; and some of the less con-ventional ones such as ‘acres of land’ or ‘head of cattle’ (Weiss, 1998). In this survey we consider growth in terms of a range of indicators, although we devote little attention to the growth of profits (this latter being more of a financial than an economic variable).
There are also different ways of measuring growth rates. Some authors (such as Delmar et al., 2003) make the distinction between relative growth (i.e. the growth rate in percentage terms) and absolute growth (usually measured in the absolute increase in numbers of employ-ees). In this vein, we can mention the ‘Birch index’ which is a weighted average of both relative
and absolute growth rates (this latter being taken into account to emphasize that large firms, due to their large size, have the potential to create many jobs). This survey focuses on relative growth rates only. Furthermore, in our discussion of the processes of expansion we emphasize positive growth and not so much negative growth.1
In true Simonian style,2 we begin with some empirical insights in Section 2.2, considering
first the distributions of size and growth rates, and moving on to look for determinants of growth rates. We then present some theories of firm growth and evaluate their performance in explaining the stylised facts that emerge from empirical work (Section 2.3). In Section 2.4 we consider the demand and supply sides of growth by discussing the attitudes of firms towards growth opportunities as well as investigating the processes by which firms actually grow (growth by ‘more of the same’, growth by diversification, growth by acquisition). In Section 2.5 we examine the differences between the growth of small and large firms in greater depth. We also review the ‘stages of growth’ models. Section 2.6 concludes.
2.2
Empirical evidence on firm growth
To begin with, we take a non-parametric look at the distributions of firm size and growth rates, before moving on to results from regressions that investigate the determinants of growth rates.
2.2.1
Size and growth rates distributions
A suitable starting point for studies into industrial structure and dynamics is the firm size distribution. In fact, it was by contemplating the empirical size distribution that Robert Gibrat (1931) proposed the well-known ‘Law of Proportionate Effect’ (also known as ‘Gibrat’s law’).
We also discuss the results of research into the growth rates distribution. The regular-ity that firm growth rates are approximately exponentially distributed was discovered only recently, but offers unique insights into the growth patterns of firms.
Size distributions
The observation that the firm-size distribution is positively skewed proved to be a useful point of entry for research into the structure of industries. (See Figures 2.1 and 2.2 for some examples of aggregate firm size distributions.) Robert Gibrat (1931) considered the size of French firms in terms of employees and concluded that the lognormal distribution was a valid heuristic. Hart and Prais (1956) presented further evidence on the size distribution, using data on quoted
1For an introduction to organizational decline, see Whetten (1987).
UK firms, and also concluded in favour of a lognormal model. The lognormal distribution, however, can be viewed as just one of several candidate skew distributions. Although Simon and Bonini (1958) maintained that the “lognormal generally fits quite well” (1958: p611), they preferred to consider the lognormal distribution as a special case in the wider family of ‘Yule’ distributions. The advantage of the Yule family of distributions was that the phenomenon of arrival of new firms could be incorporated into the model. Steindl (1965) applied Austrian data to his analysis of the firm size distribution, and preferred the Pareto distribution to the lognormal on account of its superior performance in describing the upper tail of the distribution. Similarly, Ijiri and Simon (1964, 1971, 1974) apply the Pareto distribution to analyse the size distribution of large US firms.
Efforts have been made to discriminate between the various candidate skew distributions. One problem with the Pareto distribution is that the empirical density has many more middle-sized firms and fewer very large firms than would be theoretically predicted (Vining, 1976). Other research on the lognormal distribution has shown that the upper tail of the empirical size distribution of firms is too thin relative to the lognormal (Stanley et al., 1995). Quandt (1966) compares the performance of the lognormal and three versions of the Pareto distribution, using data disaggregated according to industry. He reports the superiority of the lognormal over the three types of Pareto distribution, although each of the distributions produces a best-fit for at least one sample. Furthermore, it may be that some industries (e.g. the footwear industry) are not fitted well by any distribution.
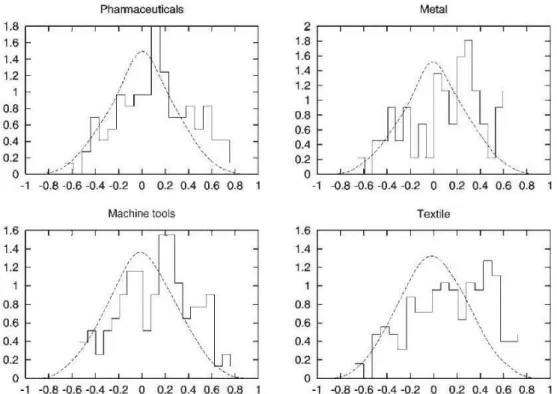
More generally, Quandt’s results on disaggregated data lead us to suspect that the regu-larities of the firm-size distribution observed at the aggregate level do not hold with sectoral disaggregation. Silberman (1967) also finds significant departures from lognormality in his analysis of 90 four-digit SIC sectors. It has been suggested that, while the firm size distribu-tion has a smooth regular shape at the aggregate level, this may merely be due to a statistical aggregation effect rather than a phenomenon bearing any deeper economic meaning (Dosi et al, 1995; Dosi, 2007). Empirical results lend support to these conjectures by showing that the regular unimodal firm size distributions observed at the aggregate level can be decomposed into much ‘messier’ distributions at the industry level, some of which are visibly multimodal (Bottazzi and Secchi, 2003; see also Chapter 3 in this thesis). For example, Bottazzi and Secchi (2005) present evidence of significant bimodality in the firm size distribution of the worldwide pharmaceutical industry, and relate this to a cleavage between the industry leaders and fringe competitors.
Other work on the firm-size distribution has focused on the evolution of the shape of the distribution over time. It would appear that the initial size distribution for new firms is particularly right-skewed, although the log-size distribution tends to become more symmetric as time goes by. This is consistent with observations that small young firms grow faster than
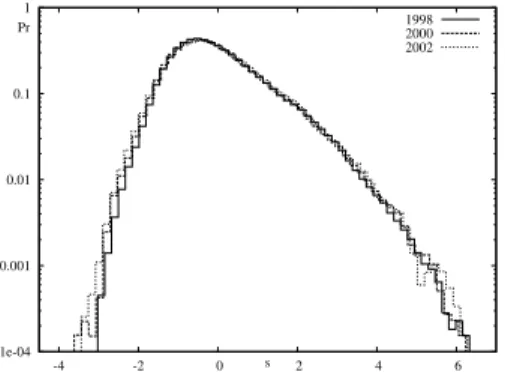
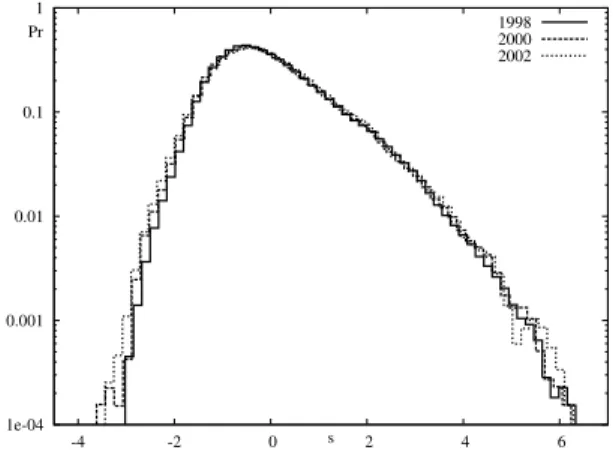
1e-04 0.001 0.01 0.1 1 -4 -2 0 2 4 6 Pr s 1998 2000 2002
Figure 2.1: Kernel estimates of the density of firm size (total sales) in 1998, 2000 and 2002, for French manufacturing firms with more than 20 employees. Source: Bottazzi et al., 2005.
Figure 2.2: Probability density function of the sizes of US manufacturing firms in 1997. Source: Axtell, 2001.
their larger counterparts. As a result, it has been suggested that the log-normal can be seen as a kind of ‘limit distribution’ to which a given cohort of firms will eventually converge. Lotti and Santarelli (2001) present support for this hypothesis by tracking cohorts of new firms in several sectors of Italian manufacturing. Cabral and Mata (2003) find similar results in their analysis of cohorts of new Portuguese firms. However, Cabral and Mata interpret their results by referring to financial constraints that restrict the scale of operations for new firms, but become less binding over time, thus allowing these small firms to grow relatively rapidly and reach their preferred size. They also argue that selection does not have a strong effect on the evolution of market structure.
Although the skewed nature of the firm size distribution is a robust finding, there may be some other features of this distribution that are specific to countries. Table 2.1, taken from Bartelsman et al. (2005), highlights some differences in the structure of industries across countries. Among other things, one observes that large firms account for a considerable share of French industry, whereas in Italy firms tend to be much smaller on average. (These international differences cannot simply be attributed to differences in sectoral specialization across countries.)
Growth rates distributions
It has long been known that the distribution of firm growth rates is fat-tailed. In an early con-tribution, Ashton (1926) considers the growth patterns of British textile firms and observes that “In their growth they obey no one law. A few apparently undergo a steady expan-sion. . . With others, increase in size takes place by a sudden leap” (Ashton 1926: 572-573). Little (1962) investigates the distribution of growth rates, and also finds that the distribution is fat-tailed. Similarly, Geroski and Gugler (2004) compare the distribution of growth rates to the normal case and comment on the fat-tailed nature of the empirical density. Recent
T able 2.1: The imp ortance of small firms (i.e. firms with few er than 20 emplo yees) across broad sectors and coun tries, 1989-94 Absolute num b er (%) Share of emplo ymen t (%) Av e. No. Emplo yees p er firm T otal econom y Man ufacturing Business services T otal econom y Man ufacturing Business services T otal econom y Man ufacturing Business services US 86.7 69.9 87.9 16.6 5.8 20.6 26.4 80.3 21.4 W estern German y 87.9 77.9 90.2 23.6 11.3 33.8 17.0 39.1 11.5 F rance 78.6 73.6 78.8 13.9 17.0 12.1 33.5 32.1 35.7 Italy 93.1 87.5 96.5 34.4 30.3 46.3 10.5 15.3 6.8 UK -74.9 -8.3 -40.7 -Canada -12.7 40.5 12.0 Denmark 90.0 74.0 90.8 30.2 16.1 33.4 13.3 30.4 12.7 Finland 92.6 84.8 94.5 25.8 13.0 33.0 13.0 27.8 9.9 Netherlands 95.8 86.7 96.8 31.2 16.9 41.9 6.5 18.3 5.3 P ortugal 86.3 70.5 92.8 27.7 15.7 39.8 16.8 31.0 11.4 Source: Bartelsman et al. (2005: T ables 2 and 3). Notes: the columns lab elled ‘share of emplo ymen t’ refer to the emplo ymen t share of firms with few er than 20 emplo yees.
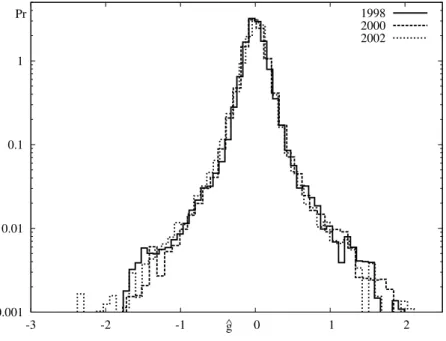
empirical research, from an ‘econophysics’ background, has discovered that the distribution of firm growth rates closely follows the parametric form of the Laplace density. Using the Compustat database of US manufacturing firms, Stanley et al. (1996) observe a ‘tent-shaped’ distribution on log-log plots that corresponds to the symmetric exponential, or Laplace dis-tribution (see also Amaral et al. (1997) and Lee et al. (1998)). The quality of the fit of the empirical distribution to the Laplace density is quite remarkable. The Laplace distribution is also found to be a rather useful representation when considering growth rates of firms in the worldwide pharmaceutical industry (Bottazzi et al., 2001). Giulio Bottazzi and coauthors extend these findings by considering the Laplace density in the wider context of the family of Subbotin distributions (beginning with Bottazzi et al., 2002). They find that, for the Compu-stat database, the Laplace is indeed a suitable distribution for modelling firm growth rates, at both aggregate and disaggregated levels of analysis (Bottazzi and Secchi 2003a). The expo-nential nature of the distribution of growth rates also holds for other databases, such as Italian manufacturing (Bottazzi et al. (2007)). In addition, the exponential distribution appears to hold across a variety of firm growth indicators, such as Sales growth, employment growth or Value Added growth (Bottazzi et al., 2007). The growth rates of French manufacturing firms have also been studied, and roughly speaking a similar shape was observed, although it must be said that the empirical density was noticeably fatter-tailed than the Laplace (see Chap-ter 3).3 Research into Danish manufacturing firms presents further evidence that the growth
rate distribution is heavy-tailed, although it is suggested that the distribution for individual sectors may not be symmetric but right-skewed (Reichstein and Jensen (2005)). Generally speaking, however, it would appear that the shape of the growth rate distribution is more robust to disaggregation than the shape of the firm size distribution. In other words, whilst the smooth shape of the aggregate firm size distribution may be little more than a statistical aggregation effect, the ‘tent-shapes’ observed for the aggregate growth rate distribution are usually still visible even at disaggregated levels (Bottazzi and Secchi, 2003a; see also Chap-ter 3). This means that extreme growth events can be expected to occur relatively frequently, and make a disproportionately large contribution to the evolution of industries.
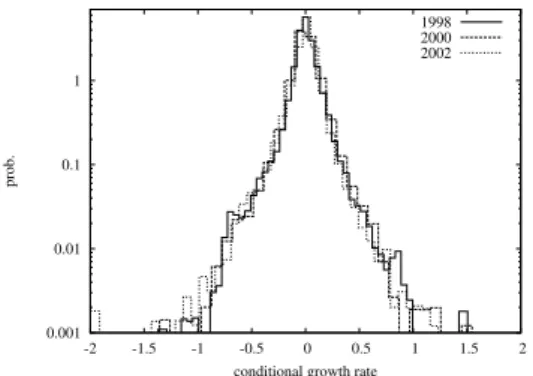
Figures 2.3 and 2.4 show plots of the distribution of sales and employment growth rates for French manufacturing firms with over 20 employees.
Although research suggests that both the size distribution and the growth rate distribution are relatively stable over time, it should be noted that there is great persistence in firm size but much less persistence in growth rates on average (more on growth rate persistence is presented in Section 2.2.2). As a result, it is of interest to investigate how the moments of the growth rates distribution change over the business cycle. Indeed, several studies have focused
3The observed subbotin b parameter (the ‘shape’ parameter) is significantly lower than the Laplace value of
1. This highlights the importance of following Bottazzi et al. (2002) and considering the Laplace as a special case in the Subbotin family of distributions.
0.001 0.01 0.1 1 -3 -2 -1 0 1 2 prob.
conditional growth rate 1998 2000 2002
Figure 2.3: Distribution of sales growth rates of French manufacturing firms. Source: Bottazzi et al., 2005. 0.001 0.01 0.1 1 -2 -1.5 -1 -0.5 0 0.5 1 1.5 2 prob.
conditional growth rate 1998 2000 2002
Figure 2.4: Distribution of employment growth rates of French manufacturing firms. Source: Coad, 2006b.
on these issues and some preliminary results can be mentioned here. It has been suggested that the variance of growth rates changes over time for the employment growth of large US firms (Hall, 1987) and that this variance is procyclical in the case of growth of assets (Geroski et al., 2003). This is consistent with the hypothesis that firms have a lot of discretion in their growth rates of assets during booms but face stricter discipline during recessions. Higson et al. (2002, 2004) consider the evolution of the first four moments of distributions of the growth of sales, for large US and UK firms over periods of 30 years or more. They observe that higher moments of the distribution of sales growth rates have significant cyclical patterns. In particular, evidence from both US and UK firms suggests that the variance and skewness are countercyclical, whereas the kurtosis is pro-cyclical. Higson et al. (2002: 1551) explain the counter-cyclical movements in skewness in these words:
“The central mass of the growth rate distribution responds more strongly to the aggregate shock than the tails. So a negative shock moves the central mass closer to the left of the distribution leaving the right tail behind and generates positive skewness. A positive shock shifts the central mass to the right, closer to the group of rapidly growing firms and away from the group of declining firms. So negative skewness results.”
The procyclical nature of kurtosis (despite their puzzling finding of countercyclical variance) emphasizes that economic downturns change the shape of the growth rate distribution by reducing a key parameter of the ‘spread’ or ‘variation’ between firms.
2.2.2
Gibrat’s Law
Gibrat’s law continues to receive a huge amount of attention in the empirical industrial orga-nization literature, more than 75 years after Gibrat’s (1931) seminal publication.
We do not attempt to provide an exhaustive survey of the literature on Gibrat’s law, because the number of relevant studies is indeed very large. (For other reviews of empirical tests of Gibrat’s Law, the reader is referred to the survey by Lotti et al (2003); for a survey of how Gibrat’s law holds for the services sector see Audretsch et al. (2004).) Instead, we try to provide an overview of the essential results. We investigate how expected growth rates and growth rate variance are influenced by firm size, and also investigate the possible existence of patterns of serial correlation in firm growth.
Gibrat’s model
Robert Gibrat’s (1931) theory of a ‘law of proportionate effect’ was hatched when he observed that the distribution of French manufacturing establishments followed a skew distribution that resembled the lognormal. Gibrat considered the emergence of the firm-size distribution as an outcome or explanandum and wanted to see which underlying growth process could be responsible for generating it.
In its simplest form, Gibrat’s law maintains that the expected growth rate of a given firm is independent of its size at the beginning of the period examined. Alternatively, as Mansfield (1962: 1030) puts it, “the probability of a given proportionate change in size during a specified period is the same for all firms in a given industry – regardless of their size at the beginning of the period.”
More formally, we can explain the growth of firms in the following framework. Let xt
be the size of a firm at time t, and let εt be random variable representing an idiosyncratic,
multiplicative growth shock over the period t − 1 to t. We have
xt− xt−1= εtxt−1 (2.1)
which can be developed to obtain
xt= (1 + εt)xt−1 = x0(1 + ε1)(1 + ε2) . . . (1 + εt) (2.2)
It is then possible to take logarithms in order to approximate log(1 + εt) by εt to obtain4
log(xt) ≈ log(x0) + ε1+ ε2+ . . . + εt= log(x0) +
t
X
s=1
εs (2.3)
4This logarithmic approximation is only justified if ε
t is ‘small’ enough (i.e. close to zero), which can be
In the limit, as t becomes large, the log(x0) term will become insignificant, and we obtain log(xt) ≈ t X s=1 εs (2.4)
In this way, a firm’s size at time t can be explained purely in terms of its idiosyncratic history of multiplicative shocks. If we further assume that all firms in an industry are independent realizations of i.i.d. normally distributed growth shocks, then this stochastic process leads to the emergence of a lognormal firm size distribution.
There are of course several serious limitations to such a simple vision of industrial dynamics. We have already seen that the distribution of growth rates is not normally distributed, but instead resembles the Laplace or ‘symmetric exponential’. Furthermore, contrary to results implied by Gibrat’s model, it is not reasonable to suppose that the variance of firm size tends to infinity (Kalecki, 1945). In addition, we do not observe the secular and unlimited increase in industrial concentration that would be predicted by Gibrat’s law (Caves, 1998). Whilst a ‘weak’ version of Gibrat’s law merely supposes that expected growth rate is independent of firm size, stronger versions of Gibrat’s law imply a range of other issues. For example, Chesher (1979) rejects Gibrat’s law due to the existence of an autocorrelation structure in the growth shocks. Bottazzi and Secchi (2006) reject Gibrat’s law on the basis of a negative relationship between growth rate variance and firm size. Reichstein and Jensen (2005) reject Gibrat’s law after observing that the annual growth rate distribution is not normally distributed.
Firm size and average growth
Although Gibrat’s (1931) seminal book did not provoke much of an immediate reaction, in recent decades it has spawned a flood of empirical work. Nowadays, Gibrat’s ‘Law of Pro-portionate Effect’ constitutes a benchmark model for a broad range of investigations into industrial dynamics. Another possible reason for the popularity of research into Gibrat’s law, one could suggest quite cynically, is that it is a relatively easy paper to write. First of all, it has been argued that there is a minimalistic theoretical background behind the process (because growth is assumed to be purely random). Then, all that needs to be done is to take the IO economist’s ‘favourite’ variable (i.e. firm size, a variable which is easily observable and readily available) and regress the difference on the lagged level. In addition, few control variables are required beyond industry dummies and year dummies, because growth rates are characteristically random.
Empirical investigations of Gibrat’s law rely on estimation of equations of the type:
where a firm’s ‘size’ is represented by xt, α is a constant term (industry-wide growth trend)
and ² is a residual error. Research into Gibrat’s law focuses on the coefficient β. If firm growth is independent of size, then β takes the value of unity. If β is smaller than one, then smaller firms grow faster than their larger counterparts, and we can speak of ‘regression to the mean’. Conversely, if β is larger than one, then larger firms grow relatively rapidly and there is a tendency to concentration and monopoly.
A significant early contribution was made by Edwin Mansfield’s (1962) study of the US steel, petroleum, and rubber tire industries. In particular interest here is what Mansfield identified as three different renditions of Gibrat’s law. According to the first, Gibrat-type regressions consist of both surviving and exiting firms and attribute a growth rate of -100% to exiting firms. However, one caveat of this approach is that smaller firms have a higher exit hazard which may obfuscate the relationship between size and growth. The second version, on the other hand, considers only those firms that survive. Research along these lines has typically shown that smaller firms have higher expected growth rates than larger firms. The third version considers only those large surviving firms that are already larger than the industry Minimum Efficient Scale of production (with exiting firms often being excluded from the analysis). Generally speaking, empirical analysis corresponding to this third approach suggests that growth rates are more or less independent from firm size, which lends support to Gibrat’s law.
The early studies focused on large firms only, presumably partly due to reasons of data availability. A series of papers analyzing UK manufacturing firms found a value of β greater than unity, which would indicate a tendency for larger firms to have higher percentage growth rates (Hart (1962), Samuels (1965), Prais (1974), Singh and Whittington (1975)).
However, the majority of subsequent studies using more recent datasets have found values of
β slightly lower than unity, which implies that, on average, small firms seem to grow faster than
larger firms. This result is frequently labelled ‘reversion to the mean size’ or ‘mean-reversion’.5
Among a large and growing body of research that reports a negative relationship between size and growth, we can mention here the work by Kumar (1985) and Dunne and Hughes (1994) for quoted UK manufacturing firms, Hall (1987), Amirkhalkhali and Mukhopadhyay (1993) and Bottazzi and Secchi (2003) for quoted US manufacturing firms (see also Evans (1987a, 1987b) for US manufacturing firms of a somewhat smaller size), Gabe and Kraybill (2002) for establishments in Ohio, and Goddard et al. (2002) for quoted Japanese manufacturing firms. Studies focusing on small businesses have also found a negative relationship between firm size and expected growth – see for example Yasuda (2005) for Japanese manufacturing firms, Calvo (2006) for Spanish manufacturing, McPherson (1996) for Southern African micro
5We should be aware, however, that ‘mean-reversion’ does not imply that firms are converging to anything
resembling a common steady-state size, even within narrowly-defined industries (see in particular the empirical work by Geroski et al. (2003) and Cefis et al. (2006)).
businesses, and Wagner (1992) and Almus and Nerlinger (2000) for German manufacturing. Dunne et al. (1989) analyse plant-level data (as opposed to firm-level data) and also observe that growth rates decline along size classes. Research into Gibrat’s law using data for specific sectors also finds that small firms grow relatively faster (see e.g. Barron et al. (1994) for New York credit unions, Weiss (1998) for Austrian farms, Liu et al. (1999) for Taiwanese electronics plants, and Bottazzi and Secchi (2005) for an analysis of the worldwide pharmaceutical sector). Indeed, there is a lot of evidence that a slight negative dependence of growth rate on size is present at various levels of industrial aggregation. Although most empirical investigations into Gibrat’s law consider only the manufacturing sector, some have focused on the services sector. The results, however, are often qualitatively similar – there appears to be a negative relationship between size and expected growth rate for services too (see Variyam and Kraybill (1992), Johnson et al. (1999)) Nevertheless, it should be mentioned that in some cases a weak version of Gibrat’s law cannot be convincingly rejected, since there appears to be no significant relationship between expected growth rate and size (see the analyses provided by Bottazzi et al. (2005) for French manufacturing firms, Droucopoulos (1983) for the world’s largest firms, Hardwick and Adams (2002) for UK Life Insurance companies, and Audretsch et al. (2004) for small-scale Dutch services). Notwithstanding these latter studies, however, we acknowledge that in most cases a negative relationship between firm size and growth is observed. Indeed, it is quite common for theoretically-minded authors to consider this to be a ‘stylised fact’ for the purposes of constructing and validating economic models (see for example Cooley and Quadrini (2001), Gomes (2001) and Clementi and Hopenhayn (2006)). Furthermore, John Sutton refers to this negative dependence of growth on size as a ‘statistical regularity’ in his revered survey of Gibrat’s law (Sutton, 1997: 46).
A number of researchers maintain that Gibrat’s law does hold for firms above a certain size threshold. This corresponds to acceptance of Gibrat’s law according to Mansfield’s third rendition, although ‘mean reversion’ leads us to reject Gibrat’s Law as described in Mansfield’s second rendition. Mowery (1983), for example, analyzes two samples of firms, one of which contains small firms while the other contains large firms. Gibrat’s law is seen to hold in the latter sample, whereas mean reversion is observed in the former. Hart and Oulton (1996) consider a large sample of UK firms and find that, whilst mean reversion is observed in the pooled data, a decomposition of the sample according to size classes reveals essentially no relation between size and growth for the larger firms. Lotti et al. (2003) follow a cohort of new Italian startups and find that, although smaller firms initially grow faster, it becomes more difficult to reject the independence of size and growth as time passes. Similarly, results reported by Becchetti and Trovato (2002) for Italian manufacturing firms, Geroski and Gugler (2004) for large European firms and Cefis et al. (2006) for the worldwide pharmaceutical industry also find that the growth of large firms is independent of their size, although including smaller
firms in the analysis introduces a dependence of growth on size. It is of interest to remark that Caves (1998) concludes his survey of industrial dynamics with the ‘substantive conclusion’ that Gibrat’s law holds for firms above a certain size threshold, whilst for smaller firms growth rates decrease with size.
Concern about econometric issues has often been raised. Sample selection bias, or ‘sample attrition’, is one of the main problems, because smaller firms have a higher probability of exit. Failure to account for the fact that exit hazards decrease with size may lead to underestimation of the regression coefficient (i.e. β). Hall (1987) was among the first to tackle the problem of sample selection, using a Tobit model. She concludes that selection bias does not seem to account for the negative relationship between size and growth. An alternative way of correcting for sample selection is by applying Heckman’s two-stage procedure. This is the methodology used by Harhoff et al. (1998), who also observe that selection bias has only a small influence on the Gibrat coefficient. In short, the “problem of sample selection does not seem to significantly affect the relationship between growth rate and size of firm” (Marsili, 2001: 15). The possibility of heteroskedasticity is also frequently mentioned, although it can be corrected for quite easily, for example by applying White’s (1980) procedure. In any case, heteroskedasticity does not introduce any asymptotic bias in the coefficient estimates. Serial correlation in growth rates can lead to biased estimates, although Chesher (1979) proposes a simple framework for dealing with this. Finally, Hall (1987) investigates whether ‘errors-in-variables’ may be influencing the regression results, but concludes that measurement error does not appear to be an important factor.
Firm size and growth rate variance
Hymer and Pashigian (1962) were among the first to draw attention to the negative relationship between growth rate variance and firm size. If firms can be seen as a collection of ‘components’ or ‘departments’, then the overall variance of the growth rate of the firm is a function of the growth rate variance of these individual departments. In many cases, the variance of the firm’s growth rate will decrease with firm size. For example, in the case there these departments (i) are of approximately equal size, such that the size of the firm is roughly proportional to the number of components; and (ii) have growth rates that are perfectly independent from each other, then Central Limit Theorem leads us to expect a decrease in growth rate variance that is proportional to the inverse square root of the firm’s size. However, Hymer and Pashigian (1962) were puzzled by the fact that the rate of decrease of growth rate variance with size was lower than the rate that would be observed if large firms were just aggregations of independent departments. At the same time, they found no evidence of economies of scale. They saw this as an anomaly in a world of risk-averse agents. Why would firms want to grow to a large size, if there are no economies of scale, and if the growth rate variance of a large firm is higher than
the corresponding variance of an equivalent group of smaller firms? Subsequent studies did not attempt to answer this question, but they did bear in mind the existence of a negative relationship between growth rate variance and firm size. As a consequence, empirical analyses of Gibrat’s law began to correct for heteroskedasticity in firm growth rates (e.g. Hall (1987), Evans (1987a,b), Dunne and Hughes (1994), Hart and Oulton (1996), Harhoff et al. (1998)).
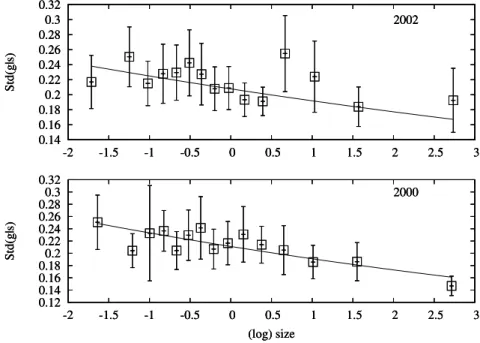
In recent years efforts have been made to quantify the scaling of the variance of growth rates with firm size. This scaling relationship can be summarized in terms of the following power law: σ(gi) ∼ eβsi; where σ(gi) is the standard deviation of the growth rate of firm i, β is a
coefficient to be estimated, and siis the size (total sales) of firm i. Values of β have consistently
been estimated as being around -0.2 for US manufacturing firms (Amaral et al. (1997, 1998), Bottazzi and Secchi (2004)) and also for firms in the worldwide pharmaceutical industry (Bottazzi et al. (2001), Matia et al. (2004), Bottazzi and Secchi (2006a)). Lee et al. (1998) find that a scaling exponent of -0.15 is able to describe the scaling of growth rate variance for both quoted US manufacturing firms and the GDP of countries. For French manufacturing firms, our analysis in Chapter 3 yields estimates of β of around -0.07, although in the case of Italian manufacturing firms Bottazzi et al. (2007) fail to find any relation between growth rate variability and size.
The discussion in Lee et al. (1998: 3277) gives us a better understanding of the values taken by β, the scaling exponent. If the growth rates of divisions of a large diversified firm are perfectly correlated, we should expect a value of β = 0. On the other hand, if a firm can be viewed as an amalgamation of perfectly independent subunits, we expect a value of β = -0.5. The fact that the estimated exponents are between these extreme values of 0 and -0.5 suggest that the constituent departments of a firm have growth patterns that are somewhat correlated.
Matia et al. (2004) and Bottazzi and Secchi (2006) return to the scaling-of-variance puzzle by considering firms as being composed of a certain number of products that correspond to independent submarkets.6 The average size of the submarkets increases with firm size, but
the growth rates are independent across submarkets. These authors provide support for their model by examining evidence from the worldwide pharmaceutical industry, where a firm’s portfolio of activities can be decomposed to a fine level of aggregation. As a result, “the explanation of the relationship between the variance of the growth rates distribution and the size of the firm based on the Central Limit Theorem is valid, as long as one considers the actual number of sub-markets a firm operates in, instead of assuming that this number is somehow proportional to the size of the firm” (Bottazzi and Secchi 2006: 860).
6Their model bears a certain similarity with the model in Amaral et al. (1998, 2001), who explain scaling
of variance in terms of firms being composed of independent ‘divisions’ in a diversified firm, rather than independent ‘submarkets’.