HAL Id: hal-03111555
https://hal.archives-ouvertes.fr/hal-03111555
Submitted on 15 Jan 2021
HAL is a multi-disciplinary open access
archive for the deposit and dissemination of
sci-entific research documents, whether they are
pub-lished or not. The documents may come from
teaching and research institutions in France or
abroad, or from public or private research centers.
L’archive ouverte pluridisciplinaire HAL, est
destinée au dépôt et à la diffusion de documents
scientifiques de niveau recherche, publiés ou non,
émanant des établissements d’enseignement et de
recherche français ou étrangers, des laboratoires
publics ou privés.
Combined XPS / TEM study of the chemical
composition and structure of the passive film formed on
additive manufactured 17-4PH stainless steel
Adrien Barroux, Thomas Duguet, Nadège Ducommun, Eric Nivet, Julien
Delgado, Lydia Laffont, Christine Blanc
To cite this version:
Adrien Barroux, Thomas Duguet, Nadège Ducommun, Eric Nivet, Julien Delgado, et al.. Combined
XPS / TEM study of the chemical composition and structure of the passive film formed on
addi-tive manufactured 17-4PH stainless steel. Surfaces and Interfaces, Elsevier, 2021, 22, pp.100874.
�10.1016/j.surfin.2020.100874�. �hal-03111555�
Any correspondence concerning this service should be sent
to the repository administrator:
tech-oatao@listes-diff.inp-toulouse.fr
This is an author’s version published in:
http://oatao.univ-toulouse.fr/27239
To cite this version: Barroux, Adrien and Duguet, Thomas and
Ducommun, Nadège and Nivet, Eric and Delgado, Julien and
Laffont, Lydia and Blanc, Christine Combined XPS / TEM study
of the chemical composition and structure of the passive film
formed on additive manufactured 17-4PH stainless steel. (2021)
Surfaces and Interfaces, 22. 100874. ISSN 2468-0230
Official URL
DOI :
https://doi.org/10.1016/j.surfin.2020.100874
Open Archive Toulouse Archive Ouverte
OATAO is an open access repository that collects the work of Toulouse
researchers and makes it freely available over the web where possible
Combined XPS / TEM study of the chemical composition and structure of
the passive film formed on additive manufactured 17-4PH stainless steel
Adrien Barroux
a,
h,
Thomas Duguet
\
Nadège Ducommun
h,
Eric Nivet
\
Julien Delgado
C,
Lydia Laffont
a
,
*
, Christine Blanc
a
a CIRIMAT, Université de Toulouse, CNRS, INP-ENSIACET, 4 allée Emile Monso, BP 44362, 31030 Toulouse cedex 4, France b CETIM, Pôle Matériaux Métalliques et Surfaces, 74 route de la Jonelière CS 50814, 44308 Nantes, France
c CETIM, Pôle Matériaux Métalliques et Surfaces, 52 Avenue Félix Louat CS 80067, 60304 Senlis, France
A B STRA CT Keywords: A. Stainless steel B. XPS B. STEM C. Passive films Laser Beam Melting
The structure and chemical composition of the passive film formed on 17-4PH martensitic stainless steel (MSS) manufactured by powder bed laser beam melting (LBM) were investigated combining XPS and TEM analyses, by comparison to a conventional l 7-4PH. The structure of the passive film was found similar for both MSSs, with, on the matrix, a duplex layer composed of Fe and Cr oxy-hydroxide followed by an intermediate layer enriched in metallic compounds. A particular Nb oxide film formed on the NbC precipitates merging to the surface for both MSSs. Significant differences in thickness and Cr distribution were observed between both MSSs.
1. Introduction
Precipitation hardening martensitic stainless steels (MSSs), such as 17-4PH MSS, arise from an incremental industrial steel development with the aim of combining good corrosion resistance and high me chanical properties. These properties enable 17-4PH MSS to be used in numerous industrial applications such as nuclear power plants, aircraft components, or biomedical tools. They are provided by appropriate thermal treatments, i.e. a solution annealing heat treatment which ho mogenises the chemical element content, followed by an ageing heat treatment which allows the precipitation of secondary hardening pha ses. In the case of 17-4PH MSS, the ageing treatment generates the nanoscale precipitation of fine copper-rich precipitates, the nucleation and growth of niobium carbides (NbCs) precipitates and the reversion of secondary austenitic phase [1-5]. Those microstructure evolutions are controlled by the temperature and the duration of the ageing treatment, which allow the alloy to reach the required mechanical properties. In this way, the mastery of the microstructure and subsequent in-service properties give 17-4PH MSS a great versatility with a large field of applications.
17-4PH is a good candidate for additive manufacturing and partic ularly laser beam melting (LBM) process with the aim of extending the industrial applications of this material. The benefits of LBM are numerous: layer-by-layer build-up of 3D structures with new
* Corresponding author.
E-mail address: lydia.laffont@ensiacet.fr (L. Laffont).
manufacturing and geometry possibilities. But, several recent studies have been focused on the relationship between the microstructure, the manufacturing parameters, the mechanical properties and the post thermal treatment of LBM 17-4PH MSS [6-11]. Results showed specific properties and complex mechanical tensile response depending on the loading direction for the final LBM parts as compared to the conven tional 17-4PH MSS, associated with a peculiar LBM microstructure. Moreover, the final microstructure, the mechanical and corrosion properties of the LBM parts were found to depend significantly on the LBM parameters. Indeed, many studies highlighted the effect of the scan strategy used to melt the powder bed and the energy density brought by the laser as the main origins of the microstructure and manufacturing defects (e.g. gas pores, lack-of-fusion pores, oxide inclusions) [9,12-15]. The chemical composition and the microstructure of the initial powder grains also strongly influence the properties of the final parts [16,17]. Murr et al. demonstrated that 17-4PH parts fabricated with either argon or nitrogen-atomised powder under argon protective gas are mainly composed of martensitic phase, whereas those fabricated with nitrogen-atomised powder under nitrogen gas are mainly composed of austenite [17]. In addition, Meredith et al. showed that phase equilib rium changed with the gas used (during both powder atomisation and manufacturing) inducing chemical enrichment or depletion in some alloying elements [18]. For example, a nitrogen enrichment could be observed in both the powder and the final part leading to a stabilisation
of the austenitic phase by lowering the martensitic start temperature (Ms) [3,8, 18].
Conceming the corrosion behaviour of the LBM 17-4PH and the 15-5PH MSSs, there are only a few works in the literature [19,20]. But more numerous data can be found concerning austenitic stainless steel like 316L; for example Tobar et al. pointed out the importance of initial powder quality on the corrosion behaviour, and in particular the detri mental effect of secondary alloying elements such as Mn [21]. Chao et al. showed an increase in pitting corrosion resistance for LBM 316L stain less steel as compared to a conventional material [22]. The more posi tive pitting potential values were attributed to smaller MnS inclusions present in the LBM MSS than in the conventional counterpart. In addi tion, data from the literature proposed a relationship between typical manufactured defects generated by the LBM process and the corrosion behaviour of LBM parts. For a 316L austenitic stainless steel too, Laleh et al. showed that Jack-of-fusion pores - which are already detrimental to mechanical properties such as the fatigue lifetime - are also detri mental to the corrosion resistance [23]. They also demonstrated that Si-rich oxide inclusions could drastically reduce the pitting corrosion resistance depending on their size and shape, and could also act as preferential pit initiation sites [24].
Finally, this brief literature review shows that LBM process and the post thermal treatment generate different microstructures which can lead to different corrosion behaviour. Indeed, it is well-known for various conventional stainless steels that changes in the microstructure can induce different corrosion mechanisms and can influence the sus ceptibility to pitting corrosion and/or intergranular corrosion for example [25-29]. Moreover, the pitting corrosion resistance of metallic materials is controlled by a passive film generally described as a thin oxide layer covering the alloy [27,30]. Numerous breakdown models were proposed to explain the formation, the steady state and the breakdown of passive films. The mechanisms of the passivity breakdown were thoroughly studied by Macdonald for many years with the devel opment of the Point Defect Mode! (PDM) [31-34]. Others, such as Marcus et al. proposed a more complex mode! of pitting corrosion initiation based on atomic force microscopy (AFM) observations of a nanoscale passive film on nickel [35]. Although there is no consensus, the passivity breakdown seems linked to local passive film defects (grain boundaries, vacancies), but also to the structure and the chemical composition of the passive film and those of the alloy underneath [30, 36,37]. The structure and the chemical composition of passive films were analysed for austenitic stainless steels by auger emission spec troscopy (AES), X-ray photoelectron spectroscopy (XPS), time-of-flight secondary ion mass spectrometry (TOF-SIMS) or transmission electron microscopy (TEM) [38-43]. The passive film was described as a nano scale bilayer of Crm and Fem oxide / hydroxide with the presence of secondary alloying elements depending on the stainless steels. However, we suggest that the particular LBM microstructures could lead to dif ferences in passive film structure and chemistry and therefore in the pitting corrosion resistance by comparison to the conventional counterpart.
We showed, in a previous study on the corrosion behaviour of 17-4PH MSS manufactured by LBM, significant differences in the pitting susceptibility between LBM and conventional samples in NaCI solution [44]. A more positive pitting potential value was observed for the 17-4PH LBM MSS; this was attributed, at least partially, to smaller NbC precipitates, which acted as preferential pit initiation sites, in agreement with Clark et al. [ 45]. Results also showed that Jack-of-fusion pores were preferential pit initiation sites, but they did not have a detrimental in fluence on the pitting corrosion resistance of the LBM MSS due to their very low amount in the samples. Moreover, the influence of small gas pores was assumed to be negligible. However, a greater susceptibility to metastable pitting was observed for the LBM MSS as compared to the conventional samples. Results suggested differences in the properties of the passive films formed on LBM and conventional steels. But the rela tionship between the alloy microstructure, the features of the passive
film and the corrosion behaviour was out of the scope of this study, Thus, in the present work, a combination of TEM and XPS analyses was per formed to study the passive film formed on LBM 17-4PH MSS after exposure to a NaCI solution by comparison to the passive film formed on the conventional counterpart. Attention was paid to the chemical composition, structure and thickness of the passive film, with specific attention to the passive film formed on NbC precipitates, considering the significant influence of these precipitates on the pitting corrosion resistance. The electrochemical response of the passive films was out of the scope of this study, and will be the topics of a forthcoming study. The results concerning the passive film structure and chemical composition were analysed by considering the microstructure of the alloys under neath and by referring to their pitting behaviour.
2. Experimental procedure 2.1. Sample preparation
17-4PH MSS parts were additively manufactured by LBM process using an EOS M290 machine equipped with a 400 W laser under argon atmosphere. Cubic LBM samples were built from 17-4PH Erasteel powder (average diameter of 33 µm) on a building plate maintained at 200 °C with 40 µm of bed powder thickness. The orientation of each sample on the building plate was identified, considering the three characteristic planes of the cubic samples, with XY that corresponded to the building plate plane and Z to the building direction. For brevity reasons, most of the results were given for XY sample; however, when needed, results for XZ and YZ planes were also reported. A 50-mm wrought cylinder of 17-4PH MSS processed by conventional metal lurgy was used as reference (Bëihler Edelstahl). Chemical compositions of both MSSs determined by spark optical emission spectroscopy are shown in Table 1. Slight differences are noticed between the LBM and conventional samples, especially for the Si content, which is twice higher for the LBM samples; a quite similar Cr content and same Nb content were also observed. Conventional and LBM MSSs were heat treated following the ASTM A564 standard for conventional 17-4PH MSS. The heat treatment is composed of a solution annealing treat ment at 1040 °C for 30 min followed by air quenching; then the samples were aged at 480 °C for 1 h and air quenched, which corresponds to H900 standardised ageing.
The microstructures of conventional and LBM MSSs have been described in details in a previous article [ 44]. Only the main results are reminded here in order to help in understanding the analyses of the passive films below. The LBM MSSs have a finer microstructure char acterised by finer martensite laths (width of 50 800 nm, and 700 nm -2.5 µm for the LBM and conventional MSSs, respectively) and finer NbCs precipitates. The amount of austenite was between 8 and 12 % for LBM MSSs, depending on the planes, whereas it was only 0.8 % for the con ventional MSS. Finally, LBM MSSs contained coarser Cu-rich pre cipitates than the wrought MSS.
For electrochemical experiments, coupons of ca.1 cm2 surface area
exposed to the electrolyte were eut in the core of the sample, for both LBM and conventional samples. The coupon surfaces were then polished with SiC paper down to grade 2400 and mirror-finished with 6 µm, 3 µm and 1 µm diamond paste; then, they were rinsed with deionised water and dried under hot air flow. An electric wire was stuck on the back of the coupons with silver conductive adhesive paste and isolated with silicone seal for electric connection. Then, the coupons were immersed for 1 h in 0.5 M NaCI solution so that they reached quasi steady state conditions. This allowed the corrosion potential value (Ecorr) to be measured; samples were then polarised at + 150 m V /Ecorr for 30 min to make the passive films grow on their surface. The coupons were finally rinsed with deionised water, sonicated in acetone and ethanol and dried under air flow.
Table 1
Chemical composition of the 17-4PH samples used in this study. Elementwto/o
ASTMA654
wrought cylinder (conventional) LBM parts Cr 15.0 -17.0 15.42 16.20 Ni 3.0 -5.0 4.49 4.08 Cu 3.0-5.0 3.24 3.56 C <:: 0.07 0.036 0.028 Nb 0.15 -0.45 0.26 0.27 Si <:: 1 0.35 0.71 Mo 0.15 < 0,02 N 0.030 0.035 s <:: 0.030 <:: 0.005 <:: 0.005 p <:: 0.040 0.016 0.007 Fe bal. bal. bal. Chemical composition of the 17-4PH samples used in this study compared to the ASTM A564 standard.
2.2. XPS analyses
XPS analyses were carried out on a Thermo Kalpha apparatus, equipped with a monochromatised Al-Kcx source (hv = 1486.6 eV). The X-ray spot surface area was approximately 400 µrn in diameter. Ali photoelectron spectra were analysed with built-in Avantage software (Thermo). A Shirley background was systematically subtracted. Survey spectra and high-resolution spectra were recorded with a 150 eV and a 30 eV pass energy, respectively. Depth profiles were performed upon Ar+ etching on high-resolution Fe 2p, Cr 2p, Nb 3d and O ls spectra. A
pass energy of 60 eV was found to be the best compromise between resolution and time for the acquisition of the profiles. Metallic Fe, Fe2O3
oxide, metallic Cr and Cr2O3 chromine reference samples were used to
decompose Fe and Cr spectra. A 30/70 Lorentzian/Gaussian ratio was used to fit ail peaks, occasionally including asymmetry parameters for metallic components.
2.3. TEM analyses
Cross-section thin foils of the passive film were prepared using a FEI dual beam HELIOS nanolab 600i at UMS Castaing (Toulouse, FR). A protective carbon layer was deposited with FIB-SEM before cutting the TEM samples to avoid scaling of the oxide layers. TEM and scanning TEM (STEM) imaging was performed on a JEOL cold-FEG JEM ARM200F operated at 200 kV equipped with a Cs corrector probe of 0.78 Â spatial resolution. Characterisations of the passive films were done using the bright field (BF) and the high-angle annular dark field (HAADF) STEM modes. Energy dispersive X-ray spectroscopy (EDS) was used to analyse the evolution of the chemical composition across the passive film-alloy interface. EDS qualitative maps and line scans of the sample were acquired with a JEOL CENTURIO SDD detector.
3. Results and discussion
3.1. Global approach of the structure and chemical composition of the passive films
Cross-sectional views of the passive films observed by TEM bright field imaging for the conventional and the LBM (plane XY parallel to the building plate) 17-4PH MSS samples thermally treated in the H900 condition are shown in Fig. 1. As indicated in the experimental part, the passive film is formed during exposure to a 0.5 M NaCI solution under potentiostatic polarisation at +150 mVIEcorr on polished surfaces. A protective carbon layer was deposited with FIB-SEM before cutting the TEM samples to avoid scaling of the oxide layers. The passive films were found homogenous in thickness and amorphous (Jack of order at atomic level); they covered the whole surface for both analysed samples. In a first global approach, the thickness of the passive films was estimated to be around 3 nm for both samples as expected for stainless steels. These observations are in good agreement with the Oh et al.'s TEM study ofthe passive film formed on a Fe-20Cr-10Ni stainless steel [42] and Yue et al.'s study on a 3161 SS [46].
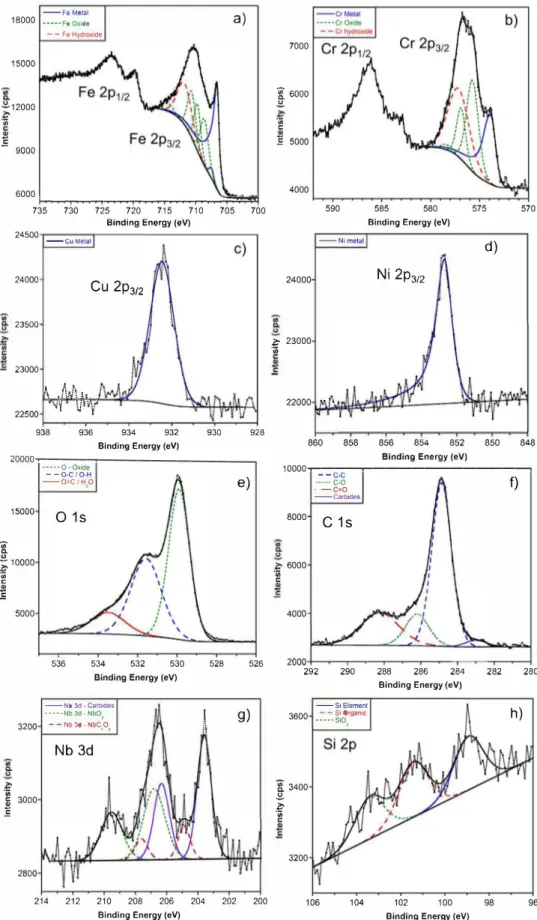
To complete TEM imaging with data concerning the chemical composition of the passive film, XPS analyses were performed on the passive films formed on the 17-4PH MSSs. Figs. 2 and 3 compiled the high-resolution surface spectra of Fe 2p, Cr 2p, Cu 2p3;2, Ni 2p3;2, 0 ls,
C ls, Nb 3d and Si 2p recorded on conventional and LBM XY samples, respectively. In addition, parameters used to fit the XPS spectra for conventional and LBM XY samples are given in Table 2. For comparison purpose and to complement literature data, results obtained for LBM XZ and YZ samples are also reported in Table 2. The Fe 2p312 and Cr 2p312
core levels were decomposed for the conventional (Fig. 2a and b) and the LBM XY (Fig. 3a and b) samples. The spectra for both the conven tional and the LBM (ail planes) MSSs are composed of a broad oxide/ hydroxide peak coupled with metal peak, suggesting that the passive films are mainly composed of thin Fe and Cr oxide layer. Indeed, Bie singer et al. studied various transition metallic, oxide and hydroxide components by XPS (e.g. Fe, Cr, Ni or Cu), and demonstrated that the broad shape for Fe and Cr oxides results from multiplet splitting of the
735 730 725 720 715 710 705 700 Binding Energy (eV)
29000�---�---28000 � 27000
"'
C 26000 -CuMetal c) Cu 2p312''t ...•
,i� ...
,f, 250001---.---··�•-·_·�·-·---l
938 936 ---0 -Oxides - -O-C/0-H 20000 -C=OtHp 15000..
.!:!, :, ·;;; li; 10000 5000 0 1s 934 932Binding Energy (eV)
536 534 532 530
Binding Energy (eV) -NbCarbides ---Nb02 3200 - -NbC,01 .ii' 3100 Nb 3d :, ·;;; C 3000 .'!i .5 2900
J
1\ I 2800� Vï
'
214 212 210 208 206 Binding Energy (eV)930 928 e) 528 526
!
g)n
yu;vt
204 202 200 12000 .---.---� -CrMetar •••••• Cr(III) Oxide - -Cr(lll) Hydroxide 10000 .!:!, 8000 :, ïii C 6000 24000 :, 23000 ïii C .'!i .5 590 -Nimetal, l ,\
22000 �� 1 \, l "ii L-. i i 860 858 585 580Binding Energy (eV)
856 854 852 Binding Energy (eV)
b) 575 570 d) 850 848 10000�---� --C-C ---C-0 · -C•O -Carbides 8000
c
1s.f
6000 C .'!i .5..
C. .!:!,�"'
.5 4000 2000 292 290 4200 -SiElement - -Si Organic ---Si02 4000 3800 3600 104 f) 288 286 284 282 280Binding Energy (eV)
h)
102 100 98 96
Binding Energy (eV)
Fig. 2. High-resolution spectra of Fe 2p, Cr 2p, Cu 2p, Ni 2p, 0 1s, C 1s, Nb 3d and Si 2p with their fitted components contribution for conventional sample.
core levels due to the interaction of the photoelectrons with the unpaired outer shell electron [47,48]. In this respect, Fe 2p312 peaks were fitted with two metallic split components (�Emetal = 0.9 eV), four oxides multiplets and one broad hydroxide component (Table 2). This complex multiplet splitting structure could not allow the distinction between Fe11 and Fem oxide species. A similar peak fitting was used for Cr 2p
312 with
one metallic, three oxides and one broad hydroxide components for ail four samples. The binding energy (BE) Cr 2p312 values (between 575 and 578 eV) for oxide and hydroxide peaks correspond to Crrn components
and were attributed to Cr203 and Cr(OH)3 species. As said previously for Fe oxide components, the determination of the oxide/hydroxide pro portion could not be made because of the multiple overlap between
18000 15000 .!!.12000 l:-'iii 2 E 9000 -Fe Mela! ---Fe 01dde
a)
--Fe Hydroxide 6000 h-�������������,.:;::;z:::� 735 730 725 720 715 710 705 700Binding Energy (eV)
24500 -CuMetal 24000
Cu 2p312
23500 23000 1,t\/,
!1 l' 22500 '✓y VH:( 938 936 934 932 930 928Binding Energy (eV)
20000�---�---� 15000 .;; Q. ;: 10000
·"'
"' C 2 E l:-·;;; C.,
Ë 5000 3200 3000 2800 ---0-Oxide --0-C/O-H -Oi.CIHPe)
0 1s
536 534 532 530 528 526 Blndlng Energy (eV) -Nb 3d • CarbiOes ---Nb 3d -Nb02l
g)
--Nb 3d -NbC,Oy !\Nb 3d
7000 [ 6000 .!!. ·;;; C Ë 5000 4000 24000 l:- 23000 ·;;; 22000 590 -Nimetal�-
f·-860 858 585 580 575 570Binding Energy (eV)
d)
Ni 2p
312 856 854 852 850 848 Blndlng Energy (eV) 10000..---,---, 8000 � 6000 ·;;; C 4000 2000 - -e-c -··· C-0 --C=O -CarbidesC 1s
292 290 -SiElemenl 3600 - -SiOrgamc ---s102i
3400 .!!. l:-·;;; C 3200f)
288 286 284 282 280Binding Energy (eV)
h)
214 212 210 208 206 204 202 200 106 104 102 100 98 96
Binding Energy (eV) Blndlng Energy (eV)
Fig. 3. High-resolution spectra of Fe 2p, Cr 2p, Cu 2p, Ni 2p, 0 1s, C 1s, Nb 3d and Si 2p with their fitted components contribution for LBM XY sample.
oxide and hydroxide peaks in a short BE range (Le. from 706 to 712 eV and from 573 to 578 eV for Fe 2p312 and Cr 2p312, respectively). This interpretation of Fe 2p3;2 and Cr 2p3;2 spectra is simplified in order to avoid misinterpretation but still retains relevant information. The
high-resolution spectra of Cu 2p312 and Ni 2p312 for the conventional (Fig. 2c and d) and the LBM XY (Fig. 3c and d) samples include only one asymmetric peak for each element with a BE value around 852.2 eV for Ni and 932.5 eV for Cu, which are therefore metallic. Similar results
Table 2
Binding energy, full with at half maximum (FWHM) and relative area of the assign peaks used to analyse XPS high-resolution spectra on conventional and LBM MSSs after anodic potentiostatic polarisation in 0.5 M chloride solution.
conventional LBMXY LBMXZ LBMYZ
Core Assignment BE FWHM Relative BE FWHM Relative BE FWHM Relative BE FWHM Relative level (eV) (eV) area (eV) (eV) area (eV) (eV) area (eV) (eV) area Fe Fe metal 706.6 0.8 1.00 706.6 0.8 1.00 706.6 0.8 1.00 706.6 0.8 1.00 2p31 Fe metal (6.Emetal 707.5 0.8 0.04 707.5 0.8 0.04 707.5 0.8 0.06 707.5 0.8 0.04
= 0.9 eV) Fe oxide peak 1 708.6 1.6 0.21 708.6 1.6 0.37 708.6 1.6 0.37 708.6 1.6 0.26 Fe oxide peak 2 709.7 1.4 0.20 709.7 1.3 0.30 709.8 1.5 0.46 709.8 1.5 0.33 Fe oxide peak 3 710.6 1.6 0.21 710.6 1.6 0.37 710.8 1.6 0.32 710.9 1.6 0.25 Fe oxide peak 4 714.5 2.0 0.05 714.4 2.0 0.08 714.5 2.0 0.08 714.5 2.0 0.05 Fe hydroxide 711.8 2.8 0.40 711.8 2.8 0.58 712.0 2.8 0.55 712.0 2.8 0.42 Cr Cr metal 573.9 1.2 0.53 573.9 1.2 0.74 574.0 1.2 0.48 573.9 1.2 0.63 2p3; Crm oxide peak 1 575.8 1.5 0.66 575.7 1.5 0.75 575.7 1.6 0.92 575.8 1.5 0.68 Crm oxide peak 2 576.9 1.3 0.28 576.9 1.1 0.32 576.9 1.3 0.32 576.9 1.4 0.38 Crm oxide peak 3 579.0 1.1 0.03 578.4 1.1 0.03 578.9 1.1 0.03 578.8 1.6 0.05 Crm hydroxide 577.2 2.6 1.00 577.2 2.6 1.00 577.2 2.7 1.00 577.2 2.8 1.00 Nb 3d Nb carbides (5/2) 203.6 1.0 1.00 203.6 1.1 1.00 203.6 0.9 1.00 203.6 1.0 0.95 Nb carbides (3/2) 206.3 1.1 0.67 206.3 1.2 0.67 206.3 1.0 0.67 206.3 1.1 0.64 NbCxOy (5/2) 204.8 0.9 0.15 204.9 0.9 0.23 204.9 1.3 0.43 204.9 1.5 0.37 NbCxOy (3/2) 207.5 0.9 0.10 207.6 1.0 0.15 207.6 1.3 0.29 207.7 1.6 0.24 NbIV 0 2 (5/2) 206.9 2.0 0.83 206.8 1.7 0.86 206.7 1.3 0.80 206.9 1.4 1.00 NbIV 0 2 (3/2) 209.6 1.9 0.56 209.5 1.7 0.58 209.4 1.2 0.54 209.6 1.4 0.67 0 ls Meta! oxides 529.9 1.4 1.00 529.9 1.3 1.00 529.9 1.3 1.00 529.8 1.4 1.00 0-H (hydroxides) 531.5 1.8 0.72 531.4 1.9 0.74 531.5 1.9 0.67 531.3 1.9 0.83 / C-0 H20 / C02 / Si02 533.0 2.0 0.16 533.8 2.1 0.23 532.9 2.1 0.13 532.6 2.1 0.46 Ni Ni metal 852.7 1.1 1.00 852.8 1.1 1.00 852.7 1.1 1.00 852.8 1.1 1.00 2p3; 2 Cu Cu metal 932.4 1.3 1.00 932.5 1.4 1.00 932.5 1.3 1.00 932.4 1.2 1.00 2p31 2 Si 2p Si element 98.9 1.2 0.51 99.1 1.2 0.82 99.0 1.2 0.58 99.0 1.1 0.43 Si organic 101.7 1.5 1.00 101.7 1.5 1.00 101.8 1.5 1.00 101.8 1.5 1.00 SiIV0 2 103.6 1.6 0.19 103.4 1.6 0.76 103.4 1.4 0.27 103.4 1.5 0.75 C ls CNiobium 282.9 1.2 0.05 283.0 1.3 0.04 283.1 1.3 0.04 283.0 1.3 0.04 carbides C-C (adventitious) 284.9 1.3 1.00 284.9 1.3 1.00 284.8 1.3 1.00 284.9 1.4 1.00 C-0 286.3 1.6 0.24 286.2 1.7 0.29 286.4 1.7 0.20 285.4 1.7 0.26 C=O 288.4 1.8 0.23 288.3 1.8 0.29 288.5 1.8 0.19 287.9 1.8 0.16 Binding energy, full with at half maximum (FWHM) and relative area of the assign peaks used to analyse XPS high-resolution spectra on conventional and LBM MSSs after anodic potentiostatic polarisation in 0.5M chloride solution.
were obtained for LBM XZ and YZ samples (Table 2). The metallic state for Cu 2p312 is confirmed using the modified Auger parameters a'. The
formula is given by the Eq. (1), which result allows cu0
, Cu1 and Cu11 to be clearly distinguished [49]:
a•
=
KE( CuLMM)+
BE ( Cu2p3;2) (1)where IΠ(Cu LMM) corresponds to the kinetic energy of the Auger LMM transition and BE (Cu 2p312) corresponds to the binding energy of the Cu
2p312 peak. Thereby, for the conventional and ail the three LBM samples,
a' exhibits a mean value of 1851.5 eV, i.e. Cu is metallic (Cu0
) [47,49]. Then, the O ls spectrum for conventional (Fig. 2e) and LBM XY (Fig. 3e) is decomposed in three peaks with numerous contributions. A first peak at low BE value around 529.9 eV corresponding to metal oxides (02-), a second peak around 531.4 eV corresponding to metal hydroxides (OH-) and organic ketone (C-O bond), and finally a broad peak at higher BE value corresponding to adsorbed water, carbon dioxides (C=O bond) and Si 02. Organic ketone, carbon dioxide and adsorbed water peaks are
associated with organic contamination due to preparation, electro chemical tests ( use of silicone seal) and acetone/ ethanol cleaning. Organic contamination is also present on C ls spectra on both conven tional and LBM MSS samples (Figs. 2f and 3f, respectively) with three characteristic peaks attributed to C-C bonds (BE around 284.9 eV), C-O bonds (BE around 286.3 eV) and C=O bonds (BE around 288.3 eV). A fourth peak at lower BE value is attributed to C-Nb bond (around 283.0 eV) arising from NbC precipitates inside the MSSs for both conventional
and LBM XY samples (same results for XZ and YZ samples). The NbC precipitates contribution is found again on the Nb 3d spectra (Figs. 2g and 3g) convoluted with other Nb oxide species due to spin-orbit split ting (�ENb 3d � 2.7 eV) [50]. Gupta et al. demonstrated that NbC compounds present complex oxide layers at different oxidation degrees in the case of NbC nanocomposites [51]. Based on this work, the Nb 3d spectra were decomposed in three components (six peaks for 3d512 and
3d3;2) corresponding respectively to NbC precipitates at lower BE
values, a mixture of carbide-oxide NbCxOy and Nb 1v
02 oxide at higher
BE values for all samples studied. This could suggest that NbC pre cipitates are oxidised in stable Nbrv state during the passive film for mation with a transition NbCxOy layer between the NbC precipitates and
the Nb1v
O2 stable oxide. Finally, the Si 2p high-resolution spectra
(Figs. 2h and 3h) were decomposed in three simple components because of the low spin-orbit coupling energy difference (�Es; 2p � 0.6 eV). The
peak at lower BE value (around 99.0 eV) is assigned to Si element dis solved in the martensitic matrix, the second peak corresponds to Si organic contamination due to silicon seal (around 101.8 eV) and the last peak (around 103.4 eV) corresponds to Si1v
and was attributed to SiO2.
Nevertheless, it could be noticed a non-negligible contribution of the SiO2 for the LBM XY samples on Si 2p high-resolution spectra (Fig. 3h)
and for LBM XZ and YZ samples (Table 2), whereas there is almost no contribution of SiO2 peak for the conventional one. This SiO2 is assumed
to correspond to Si-rich oxide inclusions formed during the LBM process between two lased layers as described in previous work [9,44,52]. Therefore, the presence of SiO2 on the Si 2p spectra arises from the
underlying alloy only for LBM samples and is not part of the passive film. Chemical quantification of the different alloying elements was per formed from the high-resolution XPS spectra peak fitting. The infor mation depth included both the passive layer and the alloy underneath. The result of the elemental quantification is given in Table 3 in atomic percent for conventional and ail three LBM samples. The presence of organic contamination on the passive film surface can be shown with the high carbon content and slightly higher content for Si as compared to the nominal composition of the alloy (Table 1). For ail samples, the oxygen concentration is greater than 40 at. %, indicating that most of the XPS signal arises from the passive film. Fe and Cr are the main oxide com ponents and have a moderate concentration which is lower than the nominal alloy composition due to high C and O content. Nevertheless, the Cr content is significantly higher for the conventional sample (8 at.
%) than for the LBM samples (5 at. % whatever the LBM plane). The calculation of the relative Cr/Fe ratio gives 0.59 for the conventional sample against 0.37, 0.36 and 0.46 for the LBM XY, XZ and YZ, respectively, which confirms that the passive film formed on the con ventional sample contains more Cr than the LBM ones. The Cr/Fe ratios were found very low ( <1) as compared to what could be obtained from study on austenitic stainless steel, probably due to the lower Cr content in the nominal 17-4PH composition [39-41]. The differences in Cr content for the passive films formed on LBM and conventional MSSs could be explained by referring to the austenite content of the samples. Indeed, we showed in a previous study [ 44] that the austenite content was between 8 and 12 % and only 0.8 % for the LBM and conventional samples, respectively. Langberg et al. [53] recently showed, for a super duplex stainless steel, that the passive film formed on ferrite had a higher Cr content than this one formed on austenite due to the higher Cr content in ferrite. In the present study, similar differences in Cr content were likely to exist between martensite and austenite, with higher Cr content in martensite, due to the fact that most part of the austenite was reversed austenite. Therefore, it was assumed here that the lower martensite to austenite ratio for LBM MSSs could contribute to explain the lower Cr content in the passive films formed on these samples. As expected, quantification of Cu and Ni exhibits poor values (:Sl ato/o) with a slightly higher content for the conventional sample. It could also be noticed that Nb content is quite similar to the nominal composition of the l 7-4PH due to the presence of Nb oxide in the passive film.
In summary, first TEM observations (Fig. 1) showed that the thick nesses of the passive films formed in NaCI solution on the conventional and LBM MSSs samples were similar: the oxide layers were thin (-3 nm) and amorphous. XPS analyses showed that passive films were composed of a mixture of Fe and Ct'11 oxy/hydroxide, with the presence of Nb oxides in small amount. However, the chemical composition of the passive films differed between the conventional and the LBM MSSs samples, especially for the Cr content which was higher for the con ventional MSS probably due to its lower content in reversed austenite. Concerning the different planes of the LBM parts, no significant differ ences were observed. Nevertheless, studies from the literature often described the passive films formed on stainless steels as duplex layers, i. e. composed of an inner and an outer layer with different chemical
Table 3
compositions [39,41,54]. Hence, in order to obtain additional data on the passive films, their chemical composition and structure were then studied with XPS depth profiles and STEM-EDS analyses at the nano metre scale.
3.2. Analysis of the structure and chemical composition of the passive films at the nanometre scale
In order to provide a better insight into the structure and chemical composition of the passive films formed on both MSSs, STEM-EDS an alyses and XPS depth profiles were combined. Fig. 4 shows STEM bright field (BF) imaging at nanometre scale of the passive films formed on the conventional (4a) and LBM XY (4b) 17-4PH MSSs. Such analyses were performed only for the LBM XY sample and not for the other LBM planes considering the complexity of the STEM technique and taking into ac count similar XPS results. EDS analyses performed in zones marked by the white boxes in Fig. 4 (area of 2.3 x 0.75 nm2) gave access to the
chemical quantification of the different layers constitutive of the passive films. Here, it is of major importance to note that each box is assumed to correspond to specific regions of the passive film and/or the alloy un derneath; however some Jack of accuracy on the location of the EDS zones could not be neglected with respect to the complexity of the technique. Moreover, the EDS quantification constitutes a mean analysis on the whole zone of the studied boxes, hence improving the signal-to noise ratio. Boxes were numbered from 1 to 4 in Fig. 4. For the con ventional alloy, the boxes 1 and 2 were assumed to correspond to the passive film at different depths from the external surface i.e. in the outer and inner layer, respectively; the third and fourth boxes were attributed to the alloy. The fourth zone was considered as reference as it was located in the bulk of the alloy. For the LBM XY sample, boxes 1 to 4 were attributed to the outer layer, the inner layer, the intermediate layer and the bulk alloy, respectively. The intermediate layer was defined as the interface between the passive film and the alloy. For the conven tional sample, this contribution was not detected due to the location of the boxes and the small thickness of the intermediate layer. Results from EDS analyses are given in Table 4. Due to the amorphous nature of the passive films, the results of the EDS analyses were considered with comparison purpose only. The first EDS analyses took into account the oxygen signal. For both MSSs, the oxygen content was maximum in boxes 1 and 2 corresponding to the passive film, then decreased in the box 3 and finally dropped down to zero in box 4, i.e. in the bulk alloy. Concerning the alloying elements, increasing values of Cr, Ni and Cu from boxes 1 to 2 for both samples confirmed the presence of a duplex oxide layer. Both the inner and outer layers were mainly composed of Cr and Fe oxide species for both samples, but the outer layer was Jess concentrated in Cr as compared to the inner layer. Such a distribution of the alloying elements had already been described by Wang et al. who showed that the passive film formed on 316L stainless steel was constituted of an inner Cr-enriched barrier layer [41]. A second EDS quantification was then performed without taking into account the ox ygen signal: in this case, the oxygen peak was only used for the decon volution of the energy peaks. This procedure allowed to highlight the
XPS chemical quantification and thickness of the passive film formed in 0.5 M chloride solution under anodic potentiostatic polarisation and the underlying 17-4PH alloy for different samples. It can be noticed a high carbon concentration due to adventitious carbon. The oxide film thickness calculation is based on the ratio Ometflox)
for Fe and Cr (metal and oxide) references and a Cr/Fe repartition of 20/80.
Element ato/o Fe (2p) Cr (2p) 0 (1s) Ni (2p) Cu (2p) Nb (3d) Si (2p) C (1s) Film thickness (nm)
conventional 14.1 8.3 43.0 0.8 1.1 0.6 0.8 31.3 3.9
LBMXY 13.4 5.0 41.4 0.5 0.5 0.4 1.6 37.2 4.4
LBMXZ 15.4 5.5 42.5 0.7 0.7 0.4 1.5 33.4 4.6
LBMYZ 10.3 4.7 40.1 0.4 0.6 0.4 1.7 41.8 4.1
XPS chemical quantification and thickness of the passive film formed in 0.SM chloride solution under anodic potentiostatic polarisation and the underlying 17-4PH alloy for different samples. It can be noticed a high carbon concentration due to adventitious carbon. The oxide film thickness calculation is based on the ratio Ometflox)
Alloy
h\
1
,
li'":'l�t_- �����
.. ·-··
Z,t-w
.
,... '_,,.
� ·
-- . C coating · Passive filmAlloy
Fig. 4. STEM bright field images of the passive film formed on the conventional (a) and LBM XY (b) MSS in 0.5 M Na Cl solution. White rectangles correspond to EDS analysis area (quantification are displayed in Table 4).
Table 4
EDS quantification corresponding to the EDS analysis boxes performed on conventional and LBM XY samples based on the STEM bright field imaging of Fig. 4. Quantification without taking into account the O was made in order to better follow the variation of alloying element composition between each boxes.
Composition (at. %) Quantification with 0 Quantification without 0 Interpretation
Boxes 0 Fe Cr Ni Cu Si Fe Cr Ni Cu Si
conventional 1 48.9 43.1 5.2 0.4 0.5 1.9 84.4 10.1 0.9 1.0 3.6 outer layer
(Fig. 4a) 2 39.6 41.0 12.1 3.2 3.0 1.1 68.0 20.0 5.4 4.9 1.8 Inner / intermediate layer
3 7.7 69.6 15.2 4.2 2.6 0.7 75.4 16.1 4.5 2.9 0.8 alloy
4 1.5 74.6 15.5 4.6 3.0 0.9 75.8 15.7 4.6 3.0 0.9 alloy
LBMXY 1 43.9 49.2 6.1 0.0 0.3 0.6 87.6 10.8 0.1 0.5 1.0 outer layer
(Fig. 4b) 2 42.8 43.5 9.6 1.2 1.5 1.4 76.1 16.7 2.1 2.6 2.5 inner layer
3 18.2 56.5 14.6 4.3 4.7 1.7 69.1 17.9 5.2 5.7 2.1 interface layer
4 0.0 75.0 16.2 4.2 3.6 1.0 75.0 16.2 4.2 3.6 1.0 alloy
EDS quantification corresponding to the EDS analysis boxes performed on conventional and LBM XY samples based on the STEM bright field imaging of Fig. 4. Quantification without taking into account the O was made in order to better follow the variation of alloying element composition between each boxes.
relative variation of the secondary alloying elements. Results thus showed that Cr, Ni and Cu atomic contents reached maximum values at the intermediate layer for the LBM XY MSS. For the conventional alloy, the Cr, Ni and Cu contents were maximum in box 2 which included both the contribution of the inner and the intermediate layers. For Cr, the global amount, i.e. including both the outer and inner layers was lower for the LBM sample, as compared to the conventional one, in agreement with previous XPS analyses. This could be linked mostly to the inner layer composition, with a significantly lower amount of Cr in the inner layer for the LBM sample as compared to the conventional one. Furthermore, Cu and Ni were detected in significantly smaller amounts in the outer layer as compared to the inner layer for the LBM XY sample and were found to segregate at the intermediate layer. For the conven tional sample, it was more difficult to conclude, considering that box 2 included, as previously indicated, both the inner and the intermediate layer, even though literature data indicate that Cu and Ni should be segregated at the intermediate layer as for the LBM XY sample. Indeed, the enrichment in noble alloying elements at the interface between the passive film and the MSS could be due to the preferential dissolution of Fe species leading to a modified alloy zone at the interface [ 41]. Finally, Si was found in the passive film for both LBM XY and conventional samples. Results suggested that the Si amount was higher in the passive film formed on the conventional sample as compared to the LBM XY sample, even though the Si content was twice higher in the LBM matrix (Table 1). This could be explained considering that, in the LBM XY sample, a non-negligible Si content was concentrated in the Si-rich oxide inclusions generated by the manufacturing process and present in the alloy [9,44,52]. The interpretation of these results is nevertheless limited by the complexity of EDS detection of small Si amount.
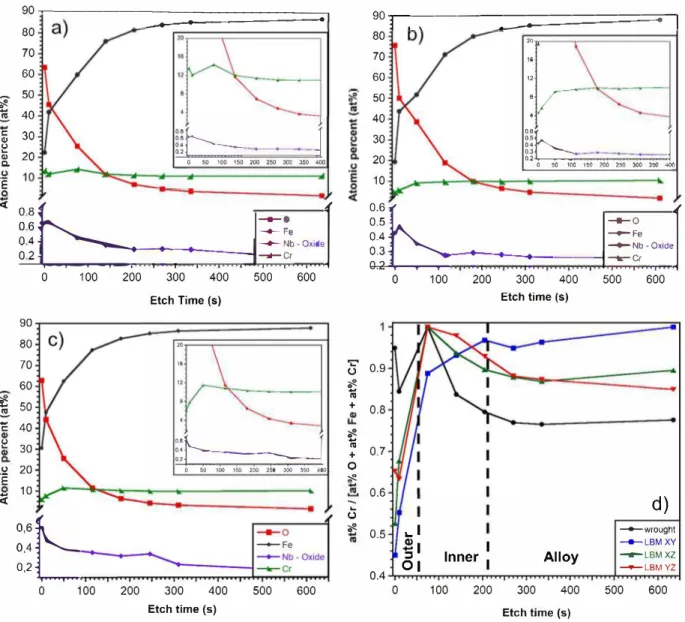
To complete this analysis, elementary XPS depth profiles were per formed for ail the four samples. Fig. 5 shows the results for the con ventional (Fig. Sa), the LBM XY (Fig. Sb) and the LBM XZ (Fig. Sc) samples; the depth profiles of LBM YZ (not plotted here) have the same evolution than those of the LBM XZ sample. The evolution of Fe, Cr, 0 and the Nb oxide spectra are followed from the surface (0 s etching) to the bulk alloy (> 600 s etching). Moreover, to compare the relative evolution of Cr between LBM and conventional samples, normalised ratio Cr / [0 + Fe + Cr], which represents the variations of the Cr content relatively to the main elements of the passive films, was plotted versus the etching time for the four samples (Fig. 5d). This last repre sentation was helpful to roughly identify the different layers by considering the above-mentioned EDS results relative to Cr content in both the outer and the inner layers for one part, and the Cr enrichment at the intermediate layer for the other part, in particular for the LBM XY sample. Besides, the position of the intermediate layer was also visible with the increase in Fe content in parallel with the fast drop of the O line under 10 at. % after 150 s of etching for both samples. It is of interest to mention here that the amounts of alloying elements in Fig. 5 cannot be compared easily with those given in Table 3, where the high C amount due to organic contamination disturbed the quantitative analysis. Re sults in Fig. 5 suggested a difference in the Cr content and distribution between the LBM XY sample on the one hand, and the conventional and LBM (X, Y)Z samples on the other hand, even though the results have to be considered carefully due to the semi quantitative characteristic of the XPS analyses, and the partial reduction of the oxides during Ar+ etching. Hence, the Cr content for the LBM XY sample (Fig. Sb) started at 4 at.% in the outer layer, then increased through the inner layer up to the in termediate layer (maximum value of 9 at. %), confirming the Cr
90�---_-.... .... ---.. -_-_-_-_-_-_-_-_-_-_-_-_-_-_-__.-, 80 70 60
l
50 .!!!. 40 � 30�
., 20 C..E
ii
b
0 50 100 150 200 250 300 350 400J
<
!i
�
-+
•-
,
-
-
-
-
-
,J
_J
§
,
�
;
.
-
0 0 xideîL::::
,
:
,·
j
�
�
.!!!. ë:�
u.E
�
90 80 70 60 50 40 30 20 10 0 100 200 300 400 500 600 Etch Time (s) 20"
:
:
:
f::::
0 50-
100 150 200 250 300 350 400�
:
:
:
t:
0,2 1 0 100 200 300 400 500 600 Etch time (s) '.:::"u
�
0-
+"'
�
0-
+"'
0�
-li
�
0 90r.�---===:;=::::===========-7 80 70 60 50 40 30 20 10 ,0 16 12:r
l:�t::::
0 t50 100 HiO 200 2M 300 3e.0 400I
!1�
....
--
:
....
.
-•�-
�---ll
.
��
�-
�
...
J
0.9 0.8 0.7 0.6 0.5 0.4 0 100 200 300 400 Etch time ( s)... 1
�.
::::,1
lnner 1
Alloy
01
0 100 200 300 400 Etch time (s) 500 600d)
-♦-wrought --LBMXY ---LBMXZ -+-LBM YZ 500 600Fig. 5. XPS elementary depth profiles for conventional (a), LBM XY (b) and LBM XZ (c) samples (results for LBM YZ sample are similar to those obtained for LBM XZ sample). The variation of the elementary ratio Cr/ [Cr+ Fe + O] is given for the different 17-4PH MSS samples (d).
depletion in the outer layer of the passive film, in relative good agree ment with STEM-EDS analyses (Fig. 4, Table 4). The Cr depletion in the outer layer was also observed for LBM XZ sample (Figs. Sc) and YZ samples (not shown here), with some slight differences in the global shape of the profiles as compared to the LBM XY sample (Fig. Sb). The Cr content increased until 12 at.% in the passive film for the LBM XZ sample (Fig. Sc). For the conventional sample, the Cr content remained at a quite constant value around 12 at.% in the passive film (Fig. Sa) with a very slight enrichment in the inner layer, which was also consistent with STEM-EDS analyses, even though a more marked Cr depletion in the outer layer had been seen with STEM-EDS analyses. Furthermore, Fig. Sd gives a relevant description of the Cr distribution in the passive films. The main result was that the maximum Cr content was observed in the inner layer for both the conventional and LBM (X,Y)Z samples, whereas it was reached in the intermediate layer for the LBM XY sample. Finally, it was of importance to note that XPS profiles showed a global Cr amount higher for the passive film formed on the conventional sample as compared to the LBM sample, in agreement with STEM-EDS results. The differences in the global Cr amount, and also in Cr distribution, through the two layers of the passive films formed on the conventional MSS for one part, and on the LBM MSS for the other part, could contribute to explain the difference in the susceptibility to stable and metastable pitting observed between the two steels. Indeed, recent work of Coelho
et al. demonstrated that a higher Cr content in the passive film enhanced his stability and thus the pitting potential for the same alloy with different surface treatment [55], whereas Wang et al. showed that protective properties of the passive film was mainly attributed to its inner part [41]. On the basis of the literature, we propose that the higher susceptibility to metastable pitting observed in our previous study [ 44] for the LBM samples could be linked to the lower Cr amount in the passive films formed on these samples, as compared to the conventional sample. As previously indicated, this could be due to the lower martensite to austenite ratio in LBM samples as compared to the con ventional sample. Furthermore, we also showed a specific behaviour of the LBM XY sample as compared to LBM (X,Y)Z samples, with some metastable pits reaching a maximal growth rate significantly higher than those formed on the conventional and LBM (X,Y)Z samples [44]. The difference should be explained by the Cr distribution inside the passive films as shown by Fig. Sd: the low Cr amount in both the outer and inner layers of the passive film formed on the LBM XY sample, as compared to both the conventional and LBM (X,Y)Z samples, should explain the result. Here also, the results could be related to the martensite to austenite ratio since we showed in previous study [ 44] that the amount of reversed austenite was -8% and 12% in LBM (X,Y)Z samples and LBM XY sample, respectively. Such a difference in austenite content had been related to the anisotropie morphology of the prior
austenitic grains before the H900 heat treatrnent. On the contrary, the more noble pitting potentials measured for the LBM samples as compared to the conventional alloy could be due to other features of the passive film, in particular its thickness and/or defects at specific microstructural features. Indeed, as previously said, the influence of the NbC precipitates on the pitting behaviour could not be neglected. Therefore, the presence of Nb oxide in the passive film was studied, and the variation in depth of the Nb 3d spectra corresponding, as determined by XPS, to NbCxOy and NbO2 was also followed. Results had to be
considered carefully because of the risk of reduction during the Ar+
sputtering and the low amount of Nb (whereas Nb has a high photo ionisation cross section). Nevertheless, they showed a significant con tent of Nb oxide in the outer layer (10 s etching) followed by a slow decrease until the bulk alloy was reached for both samples. This evo lution of the Nb spectrum was consistent with the presence of stable
0
5
1015
Distance (nm)
NbO2 in the outer layer followed by a mix of NbOx and NbCy in the inner layer.
To summarise, the passive films formed on 17-4PH MSS under anodic polarisation in NaCl solution had a similar structure for LBM and conventional samples. They had a bilayer structure characterised by an outer layer mainly constituted of Fe oxy-hydroxide and an inner layer enriched in Cr oxide. In addition, a slight amount of Nb oxide was also detected, mainly in the outer part of the passive films. The intermediate layer between the passive film and the bulk alloy corresponded to a zone enriched in metallic alloying elements (Le. Cr, Cu and Ni) which were not dissolved during the passive film growth. However, some differences could be noticed for the Cr and the Si content between conventional sample and the LBM samples. The global amount and distribution of Cr seems to be the main parameter which controls the passivity properties and so the corrosion behaviour of the different samples as previously
0 5
C coating
10 Distance (nm) 15 0 5 10 Distance (nm) 15Fig. 6. STEM bright field images of the passive film formed in chloride solution a) on the conventional sample, b) on the LBM XY sample and c) on a NbC precipitate emerging at the surface on the LBM XY sample. EDS line profiles (blue arrows) are shown with the relative atomic variation of the alloying elements along the profile line. (For interpretation of the references to color in this figure legend, the reader is referred to the web version of this article.)
explained, with on the one hand differences between the conventional sample and the LBM samples, and on the other hand differences between the LBM XY and LBM (X,Y)Z samples; all the differences might be related to changes in martensite to austenite ratio. However, the slight Si enrichment in the outer layer of the passive film for the conventional sample could also contribute to explain the difference in corrosion behaviour observed in the previous work [44]. Indeed, Laurent et al. show that Si addition in 304LN SS has an indirect effect on corrosion behaviour due to Si ability to segregate at grain boundaries with other alloying species, leading to Cr-depleted area [ 43]. Nevertheless, the resistance to localised corrosion is also closely linked to the passive film defects. In the case of 17-4PH MSS, secondary NbC precipitates in the alloy matrix can constitute preferential pit initiation sites [ 44,45], likely due to differences in the passive film formed on these precipitates. Therefore the particular passive film structure at NbC precipitates had to be studied, which meant to perform local analyses.
3.3. Analysis of the passive films formed on NbC precipitates
As discussed previously, Nb 3d high-resolution XPS spectra were
C coating
composed of multiple components including Nbrv
02 oxide and a mix of
niobium-carbon-oxide NbCxOy (Figs. 2g and 3g). Thus, it could be sus
pected that NbC precipitates were oxidised and that the oxide layer formed on these specific microstructural features was different from the passive film formed on the matrix. To confirm such an hypothesis, EDS profiles were performed on STEM BF images across the passive film formed on the martensitic matrix of the conventional (Fig. 6a) and the LBM XY samples (Fig. 6b) as well as on NbC precipitates emerging at the surface of the LBM XY sample (Fig. 6c). In Fig. 6, the blue arrows indi cate where the EDS profiles were performed on the images. Fig. 6a and b show that the passive film formed on the martensitic matrix is mainly composed of 0, Cr and Fe for both samples. The intermediate layer can also be identified by a slight increase in the Cu and Ni signals just before reaching the passive film, especially for the conventional sample. However, Nb was not detected in the passive film formed on the martensitic matrix. On the contrary, a significant Nb signal was associ ated with an O peak (Fig. 6c) when the EDS profile was performed from the surface across a NbC precipitate in LBM XY sample, which showed that a specific passive film formed on NbC precipitates as suggested by XPS analysis. STEM BF (Fig. 7a and b) images of NbC precipitates
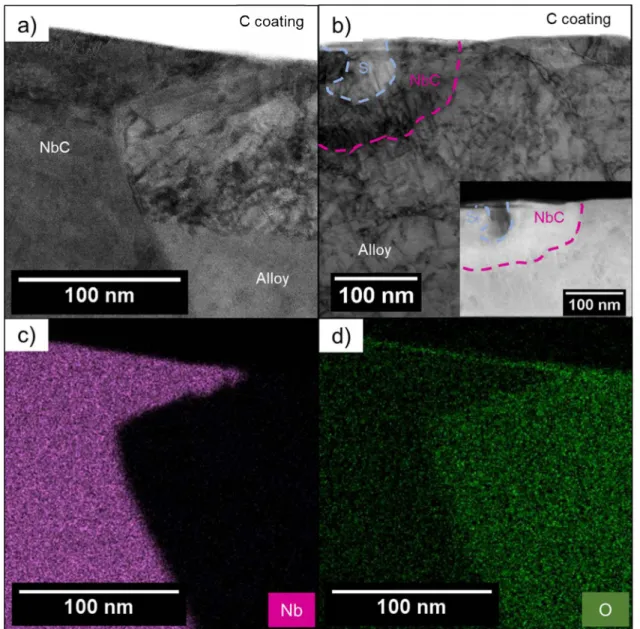
Fig. 7. a) STEM bright field image of the passive film formed on a NbC precipitate emerging at the surface on the conventional MSS sample; b) STEM bright field image on a NbC coupled with a Si-rich oxide inclusion emerging at the surface for the LBM XY MSS sample with the STEM HAADF image insert. The STEM EDS maps for c) Nb and d) 0 have been performed on the same area of STEM BF image a) showing a passive film formed on a NbC precipitate emerging at the surface and on the martensitic matrix.
emerging at the surface for conventional and LBM XY samples, respec tively, were performed to confirm the presence of a passive film covering the NbC precipitates. It could be noticed that the NbC precipitate for LBM XY sample (Fig. 7b) was smaller than for the conventional sample and was coupled with a Si-rich oxide inclusion; this could be related to local segregation of alloying elements around the inclusions as already discussed in previous work [44]. STEM-EDS maps of Nb (Fig. 7c) and 0 (Fig. 7d) were performed on the STEM BF image of the conventional sample (Fig. 7a). O signal was present ail along the NbC precipitate confirming that a passive film covered the whole NbC precipitate sur face; furthermore, qualitative observation suggested that the passive film formed on the NbC precipitates was thinner than that formed on the martensitic matrix. Indeed, the thickness of the passive film formed on the NbC precipitates was evaluated around 1.5 nm as compared to 3 nm for the one formed on the martensitic matrix. The higher O signal measured for the martensitic matrix as compared to the NbC precipitate in the bulk alloy was certainly due to the greatest solubility of O in the interstitial site of the martensite. Similar observations were also per formed for the LBM XY sample.
To summarise, the specific passive film formed on NbC precipitates emerging at the surface seems to be composed of a duplex oxide layer with a transition inner oxide NbCxOy and a stable Nb1v 0
2 in the outer
layer. The presence of a passive film on the NbC precipitates clearly demonstrated the reactivity of those particles in NaCI solution despite their noble electrochemical behaviour [45]. As already discussed, the corrosion behaviour of the 17-4PH MSS and particularly its pitting corrosion susceptibility could be, at least partially, explained by considering the NbC precipitates which could act as preferential pit initiation and propagation sites [ 44]. The results obtained in the present study, with different chemical composition and thickness of the passive film formed on the NbC precipitates as compared to the matrix, were relevant with such a hypothesis. As known, the pitting corrosion behaviour is controlled by the defects in the passive film, i.e. at grain boundaries or precipitates, which can act as preferential sites for passive film breakdown assisted by ci- species. Results obtained in the present study are in agreement with those literature data. Then, we attribute the difference in stable pitting corrosion behaviour between LBM and con ventional samples to the difference in proportion and size of the NbC precipitates, despite the passive film formed on the NbC precipitates for the two MSSs are similar. However, even though our previous TEM observations qualitatively showed similar thickness for the passive films formed on the martensitic matrix for both MSSs, slight differences in this parameter can also contribute to the difference in corrosion behaviour between the LBM and the conventional samples. Therefore, more detailed attention was paid to this specific parameter.
3.4. Thickness of the passive film
To obtain reliable thickness values of the passive film formed on the conventional and the LBM samples, calculations based on XPS spectral intensities were compared to the thickness measured on TEM images. The thickness estimation with XPS (Table 3) was based on a formula using reference samples for Cr and Fe metals and oxides [56,57]:
d _ Àoxide • 01 [ (_ _ x_ _x _ __!!J___ [Yllo
+
1y À alloy [oxide e_lwy
) ]
x - x Slil Il Doxide À:x;de r:lloy [�:;ae (2)
with dx the thickness of the oxide layer for the element x in nm, À{ the
inelastic mean free path of photoelectrons emitted by the core level of the element x in the environment y in nm, 0 the take-off angle of the apparatus (90°) in degree, D"110Y the density of the 17-4PH measured by
hydrostatic weighing (7.7 g cm-3 for the LBM sample and 7.8 g cm-3 for
the conventional sample), ooxide the density of the Cr
203 and Fe203
taken at 5.2 g cm-3, J{ the intensity of the photoelectrons emitted from
the element x at the chemical state y, and I;'.,,r the intensity of the
photoelectrons emitted from the reference of Cr or Fe at the chemical state y. The oxide state coming from the XPS high-resolution spectra includes oxide and hydroxide of an element. Finally, the thickness of the passive film was calculated using the approximate Fe/Cr ratio of 4/1 (Table 4, quantification without 0) deduced from the STEM-EDS results:
dpass;ve film
=
0.2dcr+
0.SdFe (3)where der and dFe were the oxide thicknesses in nm calculated for Cr and Fe oxides, respectively. The results are displayed in Table 3 and show similar thickness values for ail the samples around 4 nm, which is in the expected order of magnitude for a passive film formed on stainless steel
[40-42]. Nevertheless, it appeared that the passive film formed on the conventional sample was slightly thinner than that formed on ail the LBM samples. A slight difference was also observed between the different LBM samples. To confirm the result, additional measurements were performed using TEM, and the thickness of the passive films formed at different zones (at least 10 measurements) was measured by TEM observations. Results showed that the thickness of the passive film formed on the martensitic matrix was 2.4 ± 0.1 nm and 3.0 ± 0.1 nm for the conventional sample and the LBM XY sample, respectively. The values were slightly lower than those estimated by XPS; the differences can be explained by the different surface regions probed by the two techniques (50 nm2 in TEM vs. 4000 nm2 in XPS), and/or limitations of
the use of Eq. (2). Overall, both technique are in the same order of magnitude. Moreover, the thickness of the passive film evaluated from TEM observations was weaker for the conventional sample than for the LBM XY sample, which is in agreement with the values derived from XPS. Finally, additional measurements using TEM observations were also performed to evaluate the thickness of the passive film formed on the NbC precipitates; results showed that the passive film formed on NbC precipitates was thinner, with thickness values twice smaller (between 1.1 and 1.6 nm) than those measured on the martensitic matrix. The thinner passive film upon the NbC precipitates, combined with a possible galvanic couple between those precipitates and the martensitic matrix [ 45], confirmed the deleterious effect of NbC precipitates on the stable pitting corrosion behaviour. As previously shown, the pitting potential of the LBM samples was nobler than that of the conventional sample; this was related to smaller and Jess numerous NbC precipitates in the LBM samples as compared to the conventional MSS [44]. The better resistance to stable pitting of the LBM sample was therefore assumed to originate from a decrease in the amount of possible initiation sites for pitting corrosion as compared to the conventional sample. However, the greater intensity of the current transients generated on the LBM samples, i.e. the higher susceptibility to metastable pitting of LBM MSS, could be linked to the lower Cr content of the passive films formed on LBM samples as compared to the conventional MSS, which decreased capability to repassivation of LBM passive films.
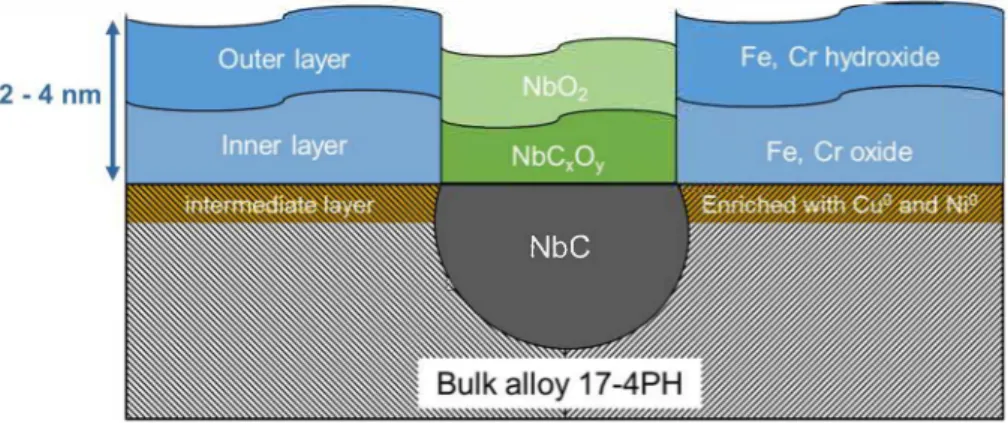
Thereby, a schematic view of the passive film formed on 17-4PH MSS in NaCI solution could be drawn based on the results obtained from TEM and XPS analyses (Fig. 8). The homogenous passive film covering the whole surface, i.e. the martensitic matrix, was disrupted by the presence of NbC precipitates, which were covered by a thinner oxide film with a significantly different chemical composition. In that sense, those results represent consolidated proof of the deleterious role of NbC precipitates towards stable pitting corrosion behaviour in 17-4 PH MSS. However, the role of the manufacturing defects (e.g. gas pores, Jack-of-fusion pores, Si-rich inclusions ... ) on the pitting corrosion behaviour and so on the passive structure, cannot be neglected, but it was not the focus of the present study.
4. Conclusions
The passive films formed in NaCI solution on a LBM and a conven tional 17-4PH MSS, treated with the same annealing heat treatment followed by H900 ageing, were characterised using combined