HAL Id: inserm-01148704
https://www.hal.inserm.fr/inserm-01148704
Submitted on 5 May 2015HAL is a multi-disciplinary open access archive for the deposit and dissemination of sci-entific research documents, whether they are pub-lished or not. The documents may come from teaching and research institutions in France or abroad, or from public or private research centers.
L’archive ouverte pluridisciplinaire HAL, est destinée au dépôt et à la diffusion de documents scientifiques de niveau recherche, publiés ou non, émanant des établissements d’enseignement et de recherche français ou étrangers, des laboratoires publics ou privés.
Olivier Hanon, Tabassome Simon, Jean-Marc Simon, Frédérique Thomas,
Cyril Ducolombier, Nicolas Danchin, et al.
To cite this version:
Emmanuel Wiernik, Hermann Nabi, Bruno Pannier, Sébastien Czernichow, Olivier Hanon, et al.. Perceived stress, sex and occupational status interact to increase the risk of future high blood pressure: the IPC cohort study.. Journal of Hypertension, Lippincott, Williams & Wilkins, 2014, 32 (10), pp.1979-86; discussion 1986. �10.1097/HJH.0000000000000288�. �inserm-01148704�
PERCEIVED STRESS, GENDER AND OCCUPATIONAL STATUS INTERACT TO INCREASE THE RISK OF FUTURE HIGH BLOOD PRESSURE: THE IPC COHORT STUDY
Short title: Current stress and future blood pressure
Emmanuel WIERNIK a,b,c,d,*, Hermann NABI c,d, Bruno PANNIER e,f, Sébastien
CZERNICHOW d,g,h , Olivier HANON a,i, Tabassome SIMON j,k, Jean-Marc SIMON l,
Frédérique THOMAS e, Cyril DUCOLOMBIER e, Nicolas DANCHIN b,e,m, Frédéric
LIMOSIN a,b,n, Silla M. CONSOLI a,n, Cédric LEMOGNE a,b,n
a
Univ Paris Descartes, Sorbonne Paris Cité, Faculté de médecine, Paris, France
b
Inserm U894, Centre Psychiatrie et Neurosciences, Paris, France
c
Inserm, Centre for research in Epidemiology and Population Health, U1018,
Epidemiology of Occupational and Social Determinants of Health Team, Villejuif,
France
d
Univ Versailles St-Quentin, UMRS1018, Versailles, France
e
IPC Center, Paris, France
f
Hopital Manhes, Fleury-Mérogis, France
g
Inserm UMS-011, Population-Based Epidemiological Cohorts, Villejuif, France
h
AP-HP, Hôpital Ambroise Paré, Unité de Nutrition, Boulogne-Billancourt, France
i
AP-HP, Hôpital Broca, Service de Gériatrie, Paris, France
j
Univ Pierre et Marie Curie (UPMC), Paris, France
k
AP-HP, Hôpital St Antoine, Paris, France
l
AP-HP, Groupe Hospitalier Pitié-Salpêtrière, Service d'Oncologie Radiothérapique,
m
AP-HP, Hôpitaux Universitaires Paris Ouest, Service de Cardiologie, Paris, France
n
AP-HP, Hôpitaux Universitaires Paris Ouest, Service universitaire de Psychiatrie de l’adulte et du sujet âgé, Paris, France
* Corresponding author:
Emmanuel Wiernik
INSERM, U1018, Hôpital Paul Brousse
16 avenue Paul Vaillant Couturier
94807, Villejuif Cedex, France.
Tel: +33(0)1-45-59-51-17/ Fax: + 33(0)1-77-74-74-03
Email: [email protected]
Word count: 5,727
number of tables: 3
number of figures: 1
number of supplementary digital content files: 4
Sources of funding
Emmanuel Wiernik was supported by a grant from GESTES / Région Île-de-France
Conflicts of Interest
Sébastien Czernichow has received speaker or consulting fees from Servier, Novo, HRA
Pharma, AstraZeneca and Sanofi. Tabassome Simon has received unrestricted research
grants from AstraZeneca, Daiichi-Sankyo, Eli-Lilly, Glaxo-Smith-Kline, MSD,
Novartis, Pfizer, Sanofi-Aventis and Servier; speaker and consulting fees from
received research grants from AstraZeneca, Daiichi-Sankyo, Eli-Lilly,
Glaxo-Smith-Kline, MSD, Novartis, Pfizer, Sanofi-Aventis, Servier and The Medicines Company;
advisory panels or lecture fees from AstraZeneca, Bayer, Boehringer-Ingelheim,
Daiichi-Sankyo, Eli-Lilly, Glaxo-Smith-Kline, Novo-Nordisk, Roche, Sanofi-Aventis
and Servier. Frédéric Limosin had received fees from Bristol-Myers-Squibb,
Euthérapie, Lundbeck and Otsuka Pharmaceuticals France. Silla M. Consoli had
received fees from Pfizer, MSD, Servier, Gilead, Novo Nordisk, AstraZeneca, Pierre
Fabre and Janssen. Cédric Lemogne has received grants from Pasteur Mutualité,
Lundbeck and has received fees from AstraZeneca, Lundbeck, Pfizer, Pierre Fabre and
Servier.
Emmanuel Wiernik, Hermann Nabi, Bruno Pannier, Olivier Hanon, Jean-Marc Simon,
Abstract
Contrary to lay beliefs, current perceived stress is not consistently associated
with the incidence of high blood pressure (BP) in prospective studies, possibly because
of moderating factors. The present prospective study examined this association and
explored potential moderating effects of gender or occupational status. The 4-item
Perceived Stress Scale was filled at baseline by 19,766 normotensive adults (13,652
men, mean age±standard deviation: 46.8±9.3 years), without history of cardiovascular
and renal disease and not on either psychotropic or antihypertensive drugs. After a mean
follow-up of 5.8±2.1 years, 3,774 participants (19.1%) had high BP, defined as having a systolic BP ≥140 mmHg or a diastolic BP ≥90 mmHg or using antihypertensive drugs.
There was a significant interaction between baseline perceived stress and gender
(p=0.02) in relation to high BP at follow-up. After adjustment for potential confounders,
baseline perceived stress was associated with high BP at follow-up in women (OR [CI]:
1.20 [1.03-1.38]; p=0.016). In addition, the interaction between perceived stress and
occupational status was significant among women (p=0.02). Baseline perceived stress
was positively associated with high BP at follow-up among women of medium or low
occupational status, with OR suggesting a linear increase of the risk (p=0.005).
Perceived stress may be considered as a risk factor for hypertension in women of lower
occupational status. Research addressing the relationships between stress and high BP
should systematically look for possible interactions with gender and occupational status.
Key Words
Epidemiology, gender, hypertension, interaction, occupational status, prospective study,
Introduction
Although hypertension has several known risk factors such as obesity, smoking,
excessive alcohol or salt intake, most patients with hypertension lend great importance
to psychological stress in the regulation of blood pressure (BP) and in the need for
taking antihypertensive drugs [1]. The association between acute psychological stress
and a transient BP elevation is well established [2]. However, epidemiological studies
do not consistently show psychological stress to be associated with BP in the long-term
[3]. One possible reason for these conflicting results is that the moderating role of some
factors has been overlooked. Here we aimed to test the hypothesis that the association
between perceived stress and high BP might depend on gender or occupational status.
As regards gender, differences exist in levels of perceived stress [4], type of
stressors [5], the way to report and to cope with stress [6], but also in the prevalence [7],
pathophysiology [8] (e.g. the contribution of the renin–angiotensin system [9]) and risk
factors of hypertension (e.g. menopause [10] or the use of contraceptives [11]). In
addition, there is some evidence suggesting that psychological variables might be
related to several cardiovascular outcomes to a different extent among men and women
[12-20]. Likewise, perceived stress might be associated with BP differently in men and
women.
With regard to occupational status, a recent study conducted by our group
showed that there was a significant interaction between perceived stress and
occupational status in relation to BP. Precisely, we found that perceived stress was
negatively associated with high BP among individuals of high occupational status but
positively associated among those of low status or unemployed [21]. This finding is in
line with previous evidence showing that job strain may relate to BP at work site [22] or
previous study, as several others, was cross-sectional. Hence, it remains unknown
whether this association could be replicated in studies with a prospective design.
The main aim of this study was to examine the longitudinal association between
perceived stress and the subsequent occurrence of high BP, and to explore the potential
moderating role of gender or occupational status on this association.
Methods
Participants
According to the longitudinal design of the study, our target population was composed of all subjects who had at least two health checkups at the “Investigations
Préventives et Cliniques” (IPC) Center (Paris, France) from January 1996 to December
2011. This medical Center, which is subsidized by the French national health care
system, offers all working and retired individuals and their families a free medical
examination with a minimum interval ranging from one to five years. It carries out
approximately 25,000 examinations per year for people living in the Paris area. Our
target population was composed of all subjects who had at least two health checkups at
the IPC Center in the period from January 1996 to December 2011, with a time interval
between visits of 1 year or more. All clinical and biological parameters were evaluated
on the same day at the examination. In the case of participants who benefited from more
than two examinations, only data from the first and second examinations were
considered. Eligibility criteria were: 30 years of age or more at the first visit (owing to
the low prevalence of hypertension in younger individuals), able to fill out the study
questionnaires, no missing data for selected variables (see below) and a normal BP at
antihypertensive drugs. To minimize potential biases, individuals with a history of
cardiovascular or renal disease, which may confound the association between perceived
stress and BP, and those who reported using psychotropic drugs, which may blur this
association [25], were not included. The IPC Center received authorization from a local
ethics committee and from the “Comité National d’Informatique et des Libertés” to
conduct these analyses. All subjects gave their informed consent at the time of each
examination. The data were rendered anonymous before analysis.
Blood pressure and outcome
After a 10-minute rest period, supine brachial systolic and diastolic BP were
measured 3 times by trained nurses in the right arm using an automated
sphygmomanometer. A standard cuff size was used, but a large cuff was utilized if
necessary. The mean of the last 2 measurements was considered as the BP value. The
primary outcome of the present study was a high BP at the second visit, defined as having a systolic BP ≥140 mmHg or a diastolic BP ≥90 mmHg or using
antihypertensive drugs (see below).
Psychological variables
Perceived stress was measured with the French version of the 4-item Perceived
Stress Scale (PSS-4) [26,27]. Each item is rated on a 0 to 4 scale (see Text S1,
Supplemental Digital Content 1). The PSS-4 total score ranges from 0 to 16 and has a
one-factor structure and a satisfactory internal consistency (α=0.73). It measures the degree to which situations in one’s life over the past month were appraised as stressful
things in your life?”). In order to obtain meaningful odds ratios, the variable was
rescaled using the difference between the 25th and the 75th percentile as the unit.
Since stress is linked to depressive mood that may in turn be associated with a
lower BP [28], depressive mood was included as a covariate. It was measured with a
French 13-item questionnaire (QD2A, Questionnaire of Depression 2nd version,
Abridged) [29,30]. Building on previous questionnaires, this 13-item questionnaire was
specifically designed for depression screening in community studies and has a high internal consistency (α=0.91). Participants had to give a yes/no answer to each item as
regards their current emotional state (e.g. “I am disappointed and disgusted with
myself,” “I’m sad these days,” “I feel hopeless about the future”). The number of “yes”
answers is summed, a total score ≥7 indicating a high probability of major depression.
The QD2A has been found to predict suicide in the IPC Cohort Study [31].
Occupational status
Occupational status was categorized in 5 classes: (1) high (e.g. managers); (2)
medium (e.g. clerks or first line supervisors); (3) low (e.g. blue collar workers); (4)
unemployed participants (i.e. seeking employment); (5) participants without a paid
occupation (e.g. housewives). Retired participants were assigned to their last
occupational category. The distinction of three categories among working participants is
standard among occupational cohorts examining the relationships between psychosocial
variables and physical health outcomes [32].
Other variables
Other variables included time interval between visits, age, gender, living status
cigarettes/day, 11-20 cigarettes/day, >20 cigarettes/day), alcohol intake (0 glasses/week,
1-6 glasses/week for women or 1-13 glasses/week for men, 7-20 glasses/week for
women or 14-27 glasses/week for men, >21 glasses/week for women or >28
glasses/week for men), and regular physical activity (i.e. estimated equivalent to at least
one hour/day of walking). Personal history of cardiovascular or renal disease, and
family history of hypertension were self-reported (yes, no), as well as current
medications including diuretics, antihypertensive drugs (other than diuretics), medications “to sleep” or “for anxiety or depression.” Among participants reporting
taking diuretics, only those that reported doing this “to lower BP” were considered as
taking an antihypertensive drug. Perceived health status was collected with a 10-point
scale (with 10 considered to be “excellent health”). Body mass index (BMI) was
calculated and categorized in 4 classes(<18.5; 18.5-24.9; 25-29.9; ≥30 kg/m2). Resting
heart rate (HR) was measured in beats per minute with a 10-cycle electrocardiogram
(HR = 60 / RR interval in seconds) and fasting glycemia in mmol/L. Menopausal status
was self-reported for women and categorized in 3 classes (not menopausal at second
visit, menopausal at second visit only, already menopausal at first visit).
Statistical analysis
The dependent variable was high BP at follow-up (i.e. the second visit) and,
according to the main aim of this study, our independent variables were those measured
at baseline (i.e. the first visit). The relationship between perceived stress at baseline and
the likelihood of having high BP at follow-up was examined using univariate and
multivariate binary logistic regression models with odds ratio (OR) and 95% confidence
interval (CI). Except for BP and BMI, all variables were analyzed as continuous when
between stress and gender and between stress and occupational status in relation to the
risk of high BP at follow-up. The interactions were tested by including in the same
model the two variables of interest (e.g. gender and perceived stress, separately) as well
as their interaction term (i.e. gender by perceived stress). In the case of statistically
significant interactions, analyses were stratified by gender or occupational status,
including all other covariates. Statistical analysis was carried out with the PASW
Statistics software (version 18.0, SPSS Inc., Chicago).
Results
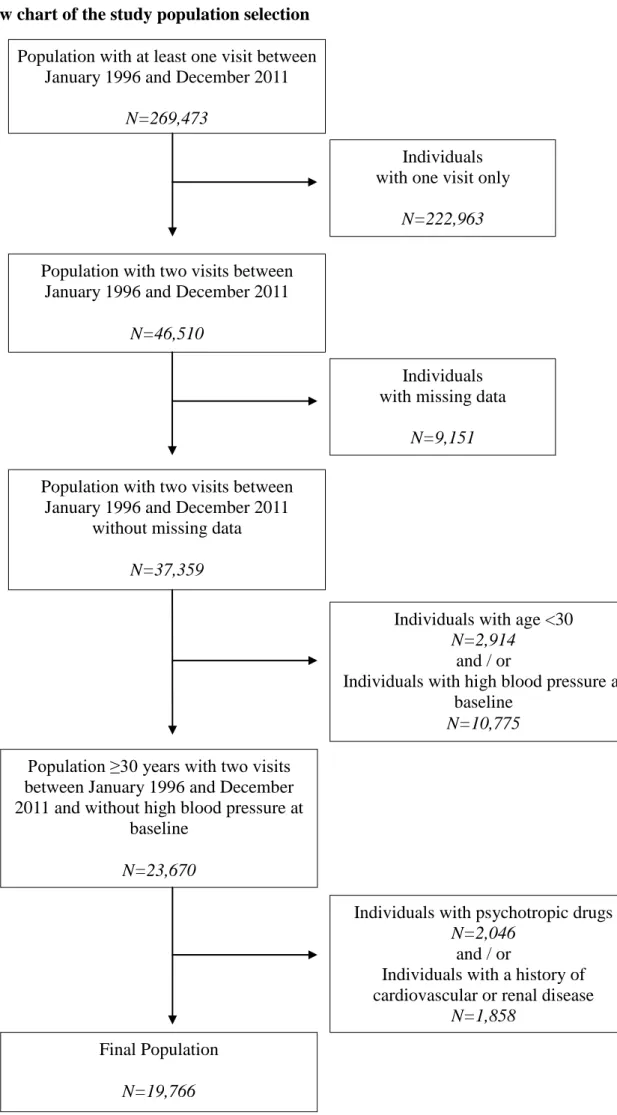
Figure S1 (see Supplemental Digital Content 2) presents the flow chart of the
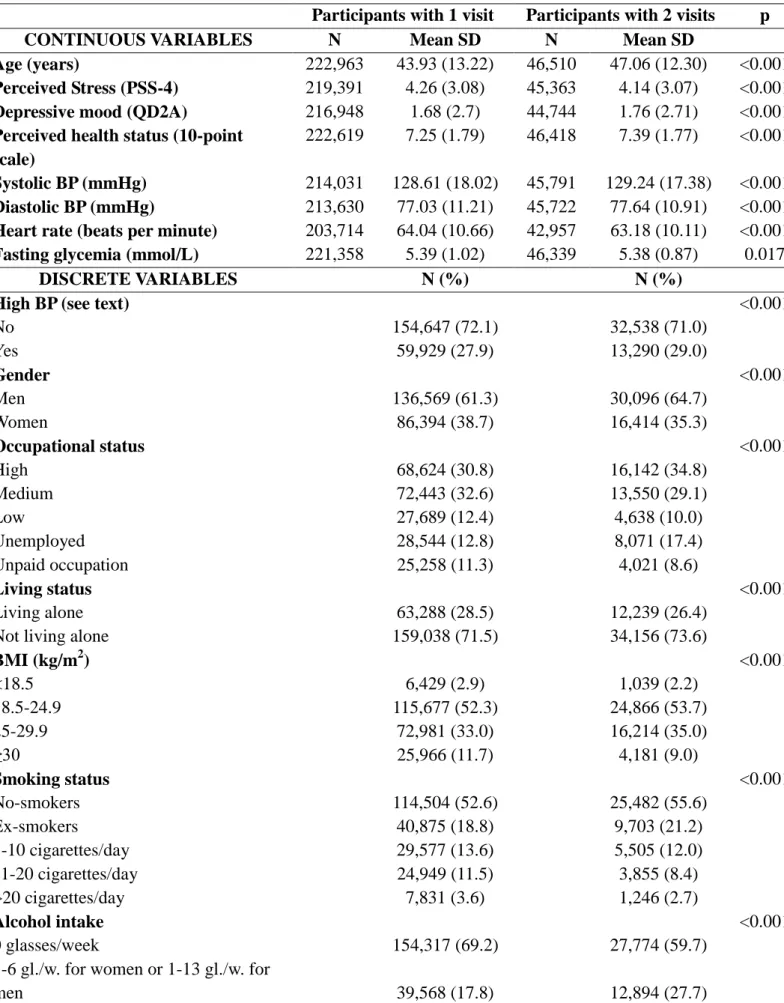
study population selection and Table S1 (see Supplemental Digital Content 3) compared
the baseline characteristics of individuals who had only one health check-up at the IPC
center to the characteristics of those who came twice. The final study population
consisted of 19,766 participants (13,652 men and 6,114 women) with a mean age of
46.8±9.3 years. The mean perceived stress score was 3.6±2.9 with a 5-point difference
between the 25th and the 75th percentile.
After a mean follow-up of 5.8±2.1 years, 3,774 participants (19.1%) had high
BP, including 417 with an antihypertensive drug (mean systolic / diastolic BP: 136±17 /
81±10 mmHg) and 3,357 without drug (mean systolic / diastolic BP: 149±11 / 88±9
mmHg). When men and women were included together, baseline perceived stress was
not associated with greater risk of high BP at follow-up (OR [CI]: 1.00 [0.93-1.06];
p=0.86). However, there was a significant interaction between baseline perceived stress
and gender (p=0.02) in relation to high BP at follow-up, but not between baseline
perceived stress and occupational status (p=0.60). Thus, the association between
and women. Table 1 shows the characteristics of study participants.
Univariate analyses in men and women separately are displayed in Table S2 (see
Supplemental Digital Content 4). Fully adjusted models in men and women are
displayed in Table 2. Adjusting for all variables, the association between baseline
perceived stress and high BP at follow-up was significant in women (OR [CI]: 1.20
[1.03-1.38]; p=0.016). In sensitivity analyses, this association remained significant after
further adjustment for menopausal status (OR [CI]: 1.20 [1.04-1.39]; p=0.01) or after
adjustment for covariates measured at the follow-up visit instead of covariates measured
at baseline (OR [CI]: 1.15 [1.01-1.32]; p=0.04). Similar results were also obtained if
retired participants were not included (OR [CI]: 1.19 [1.02-1.40]; p=0.03).
In addition, we found a significant interaction between perceived stress and
occupational status among women (p=0.02), suggesting that the association between
baseline perceived stress and future high BP might be different across occupational
categories in women. Adjusting for all other variables, baseline perceived stress was
positively associated with future high BP among women of low or medium occupational
status, but not among other occupational categories (Table 3 and Figure 1). The OR
values among women of high, medium and low status suggested a possible linear
increase of the association across occupational status. To examine whether this linear
trend was significant, we restricted our analyses to women of high, medium or low
occupational status and found a significant interaction between perceived stress and
occupational status taken as a linear variable (p=0.005). Taking the use of
antihypertensive drugs as an alternative endpoint, baseline perceived stress remained
positively associated with future high BP among women of medium occupational status
(OR [CI]: 1.74 [1.06-2.88]; p=0.03). For women of low occupational status, only 5
women were taking antihypertensive drugs at follow-up, thus preventing further
Discussion
Summary of results
This prospective study aimed to examine the association between baseline
perceived stress and the incidence of high BP, and to explore a potential moderating
effect of gender or occupational status. After adjustment for all variables, current
perceived stress was associated with future high BP in women only. In addition, the
interaction between occupational status and perceived stress was significant in women.
In analyses stratified by occupational categories, perceived stress was positively
associated with high BP among women of medium or low occupational status, with OR
suggesting a linear increase of the risk.
Explanatory hypotheses
Many hypotheses could explain gender differences in the association of baseline
perceived stress with the occurrence of high BP. First, men and women are not exposed
to the same stressors [5]. Therefore, perceived stress in women may relate to stressors
associated with high BP to a greater extent than in men. Second, women might have
reported their emotional state, and thus perceived stress, more accurately than men for
at least two reasons: a better ability to recognize this emotional state [33] and a higher
tendency to disclose emotional state once recognized [34]. A better accuracy in the
estimation of stress might thus have led to a better accuracy when looking for an
association with high BP. Third, there is strong evidence for gender differences in
defined as a perseverative focus on one's negative emotions and the causes and
consequences of them, leading to mentally reliving stressful events [6]. Rumination is
associated with poor BP recovery after acute stress [35] and people who tend toward
greater rumination exhibit more BP reactivity to repeated mental stress tasks [36].
Therefore, a greater proneness to ruminate among women might explain why perceived
stress may lead to higher levels of BP in the long run. In addition, women might also
cope with stress with behaviors that were not adjusted for in the current analysis. For
example, perceived stress is associated with more frequent consumption of sweets/fast
foods in women especially [37] and might be a barrier to engage in health-promoting
behaviors like physical exercise or refraining from snacking [38].
Finally, at a neural level, the impact of acute stress on blood pressure depends on
the interplay of inhibitory control from prefrontal regions with excitatory input from
limbic regions [39]. During acute stress, men might respond with a more favorable
cortical-limbic balance than women that may result in lower effects of stress on BP
levels [40,41].
Differences in the association of baseline perceived stress with the occurrence of
high BP according to occupational status among women mirror the results of our
previous cross-sectional study among men and women [21] as well as those from stress
at work studies [22]. Occupational categories may differ in terms of exposure to
work-related stress and particularly to job strain, which combines high job demands with low
control at work [32] and tends to be associated with both high BP and lower
occupational category [22,42]. Beyond job strain, perceived stress may also relate to
exposure to occupational stressors that are specific to certain occupational categories
(e.g., noise, cardiotoxic chemicals) and differently associated with the risk of
hypertension [43,44]. Participants with lower occupational status might also have been
more with detrimental ones (e.g., alcohol consumption) [45]. Finally, lower
socioeconomic status may be associated with lower probability to be diagnosed with
hypertension or to take an antihypertensive drug once diagnosed [46], even in countries
with an equal access to care [47,48]. This is consistent with the small number of women
of low occupational status taking antihypertensive drugs at follow-up.
However, it is not clear why the above-mentioned mechanisms should apply for
women only. This is unlikely to be explained in terms of statistical power due to the
greater number of men among each occupational categories in which the association
was significant. First, according to the Karasek model, differences in the ratio between
job demands and latitude decision across occupational categories might be greater in
women than men [49]. Second, according to the Siegrist model, differences in the ratio
between reward and efforts at work might also be greater in women [50]. Interestingly,
effort–reward imbalance has recently been found to predict future high BP in women
only [20]. According to these two well-defined, internationally recognized models, such
discrepancies may explain why perceived stress might have a particular impact among
women of lower status. Third, in addition to occupational stressors, women are more
likely than men to be exposed to non-occupational stressors such as household tasks,
child care, care of sick or elderly relatives [51]. Perceived stress in women of low
occupational status might thus be more likely to overwhelm their coping resources
owing to the cumulative effects of these two sources of stress. In addition, gender
differences in coping strategies, including the above-mentioned proneness to
rumination, might depend upon occupational status, so that these differences might be
less marked in individuals of high status [52,53]. In accordance with this hypothesis, a
large cohort study recently found neuroticism (i.e. a personality trait associated with
poor emotion regulation) to predict cardiovascular mortality in women of low
Strengths and limitations
To our knowledge, this is the largest study to address this question and the first
one to show that gender moderates the association between perceived stress and high
BP. Strengths of the study are its prospective design, a large sample size allowing
subsample analyses and the wide set of covariates considered, including a measure of
depressive mood. For women, the potential role of menopause was taken into account.
Some limitations should also be acknowledged. First, BP was not measured at several
successive consultations. However, high BP has been associated with cardiovascular
mortality in the IPC cohort study [55], as well as in other cohorts [56-58]. Furthermore,
taking the use of antihypertensive drugs as an alternative endpoint, baseline perceived
stress remained positively associated with future high BP among women of medium
occupational status. Second, some potential confounders were not measured, such as
diet, salt consumption, ethnicity, social support, and personality variables. Likewise,
mental health was not fully explored and the QD2A does not allow making the
diagnosis of clinical depression. As regards considered confounders, their measures
might have been too crude or changes might have occurred during the follow-up in
relation to perceived stress. However, these changes are unlikely to account for the
prospective association of baseline perceived stress with high BP at follow-up, as this
association remained significant even when adjusting for confounders measured at
follow-up. Third, a large sample size ensures statistical power but not clinical
significance because even small differences may reach statistical significance. Finally,
the IPC cohort is not be representative of the general French population. Study
recruitment was limited to the Paris area and two thirds of the participants were men,
inhabitants, individuals in the IPC cohort were less likely to live alone, and more likely
to have a professional activity and a higher occupational status
(http://www.recensement.insee.fr/home.action). In addition, the present participants had
asked for two preventive medical examinations, and thus may presumably display
increased interest in their own health. For instance, they were more likely to have a
normal BMI and to be non-smokers than the individuals who had only one health
check-up at the IPC center. However, the incidence of high BP in the present sample
was consistent with the incidence of hypertension in France [59]. Furthermore, these
potential selection biases are unlikely to account for the relationships we found within
the present sample, especially those characterized by the interactions of stress with
gender and occupational status.
Perspectives
Although previous studies failed to establish stress as a risk factor for
hypertension, the present results suggest that overlooking the moderating role of gender
and occupational status might have blurred the relationship between stress and
hypertension. From a clinical perspective, they suggest that perceived stress could be
considered as a risk factor for hypertension in women of lower occupational status.
Further studies are warranted to elucidate the mechanisms of this association, as such
Acknowledgments
We thank the Caisse Nationale d’Assurance Maladie des Travailleurs Salariés
(CNAM-TS, France) and the Caisse Primaire d’Assurance Maladie de Paris (CPAM-P, France)
References
1 Marshall IJ, Wolfe CDA, McKevitt C. Lay perspectives on hypertension and drug
adherence: systematic review of qualitative research. BMJ 2012; 345:e3953.
2 Chida Y, Hamer M. Chronic psychosocial factors and acute physiological responses
to laboratory-induced stress in healthy populations: a quantitative review of 30
years of investigations. Psychol Bull 2008; 134:829–885.
3 Sparrenberger F, Cichelero FT, Ascoli AM, Fonseca FP, Weiss G, Berwanger O, et
al. Does psychosocial stress cause hypertension? A systematic review of
observational studies. J Hum Hypertens 2009; 23:12–19.
4 Cohen S, Janicki-Deverts D. Who’s Stressed? Distributions of Psychological Stress
in the United States in Probability Samples from 1983, 2006, and 2009. J Appl Soc
Psychol 2012; 42:1320–1334.
5 Matud MP. Gender differences in stress and coping styles. Pers Individ Dif 2004;
37:1401–1415.
6 Nolen-Hoeksema S. Emotion regulation and psychopathology: the role of gender.
Annu Rev Clin Psychol 2012; 8:161–187.
7 Godet-Mardirossian H, Girerd X, Vernay M, Chamontin B, Castetbon K, de Peretti
C. Patterns of hypertension management in France (ENNS 2006-2007). Eur J Prev
Cardiol 2012; 19:213–220.
8 Gudmundsdottir H, Høieggen A, Stenehjem A, Waldum B, Os I. Hypertension in
3:137–146.
9 Maric-Bilkan C, Manigrasso MB. Sex differences in hypertension: contribution of
the renin-angiotensin system. Gend Med 2012; 9:287–291.
10 Yanes LL, Reckelhoff JF. Postmenopausal hypertension. Am J Hypertens 2011;
24:740–749.
11 Pimenta E. Hypertension in women. Hypertens Res 2012; 35:148–152.
12 Mendes de Leon CF, Krumholz HM, Seeman TS, Vaccarino V, Williams CS, Kasl
SV, et al. Depression and risk of coronary heart disease in elderly men and women:
New Haven EPESE, 1982-1991. Established Populations for the Epidemiologic
Studies of the Elderly. Arch Intern Med 1998; 158:2341–2348.
13 Joukamaa M, Heliövaara M, Knekt P, Aromaa A, Raitasalo R, Lehtinen V. Mental
disorders and cause-specific mortality. Br J Psychiatry 2001; 179:498–502.
14 Williams SA, Kasl SV, Heiat A, Abramson JL, Krumholz HM, Vaccarino V.
Depression and risk of heart failure among the elderly: a prospective
community-based study. Psychosom Med 2002; 64:6–12.
15 Lemogne C, Niedhammer I, Khlat M, Ravaud JF, Guillemin F, Consoli SM, et al.
Gender differences in the association between depressive mood and mortality: a
12-year follow-up population-based study. J Affect Disord 2012; 136:267–275.
16 Iso H, Date C, Yamamoto A, Toyoshima H, Tanabe N, Kikuchi S, et al. Perceived
mental stress and mortality from cardiovascular disease among Japanese men and
women: the Japan Collaborative Cohort Study for Evaluation of Cancer Risk
17 André-Petersson L, Engström G, Hedblad B, Janzon L, Rosvall M. Social support at
work and the risk of myocardial infarction and stroke in women and men. Soc Sci
Med 2007; 64:830–841.
18 Toivanen S, Hemström O. Is the impact of job control on stroke independent from
socioeconomic status?: a large-scale study of the Swedish working population.
Stroke 2008; 39:1321–1323.
19 Tsutsumi A, Kayaba K, Kario K, Ishikawa S. Prospective Study on Occupational
Stress and Risk of Stroke. Arch Intern Med 2009; 169:56-61.
20 Gilbert-Ouimet M, Brisson C, Vézina M, Milot A, Blanchette C. Repeated exposure
to effort-reward imbalance, increased blood pressure, and hypertension incidence
among white-collar workers: effort-reward imbalance and blood pressure. J
Psychosom Res 2012; 72:26–32.
21 Wiernik E, Pannier B, Czernichow S, Nabi H, Hanon O, Simon T, et al.
Occupational status moderates the association between current perceived stress and
high blood pressure: evidence from the IPC cohort study. Hypertension 2013;
61:571–577.
22 Landsbergis PA, Schnall PL, Pickering TG, Warren K, Schwartz JE. Lower
socioeconomic status among men in relation to the association between job strain
and blood pressure. Scand J Work Environ Health 2003; 29:206–215.
23 Tsutsumi A, Kayaba K, Ishikawa S. Impact of occupational stress on stroke across
occupational classes and genders. Soc Sci Med 2011; 72:1652–1658.
Seventh Report of the Joint National Committee on Prevention, Detection,
Evaluation, and Treatment of High Blood Pressure. Hypertension 2003; 42:1206–
1252.
25 Licht CM, de Geus EJ, Seldenrijk A, van Hout HP, Zitman FG, van Dyck R,
Penninx BW. Depression is associated with decreased blood pressure, but
antidepressant use increases the risk for hypertension. Hypertension 2009; 53:631–
638.
26 Cohen S, Kamarck T, Mermelstein R. A global measure of perceived stress. J
Health Soc Behav 1983; 24:385–396.
27 Lesage F-X, Berjot S, Deschamps F. Psychometric properties of the French versions
of the Perceived Stress Scale. Int J Occup Med Environ Health 2012; 25:178–184.
28 Nabi H, Chastang J-F, Lefèvre T, Dugravot A, Melchior M, Marmot MG, et al.
Trajectories of depressive episodes and hypertension over 24 years: the Whitehall II
prospective cohort study. Hypertension 2011; 57:710–716.
29 Pichot P, Boyer P, Pull CB, Rein W, Simon M, Thibault A. Un questionnaire
d’auto-évaluation de la symptomatologie dépressive, le Questionnaire QD2: I.
Construction, structure factorielle et propriétés métrologiques. Rev Psychol Appl
1984; 34:229–250.
30 Pichot P, Boyer P, Pull CB, Rein W, Simon M, Thibault A. Un questionnaire
d’auto-évaluation de la symptomatologie dépressive, le questionnaire QD2. II: Forme
abrégée QD2A. Rev Psychol Appl 1984; 34:323–340.
completed suicide: evidence from the IPC cohort study. Psychosom Med 2011;
73:731–736.
32 Kivimäki M, Nyberg ST, Batty GD, Fransson EI, Heikkilä K, Alfredsson L, et al.
Job strain as a risk factor for coronary heart disease: a collaborative meta-analysis
of individual participant data. Lancet 2012; 380:1491–1497.
33 Barrett LF, Lane RD, Sechrest L, Schwartz GE. Sex differences in emotional
awareness. Pers Soc Psychol Bull 2000; 26:1027–1035.
34 Tamres LK, Janicki D, Helgeson VS. Sex differences in coping behavior: a
meta-analytic review and an examination of relative coping. Pers Soc Psychol Rev 2002;
6:2–30.
35 Radstaak M, Geurts SAE, Brosschot JF, Cillessen AHN, Kompier MAJ. The role of
affect and rumination in cardiovascular recovery from stress. Int J Psychophysiol
2011; 81:237–244.
36 Johnson JA, Lavoie KL, Bacon SL, Carlson LE, Campbell TS. The effect of trait
rumination on adaptation to repeated stress. Psychosom Med 2012; 74:258–262.
37 Mikolajczyk RT, El Ansari W, Maxwell AE. Food consumption frequency and
perceived stress and depressive symptoms among students in three European
countries. Nutr J 2009; 8:31.
38 Soffer M. The role of stress in the relationships between gender and
health-promoting behaviours. Scand J Caring Sci 2010; 24:572–580.
39 Gianaros PJ, Sheu LK. A review of neuroimaging studies of stressor-evoked blood
disease risk. Neuroimage 2009; 47:922–936.
40 Wang J, Korczykowski M, Rao H, Fan Y, Pluta J, Gur RC, et al. Gender difference
in neural response to psychological stress. Soc Cogn Affect Neurosci 2007; 2:227–
239.
41 Domes G, Schulze L, Böttger M, Grossmann A, Hauenstein K, Wirtz PH, et al. The
neural correlates of sex differences in emotional reactivity and emotion regulation.
Hum Brain Mapp 2010; 31:758–769.
42 Rosenthal T, Alter A. Occupational stress and hypertension. J Am Soc Hypertens
2012; 6:2–22.
43 Tomei G, Fioravanti M, Cerratti D, Sancini A, Tomao E, Rosati MV, et al.
Occupational exposure to noise and the cardiovascular system: a meta-analysis. Sci
Total Environ 2010; 408:681–689.
44 Poreba R, Poreba M, Gać P, Andrzejak R. Ambulatory blood pressure monitoring
and structural changes in carotid arteries in normotensive workers occupationally
exposed to lead. Hum Exp Toxicol 2011; 30:1174–1180.
45 Siegrist J, Rödel A. Work stress and health risk behavior. Scand J Work Environ
Health 2006; 32:473–481.
46 Grotto I, Huerta M, Sharabi Y. Hypertension and socioeconomic status. Curr Opin
Cardiol 2008; 23:335-339.
47 de Gaudemaris R, Lang T, Chatellier G, Larabi L, Lauwers-Cancès V, Maître A,
Diène E. Socioeconomic inequalities in hypertension prevalence and care: the
48 Paulsen MS, Andersen M, Munck AP, Larsen PV, Hansen DG, Jacobsen IA.
Socio-economic status influences blood pressure control despite equal access to care. Fam
Pract 2012; 29:503-510.
49 Niedhammer I, Chastang J-F, Levy D. Exposition aux facteurs psychosociaux au travail du modèle de Karasek en France : étude méthodologique à l’aide de
l’enquête nationale Sumer. Travailler 2007; 17:47–70.
50 Niedhammer I, Tek M-L, Starke D, Siegrist J. Effort-reward imbalance model and
self-reported health: cross-sectional and prospective findings from the GAZEL
cohort. Soc Sci Med 2004; 58:1531–1541.
51 Lundberg U, Mårdberg B, Frankenhaeuser M. The total workload of male and
female white collar workers as related to age, occupational level, and number of
children. Scand J Psychol 1994; 35:315–327.
52 Narayanan L, Menon S, Spector PE. Stress in the workplace: a comparison of
gender and occupations. J Organ Behav 1999; 20:63–73.
53 Torkelson E, Muhonen T. The role of gender and job level in coping with
occupational stress. Work Stress 2004; 18:267–274.
54 Hagger-Johnson G, Roberts B, Boniface D, Sabia S, Batty GD, Elbaz A, et al.
Neuroticism and cardiovascular disease mortality: socioeconomic status modifies
the risk in women (UK Health and Lifestyle Survey). Psychosom Med 2012;
74:596–603.
55 Thomas F, Blacher J, Benetos A, Safar ME, Pannier B. Cardiovascular risk as
additional predictive value of pulse pressure on mortality. J Hypertens 2008;
26:1072–1077.
56 Kelly TN, Gu D, Chen J, Huang JF, Chen JC, Duan X, et al. Hypertension subtype
and risk of cardiovascular disease in Chinese adults. Circulation 2008;
118:1558-1566.
57 Dorjgochoo T, Shu XO, Zhang X, Li H, Yang G, Gao L, et al. Relation of blood
pressure components and categories and all-cause, stroke and coronary heart disease
mortality in urban Chinese women: a population-based prospective study. J
Hypertens 2009; 27:468-475.
58 Takashima N, Ohkubo T, Miura K, Okamura T, Murakami Y, Fujiyoshi A, et al.
Long-term risk of BP values above normal for cardiovascular mortality: a 24-year
observation of Japanese aged 30 to 92 years. J Hypertens 2012; 30:2299-2306.
59 Meneton P, Heudes D, Bertrais S, Czernichow S, Galan P, Hercberg S, Ménard J.
High incidence of hypertension in middle-aged French adults in the late 1990s. J
Table 1. Characteristics of study participants. Men (n=13,652) Women (n=6,114) p
CONTINUOUS VARIABLES * Mean (SD) Mean (SD)
Age (years) 46.09 (8.87) 48.35 (10.01) <0.001
Perceived Stress (PSS-4) 3.38 (2.77) 4.18 (2.94) <0.001
Depressive mood (QD2A) 1.13 (2.07) 1.94 (2.64) <0.001
Perceived health status (10-point scale) 7.82 (1.54) 7.49 (1.69) <0.001
Systolic BP (mmHg) 122.82 (9.18) 119.00 (10.61) <0.001
Diastolic BP (mmHg) 74.71 (7.13) 72.03 (7.67) <0.001
Heart rate (beats per minute) 60.70 (9.14) 64.31 (9.31) <0.001
Fasting glycemia (mmol/L) 5.42 (0.68) 5.15 (0.64) <0.001
Interval between visits (years) 5.89 (2.12) 5.66 (2.21) <0.001
DISCRETE VARIABLES * N (%) N (%)
High BP at follow-up (see text) <0.001
No 10,937 (80.1) 5,055 (82.7) Yes 2,715 (19.9) 1,059 (17.3) Occupational status High 6,837 (50.1) 1,473 (24.1) <0.001 Medium 3,317 (24.3) 2,707 (44.3) Low 1,616 (11.8) 294 (4.8) Unemployed 1,803 (13.2) 923 (15.1) Unpaid occupation 79 (0.6) 717 (11.7) Living status <0.001 Living alone 2,762 (20.2) 1,810 (29.6)
Not living alone 10,890 (79.8) 4,304 (70.4) BMI (kg/m2) <0.001 <18.5 129 (0.9) 256 (4.2) 18.5-24.9 7,445 (54.5) 4,287 (70.1) 25-29.9 5,379 (39.4) 1,217 (19.9) ≥30 699 (5.1) 354 (5.8) Smoking status No-smokers 6,674 (48.9) 4,084 (66.8) <0.001 Ex-smokers 3,423 (25.1) 889 (14.5) 1-10 cigarettes/day 1,827 (13.4) 639 (10.5) 11-20 cigarettes/day 1,329 (9.7) 401 (6.6) >20 cigarettes/day 399 (2.9) 101 (1.7) Alcohol intake <0.001 0 glasses/week 6,873 (50.3) 4,390 (71.8)
1-6 gl./w. for women or 1-13 gl./w. for
men 5,119 (37.5) 1,118 (18.3)
7-20 gl./w. for women or 14-27 gl./w. for
men 1,132 (8.3) 498 (8.1)
>21 gl./w. for women or >28 gl./w. for
men 528 (3.9) 108 (1.8)
Regular physical activity 0.247
<1 hour of walking/day 7,312 (53.6) 3,329 (54.4) ≥1 hour of walking/day 6,340 (46.4) 2,785 (45.6)
Familial history of hypertension <0.001
No 10,584 (77.5) 4,111 (67.2)
Menopausal status
Not menopausal at second visit 2,585 (42.3)
Already menopausal at first visit 1,883 (30.8)
Menopausal at second visit only 1,628 (26.6)
Missing data 18 (0.3)
BMI indicates body mass index; BP, blood pressure; PSS-4, 4-item Perceived Stress
Scale; QD2A, questionnaire of depression 2nd version abridged; and SD, Standard
Deviation.
Table 2. Associations between each variable at baseline and high BP (see text) at follow-up in fully adjusted models.
INDEPENDENT VARIABLES Men Women
CONTINUOUS VARIABLES * OR [95%CI] OR [95%CI]
Age (years) 1.05† [1.04-1.05] 1.06† [1.05-1.07]
Perceived Stress (PSS-4) 0.97 [0.88-1.07] 1.20§ [1.03-1.38]
Depressive mood (QD2A) 1.02 [0.99-1.04] 0.97 [0.94-1.01]
Perceived health status (10-point scale) 1.02 [0.99-1.05] 0.97 [0.92-1.01]
Heart rate (beats per minute) 1.03† [1.03-1.04] 1.03† [1.02-1.04]
Fasting glycemia (mmol/L) 1.01† [1.00-1.01] 1.00 [1.00-1.01]
Interval between visits (years) 1.09† [1.06-1.12] 1.09† [1.05-1.13]
DISCRETE VARIABLES OR [95%CI] OR [95%CI]
Occupational status
High Reference Reference
Medium 1.06 [0.95-1.18] 1.14 [0.95-1.37]
Low 1.32† [1.15-1.53] 1.41§ [1.00-1.99]
Unemployed 1.01 [0.85-1.19] 0.91 [0.69-1.20]
Unpaid occupation 1.51 [0.87-2.63] 1.19 [0.93-1.53]
Living alone (vs. not living alone) 1.10 [0.98-1.24] 0.96 [0.81-1.13]
BMI <18.5 0.65 [0.36-1.17] 0.75 [0.48-1.18] 18.5-24.9 Reference Reference 25-29.9 1.57† [1.44-1.73] 1.92† [1.62-2.26] ≥30 2.59† [2.17-3.09] 2.59† [1.98-3.37] Smoking status
Non-smokers Reference Reference Ex-smokers 1.13§ [1.02-1.26] 0.80§ [0.64-0.99] 1-10 cigarettes/day 0.97 [0.84-1.12] 0.81 [0.62-1.06] 11-20 cigarettes/day 1.17§ [1.00-1.37] 1.22 [0.91-1.64] >20 cigarettes/day 1.49‡ [1.17-1.90] 1.33 [0.75-2.36] Alcohol intake 0 gl./w. Reference Reference
1-6 gl./w. for women or 1-13 gl./w. for
men
1.34† [1.21-1.47] 1.35‡ [1.13-1.61]
7-20 gl./w. for women or 14-27 gl./w. for
men
0.74‡ [0.61-0.89] 0.96 [0.73-1.26]
>21 gl./w. for women or >28 gl./w. for
men
1.14 [0.91-1.44] 0.66 [0.35-1.24]
≥1 hour of walking/day (vs. <1 hour) 1.10§ [1.01-1.21] 0.98 [0.84-1.13]
Familial history of hypertension 1.29† [1.16-1.43] 1.30† [1.12-1.51]
BMI indicates body mass index; BP, blood pressure; CI, confidence interval; OR, odds
ratio; PSS-4, 4-item Perceived Stress Scale; and QD2A, questionnaire of depression 2nd
version abridged.
*OR is given per 5-point increment for the PSS-4 and per unit for the other continuous
variables.
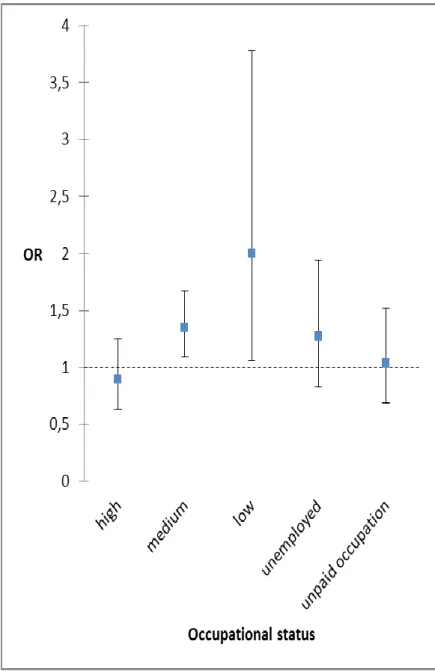
Table 3. Association between baseline perceived stress and high BP (see text) at follow-up across occupational categories in women. Odds ratios (OR) are given per 5-point increment of the 4-item Perceived Stress Scale score (ie, the difference between the 25th and the 75th percentile).
OCCUPATIONAL STATUS OR [95%CI]
High 0.89 (0.63-1.25)
Medium 1.35‡ (1.09-1.67)
Low 2.00§ (1.06-3.78)
Unemployed 1.27 (0.83-1.94)
Unpaid occupation 1.03 (0.69-1.52)
CI, confidence interval. ‡ P<0.01; § P<0.05.
Figure 1. Association between baseline perceived stress and high BP (see text) at follow-up across occupational categories in women. Odds ratios (OR) are given per 5-point increment of the 4-item Perceived Stress Scale score (ie, the difference between the 25th and the 75th percentile).
Text S1. English version of the 4-item Perceived Stress Scale (PSS-4) Instructions
The questions in this scale ask you about your feelings and thoughts during the last
month. In each case, please indicate with a check how often you felt or thought a certain
way.
1. In the last month, how often have you felt that you were unable to control the important things in your life?
___0=never ___1=almost never ___2=sometimes ___3=fairly often ___4=very often
2. In the last month, how often have you felt confident about your ability to handle your personal problems?
___0=never ___1=almost never ___2=sometimes ___3=fairly often ___4=very often
3. In the last month, how often have you felt that things were going your way?
___0=never ___1=almost never ___2=sometimes ___3=fairly often ___4=very often
4. In the last month, how often have you felt difficulties were piling up so high that you could not overcome them?
___0=never ___1=almost never ___2=sometimes ___3=fairly often ___4=very often
Scoring
PSS-4 scores are obtained by reverse coding the positive items, e.g., 0=4, 1=3, 2=2, etc.
Figure S1. Flow chart of the study population selection
Individuals with one visit only
N=222,963
Population with two visits between January 1996 and December 2011
N=46,510
Final Population
N=19,766
Population with at least one visit between January 1996 and December 2011
N=269,473
Individuals with psychotropic drugs
N=2,046
and / or
Individuals with a history of cardiovascular or renal disease
N=1,858 N=1,516
Individuals with missing data
N=9,151
Population with two visits between January 1996 and December 2011
without missing data
N=37,359
Population ≥30 years with two visits between January 1996 and December 2011 and without high blood pressure at
baseline
N=23,670
Individuals with age <30
N=2,914
and / or
Individuals with high blood pressure at baseline
Table S1. Baseline characteristics of included and excluded participants.
Participants with 1 visit Participants with 2 visits p
CONTINUOUS VARIABLES N Mean SD N Mean SD
Age (years) 222,963 43.93 (13.22) 46,510 47.06 (12.30) <0.001
Perceived Stress (PSS-4) 219,391 4.26 (3.08) 45,363 4.14 (3.07) <0.001
Depressive mood (QD2A) 216,948 1.68 (2.7) 44,744 1.76 (2.71) <0.001
Perceived health status (10-point scale)
222,619 7.25 (1.79) 46,418 7.39 (1.77) <0.001
Systolic BP (mmHg) 214,031 128.61 (18.02) 45,791 129.24 (17.38) <0.001
Diastolic BP (mmHg) 213,630 77.03 (11.21) 45,722 77.64 (10.91) <0.001
Heart rate (beats per minute) 203,714 64.04 (10.66) 42,957 63.18 (10.11) <0.001
Fasting glycemia (mmol/L) 221,358 5.39 (1.02) 46,339 5.38 (0.87) 0.017
DISCRETE VARIABLES N (%) N (%)
High BP (see text) <0.001
No 154,647 (72.1) 32,538 (71.0) Yes 59,929 (27.9) 13,290 (29.0) Gender <0.001 Men 136,569 (61.3) 30,096 (64.7) Women 86,394 (38.7) 16,414 (35.3) Occupational status <0.001 High 68,624 (30.8) 16,142 (34.8) Medium 72,443 (32.6) 13,550 (29.1) Low 27,689 (12.4) 4,638 (10.0) Unemployed 28,544 (12.8) 8,071 (17.4) Unpaid occupation 25,258 (11.3) 4,021 (8.6) Living status <0.001 Living alone 63,288 (28.5) 12,239 (26.4) Not living alone 159,038 (71.5) 34,156 (73.6)
BMI (kg/m2) <0.001 <18.5 6,429 (2.9) 1,039 (2.2) 18.5-24.9 115,677 (52.3) 24,866 (53.7) 25-29.9 72,981 (33.0) 16,214 (35.0) ≥30 25,966 (11.7) 4,181 (9.0) Smoking status <0.001 No-smokers 114,504 (52.6) 25,482 (55.6) Ex-smokers 40,875 (18.8) 9,703 (21.2) 1-10 cigarettes/day 29,577 (13.6) 5,505 (12.0) 11-20 cigarettes/day 24,949 (11.5) 3,855 (8.4) >20 cigarettes/day 7,831 (3.6) 1,246 (2.7) Alcohol intake <0.001 0 glasses/week 154,317 (69.2) 27,774 (59.7) 1-6 gl./w. for women or 1-13 gl./w. for
7-20 gl./w. for women or 14-27 gl./w.
for men 18,869 (8.5) 3,904 (8.4)
>21 gl./w. for women or >28 gl./w. for
men 10,138 (4.5) 1,928 (4.1)
Regular physical activity <0.001
<1 hour of walking/day 123,250 (55.3) 24,793 (53.5) ≥1 hour of walking/day 99,640 (44.7) 21,715 (46.7)
Familial history of hypertension
Yes 66,247 (29.8) 13,740 (29.5)
No 156,180 (70.2) 32,769 (70.5) 0,301
BMI indicates body mass index; BP, blood pressure; PSS-4, 4-item Perceived Stress Scale; QD2A, questionnaire of depression 2nd version abridged; and SD, Standard Deviation.